A Tale of Two Dividend ETFs
Dividend exchange-traded funds (ETFs) have long been favored by investors who seek regular income along with the potential for capital appreciation. In this analysis, we take a closer look at two popular dividend ETFs: the JPMorgan Equity Premium Income ETF (JEPI) and the Schwab US Dividend ETF (SCHD).
We’ll dive into their unique features, compare their performances, and highlight key considerations of JEPI vs. SCHD.
JEPI: Income Generation with Options Strategy
JEPI is known for its high-yield distribution and monthly dividend payments, making it attractive for income-focused investors. What sets JEPI apart is its unique strategy:
- High-Yield Distribution: JEPI pays an impressive yield of 11.5%.
- Options Strategy: The fund sells out-of-the-money call options to boost yield.
- Equity Linked Notes (ELNs): JEPI uses ELNs, a blend of fixed income and equity returns.
- Actively Managed: With a 0.35% expense ratio, JEPI is actively managed by an experienced team.
Despite its attractive income, investors should be aware of the limited upside potential due to the fund’s options strategy.

SCHD: Steady Dividend Growth and Capital Appreciation
SCHD takes a more traditional approach, focusing on US dividend stocks that have a track record of stable growth.
- Dow Jones Industrial US Dividend 100 Index: The fund aims to track this index.
- Low-Cost Fund: SCHD boasts a low expense ratio of 0.06%.
- Defensive Sectors: SCHD has larger exposure to sectors that are more defensive in nature.
Investors in SCHD benefit from both dividend income and potential capital gains over time.
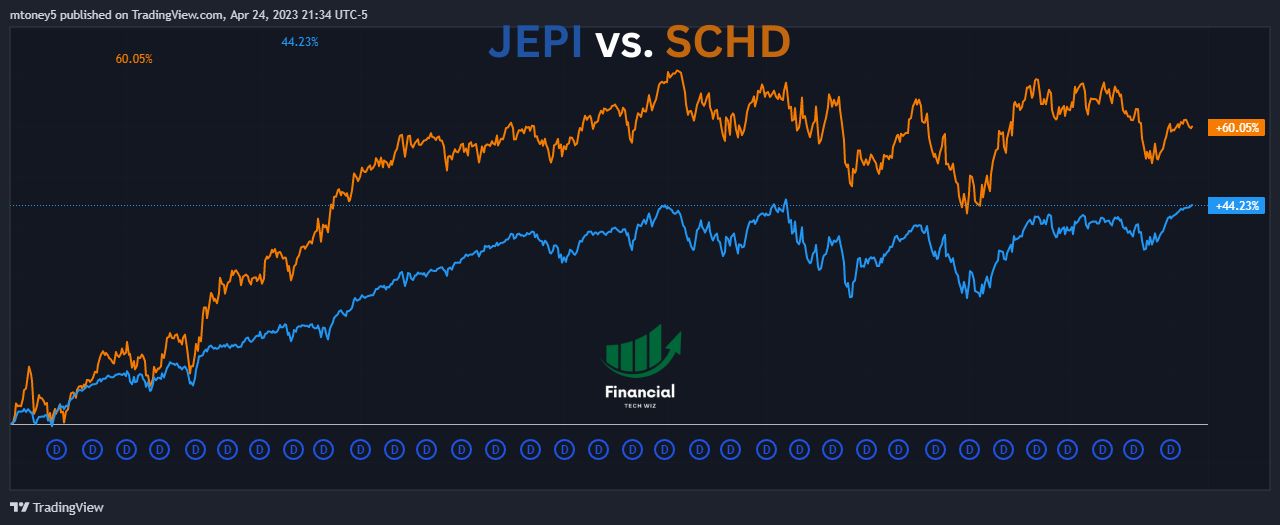
Performance Insights: JEPI vs. SCHD Total Returns
JEPI and SCHD have shown different performance trends since May 2020:
- JEPI Total Return: 44.23%
- SCHD Total Return: 60.05%
While JEPI’s high yield is appealing, SCHD’s stronger capital appreciation has led to higher total returns.
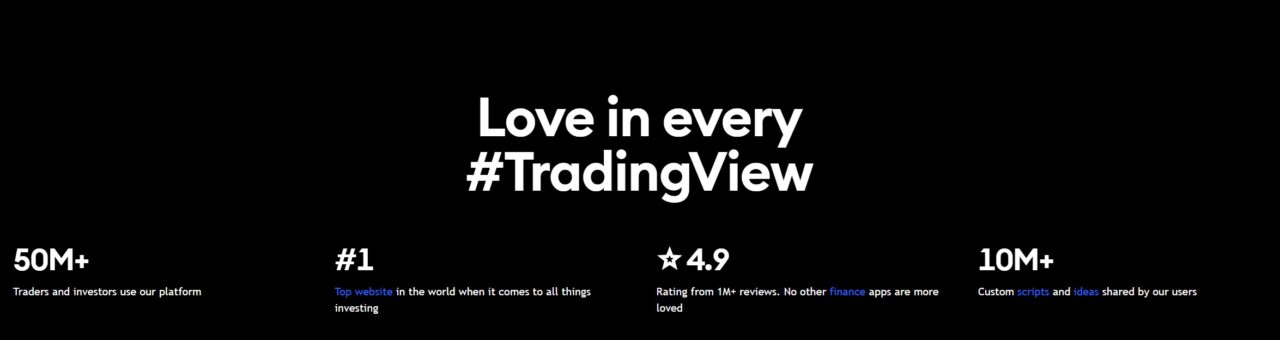
Comparing ETFs With TradingView
When comparing ETFs, it is crucial that you are comparing the total return to include dividend payments. TradingView allows you to compare several stocks and ETFs at once on a single chart adjusted for dividends.
You can simply sign up for a free TradingView account and type the stock ticker you want to compare. Next, click the plus sign next to the ticker at the top left of the chart to add symbols to compare.
Finally, ensure you click the ‘ADJ’ at the bottom to adjust the returns for dividends!
As you can see in the TradingView chart below, you can compare multiple funds and ETFs on a single chart, making your research much easier. Feel free to compare any ETFs you’d like using the widget.
Making the Right Choice: Income vs. Growth
The choice between JEPI and SCHD ultimately depends on individual investor preferences:
- Income Seekers: JEPI’s high yield and monthly dividends make it suitable for income-oriented investors.
- Growth Seekers: SCHD’s emphasis on dividend growth and capital appreciation aligns with long-term growth objectives.
It’s important to weigh the trade-offs between high yield and capital growth when making your selection.
Final Thoughts: Balancing Yield and Potential
JEPI and SCHD each offer unique benefits to dividend investors. JEPI stands out for its high income generation, while SCHD offers a more traditional approach with an emphasis on dividend growth and capital gains.
As with any investment decision, consider your risk tolerance, investment horizon, and income goals before choosing the ETF that best aligns with your financial objectives.
For investors interested in exploring additional investment options and comparisons in the world of high-yield ETFs, there are two noteworthy articles on Financial Tech Wiz that provide valuable insights.
In the article titled “JEPI vs. JEPQ: Comparing Two High-Yield ETFs,” we conduct an in-depth analysis of JPMorgan Equity Premium Income ETF (JEPI) and JPMorgan Equity Premium Quality ETF (JEPQ) and examine their similarities and differences.
Additionally, for a closer look at how JEPI stacks up against another popular covered call ETF, readers can explore the article “QYLD vs. JEPI: Evaluating Covered Call ETF Strategies,” which offers a comprehensive comparison between JEPI and the Global X NASDAQ-100 Covered Call ETF (QYLD).
The Financial Tech Wiz ETF Comparison Tool
You can use the ETF comparison tool below to compare over 2,000 ETFs and mutual funds with data I manually collected:
Before you go
If you want to keep educating yourself about personal finance, you must check out these posts as well:
What is the Most Successful Options Strategy
Options Trading for Income: The Complete Guide
Mark Minervini's Trading Strategy: 8 Key Takeaways
The Best Options Trading Books
The Best Laptops and Computers for Trading
How to Get a TradingView Free Trial
The Best TradingView Indicators
This article contains affiliate links I may be compensated for if you click them.