VOO vs. SCHD Overview
VOO and SCHD are popular exchange-traded funds (ETFs) that provide exposure to the U.S. stock market. This article compares their performance and discusses the difference between these ETFs.
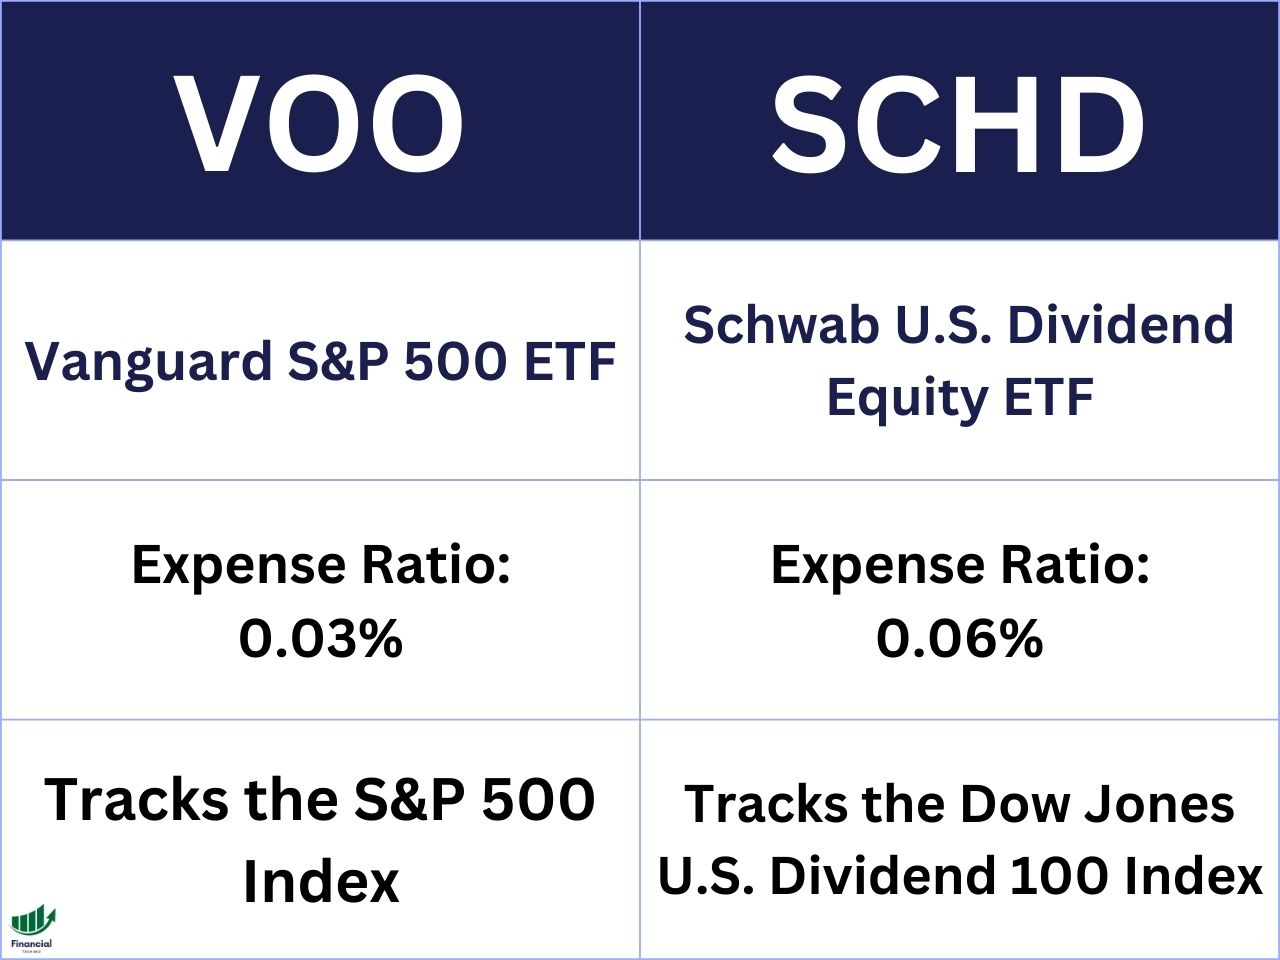
VOO: Vanguard S&P 500 ETF
VOO is a passively managed ETF designed to track the performance of the S&P 500 Index, which represents the 500 largest publicly traded companies in the U.S. The fund was launched in September 2010 and has gained popularity due to its low expense ratio of 0.03%.
SCHD: Schwab U.S. Dividend Equity ETF
SCHD is a passively managed ETF that tracks the Dow Jones U.S. Dividend 100 Index. It focuses on dividend-paying stocks and offers a higher dividend yield compared to VOO. SCHD was launched in October 2011 and has attracted investors seeking dividend optimization. The expense ratio of SCHD is 0.06%, which is slightly higher than VOO.
Performance Comparison
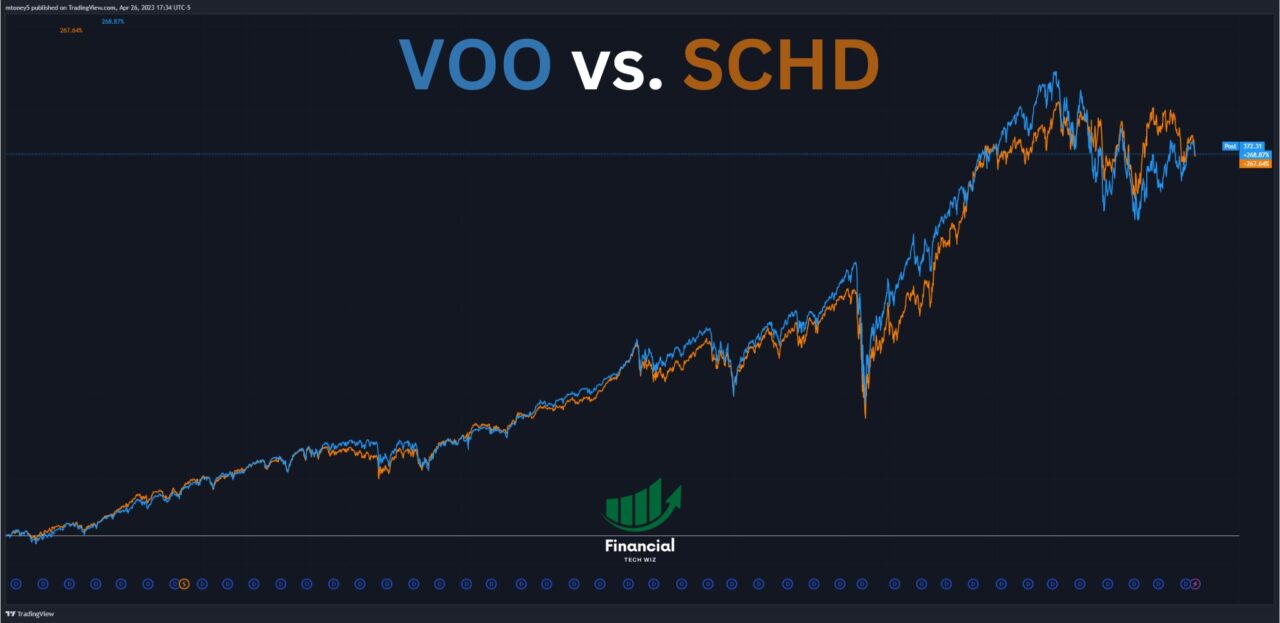
Total Return Comparison from February 2012
- VOO has achieved a total return of 268% since February 2012.
- SCHD has delivered a total return of 267% during the same period
Over long periods these ETFs have provided essentially the same return. Therefore, your choice should depend on your overall investment goals and risk tolerance.
Those who want a higher dividend should opt for SCHD, while those looking for overall market exposure should opt for VOO.
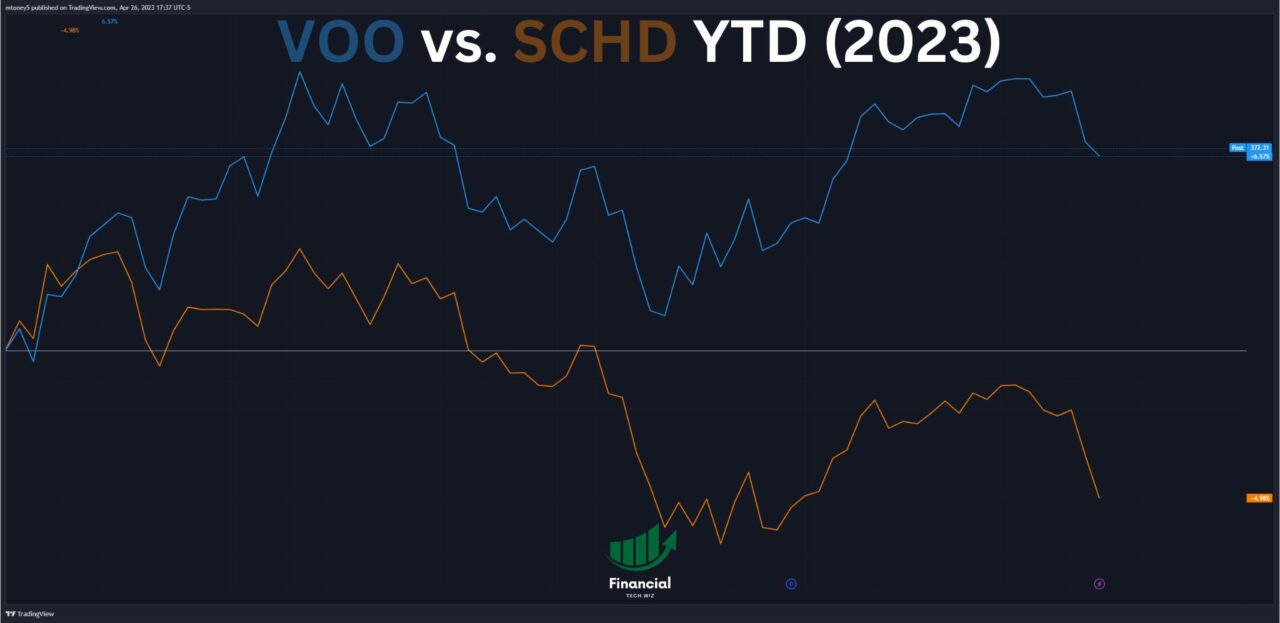
YTD Performance Comparison
- SCHD is down 5% year-to-date (YTD)
- VOO is up 6.5% YTD
The S&P 500 (VOO) is outperforming in 2023 since it capitalizes on share price growth more than SCHD. The market has increased in 2023, but in years when the market is not so bullish, SCHD will likely outperform.
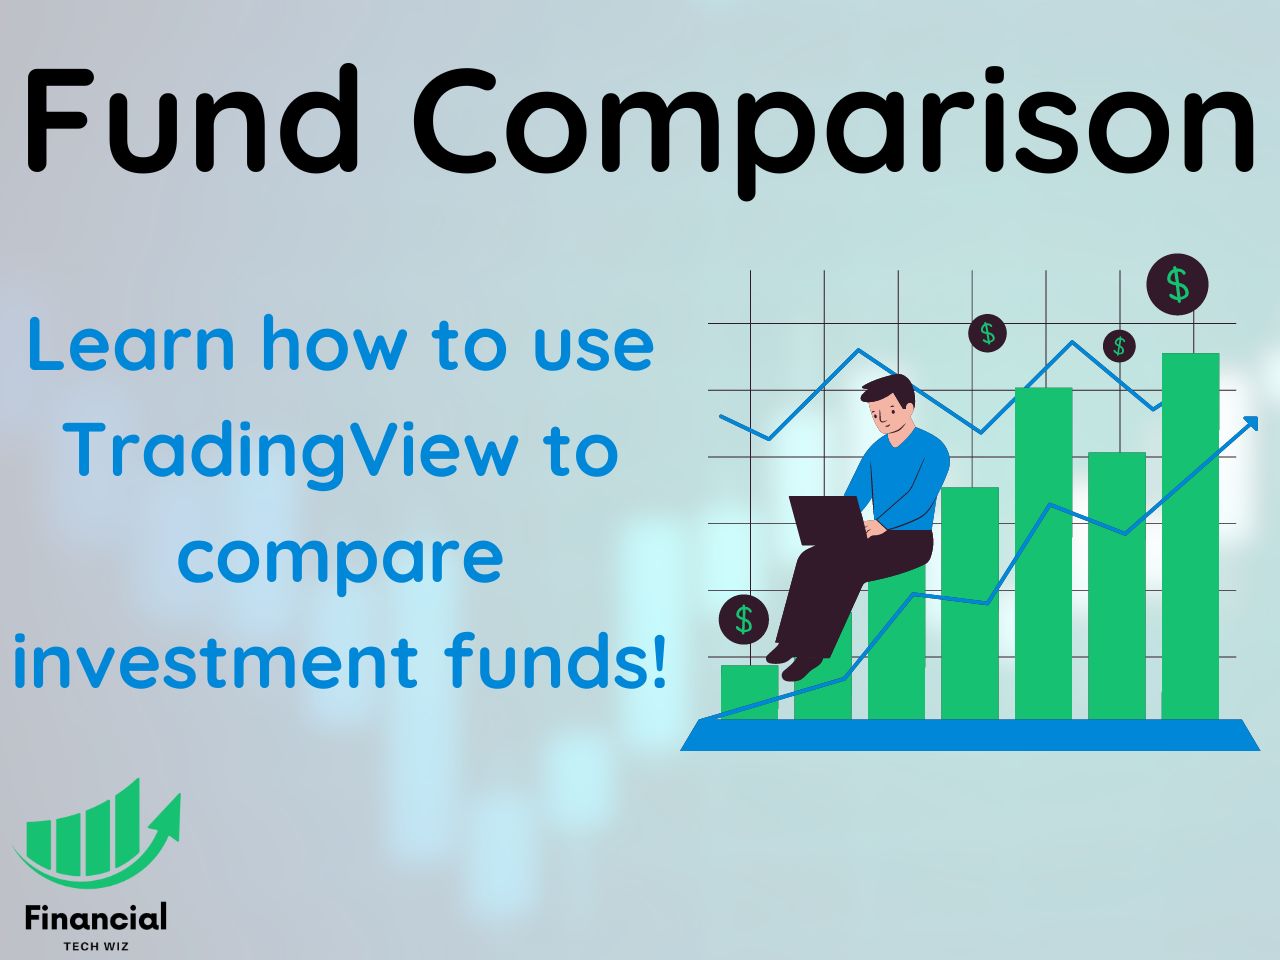
Comparing ETFs With TradingView
When comparing ETFs, it is crucial that you are comparing the total return to include dividend payments. TradingView allows you to compare several stocks and ETFs at once on a single chart adjusted for dividends.
You can simply sign up for a free TradingView account and type the stock ticker you want to compare. Next, click the plus sign next to the ticker at the top left of the chart to add symbols to compare.
Finally, ensure you click the ‘ADJ’ at the bottom to adjust the returns for dividends!
As you can see in the TradingView chart below, you can compare multiple funds and ETFs on a single chart, making your research much easier. Feel free to compare any ETFs you’d like using the widget.

Characteristics and Differences
Diversification and Holdings
- VOO provides broad exposure to the overall U.S. stock market through the S&P 500 Index.
- SCHD focuses on dividend-paying stocks, contributing to its performance during the selected timeframes.
Focus on Dividends and Share Growth
- SCHD’s emphasis on dividend-paying stocks has attracted investors seeking dividend optimization.
- VOO’s broader exposure to the overall U.S. stock market makes it a suitable choice for those seeking share growth from the broader market
VOO vs. SCHD | Bottom Line
When comparing the performance of VOO and SCHD, we can observe that from February 2012, VOO has achieved a slightly higher total return of 268% compared to SCHD’s 267%. However, YTD performance shows SCHD with a decline of 5%, while VOO has gained 6.5%.
Considering the different characteristics and objectives of VOO and SCHD, investors should carefully evaluate their investment goals and risk tolerance. SCHD’s focus on dividend-paying stocks makes it an attractive option for those prioritizing dividends and share growth. On the other hand, VOO provides broader exposure to the U.S. stock market, appealing to investors seeking overall market share growth.
For a visual representation of the performance and further analysis, you can refer to the TradingView chart comparing VOO and SCHD performance.
The Financial Tech Wiz ETF Comparison Tool
You can use the ETF comparison tool below to compare over 2,000 ETFs and mutual funds with data I manually collected:
Before you go
If you want to keep educating yourself about personal finance, you must check out these posts as well:
What is the Most Successful Options Strategy
Options Trading for Income: The Complete Guide
Mark Minervini's Trading Strategy: 8 Key Takeaways
The Best Options Trading Books
The Best Laptops and Computers for Trading
How to Get a TradingView Free Trial
The Best TradingView Indicators
This article contains affiliate links I may be compensated for if you click them.