TrendSpider is an advanced charting and automated AI technical analysis platform built for traders. Over my several years of trading, I have used nearly every platform available, and I believe TrendSpider is one of the best for charting. Continue reading to learn more about TrendSpider and what to consider before spending money on it.
Overview of TrendSpider
TrendSpider
✓ Real-time data included
✓ 16 charts per layout
✓ AI-powered analysis tools
✓ Pricing: $74-$149 per month
25% Off Coupon Code: FTW25
Pros
✓ Automated technical analysis features make charting easy
✓ Seasonality trends help you spot which months a stock performs well
✓ Track all markets, including stocks, ETFs, futures, crypto, and forex
✓ Use up to 16 charts per layout, which is much higher than any competitor I have used
Cons
✗ The web-based platform can feel clunky at times, while TradingView runs a bit smoother
✗ A bit pricy when compared to competitors
Review of TrendSpider Charting & Indicators
When it comes to charting on TrendSpider, it provides everything a trader would want, including over 200 indicators to choose from and the ability to have up to 16 charts on one layout. TrendSpider offers a plethora of drawing tools, plus the automated features will draw trendlines for you.
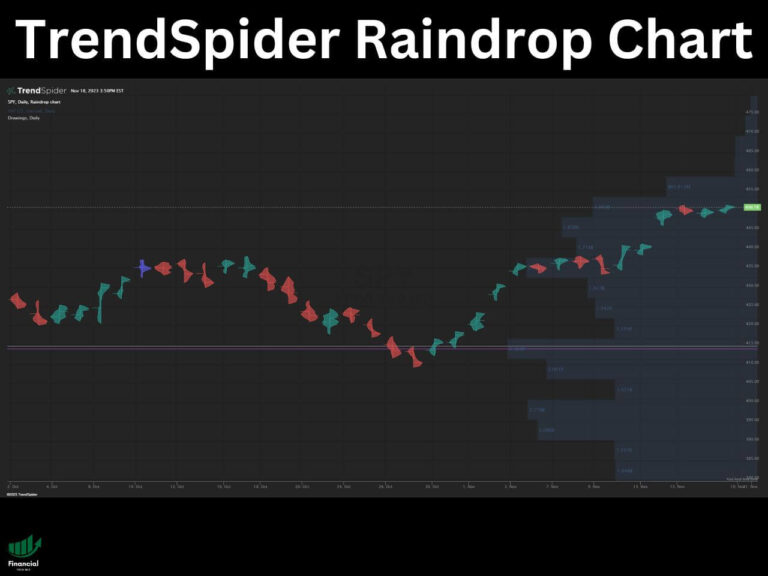
The platform even has its own proprietary chart type called raindrop charts, which is essentially like a volume profile built into a candle. Another feature I like about TrendSpider is the ability to set anchor points. For example, you can set the anchor point at the lowest point on the chart so your volume by price and anchored VWAP only show you the most relevant volume data.
The only downside I have noticed about TrendSpider is the platform can feel a bit laggy at times, but it is not bad enough to be a huge burden. However, it is something to note if your computer isn’t the fastest.
TrendSpider’s Automated Technical Analysis Features
One of the best features of TrendSpider is the automated technical analysis tools. Here are all of the automated tools that TrendSpider offers:
Fibonacci levels – automatically draws Fibonacci retracements on your chart. My experience using this tool was hit or miss. Sometimes it worked perfectly, but sometimes I would prefer it to have drawn the retracements in different spots.
Trend lines – automatically draws several trend lines on your chart so you never miss key trends. The auto trend lines features is awesome, and it definitely catches lines that the human eye could easily miss.
Candlestick patterns – automatically detects candlestick patterns such as Doji and hammer candles. The auto candlestick pattern recognition is hit or miss in my experience, but it doesn’t hurt to turn it on.
Chart patterns – automatically detect triangles, head and shoulders, channels, and more. The auto chart patterns tool works well most of the time in my experience using it.
Heatmap – detects areas of support and resistance based on historical levels. The heatmap tool is a great extension to volume by price and helps highlight key levels.
Using TrendSpider’s Scanner
Another great feature of TrendSpider is the scanner it offers, which can be prompted with a GPT condition or from a list of parameters. If you prompt the GPT parameters correctly, scanning for your exact parameters takes much less time.
For example, instead of manually adding a parameter to scan for stocks above the 200 SMA, you can simply type “above 200 SMA,” and it will add the parameter for you. In my experience, it actually works better than I expected, and I highly recommend you try it if you are looking for an easy scanner.
TrendSpider Indicators
TrendSpider allows you to use tons of indicators from basic ones like the RSI and moving average lines to the volume by price. You can add indicators to TrendSpider by clicking the indicators button at the top of any chart. From here you can search for any indicators you like. Alternatively, you can click the assistant button at the top right of the chart to add indicators by simply typing in a command like “add Ichimoku indicator.”
TrendSpider Volume by Price
The volume by price indicator, also known as the volume profile indicator on other platforms, allows you to see volume horizontally instead of vertically. This allows you to determine areas of supply and demand with ease.
Volume shelves, also known as high volume nodes, are price levels where a lot of volume has been traded. This indicates it is a significant area of support or resistance, since many traders are either long or short at that price level. You can spot a volume shelf on the chart by adding volume by price to your chart and finding the price levels with the longest horizontal bars.
TrendSpider’s AI Assistant
One of my favorite features of the TrendSpider platform is the AI assistant you can access at the top right of the platform. You can use this assistant to do anything from removing indicators from your chart to setting up advanced technical screens.
The assistant is essentially an AI chatbot built into the platform that you can prompt. For example, if you want to add the RSI indicators to your chart, instead of manually adding it, you can simply type, “add RSI indicator” and it will bring up a list of options you can choose from to complete the action.
Is TrendSpider Worth It?
While TrendSpider is a bit expensive compared to its competitors, I believe it is worth it for serious traders who want automated analysis and advanced indicators. You can also take advantage of my affiliate link to save 25% on your subscription. During the checkout process, enter the coupon code FTW25 to claim your 25% off discount! TrendSpider is incredibly innovative and offers proprietary features like raindrop charts and promptable scanners.
You can watch my full review video of TrendSpider below:
Learn how to get a TrendSpider discount by watching this video!
While TrendSpider is great, I still believe that TradingView is the best overall charting software for most people due to its freemium model and much lower plan prices for premium features. However, TrendSpider does have more to offer than TradingView if you are willing to pay the price for it. I recommend you try several charting software out and decide which suits your needs the best before committing to an annual plan.
TrendSpider is one of the best charting software for stocks and provides tons of cool automated technical analysis tools. Continue reading to learn more about each of the TrendSpider plans and how much they cost.
TrendSpider Pricing Key Takeaways
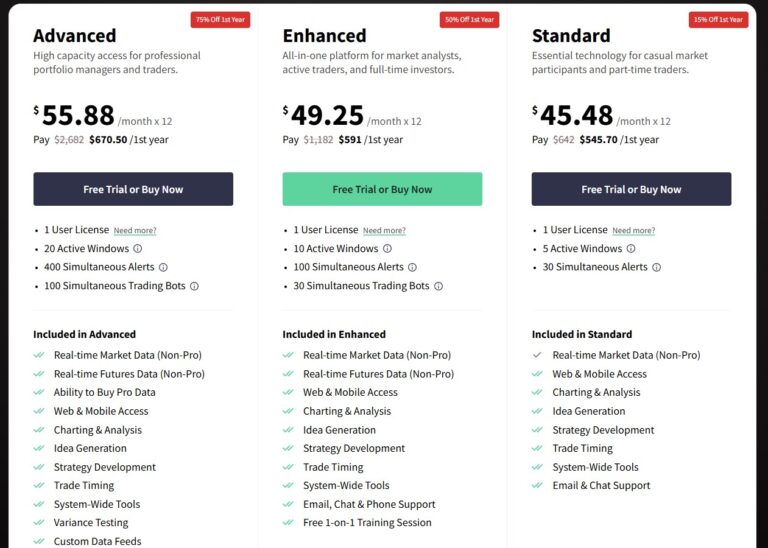
TrendSpider’s normal pricing ranges from $107-$447/month or $1,284-$2,682/year.
Occasionally, TrendSpider runs discounts that make the starting price around $53 per month.
TrendSpider offers three plans: Standard, Enhanced, and Advanced.
You can save 25% off your TrendSpider subscription using the coupon code: FTW25.
TrendSpider costs $107-$447 per month or $1,284-2,682 annually, depending on which plan you choose. However, you can save 25% off your subscription when you use my affiliate link and enter my promo code: FTW25. TrendSpider will also run sales occasionally which will lower the starting price to around $53 per month. You can ensure you get the best deal by using my affiliate link and coupon code to sign up.
TrendSpider Plans Comparison
TrendSpider offers three plans: Standard, Enchanced, and Advanced. You can compare these plans using the table below:
TrendSpider is worth it if you like the option of having up to 16 charts per layout and real-time data included in the pricing. TradingView charges $59 per month for its highest plan, which only comes with eight charts per layout, plus you still have to purchase additional real-time data. Consider reading my full review of TrendSpider before purchasing a subscription to learn more.
TrendSpider also comes with many additional features, such as automated technical analysis and its proprietary raindrop charts. Overall, TrendSpider offers more features than TradingView, but it costs more. I recommend trying both platforms and sticking with the one that you prefer most. You can read my article comparing TrendSpider and TradingView to learn more.
TrendSpider is an advanced charting platform you can use to track stocks, crypto, futures, forex, and more. Here are some of the main features of TrendSpider:
Advanced screeners – you can prompt the screener with sentences like “stocks above 200 SMA”
Proprietary raindrop charts – an advanced alternative to candlestick charts
Multiple charts per layout – use up to 16 charts on a single screen
Backtesting – no-code backtesting capabilities to test indicators, patterns, and more
If you are looking for a powerful and reliable platform to analyze and trade the financial markets, you might have come across TradingView and TrendSpider.
In this article, we will compare TradingView and TrendSpider based on their main features, benefits, drawbacks, and pricing. By the end of this article, you will have a clear idea of which platform suits your needs and preferences better.
Key Takeaways
TradingView is best if you want advanced charting tools for the best price, while TrendSpider is best for those looking for additional features like automated technical analysis and more charts per layout.
TrendSpider is a bit more expensive, but the pricing includes real-time data for most assets except futures.
TradingView is one of the most widely used platforms for charting, screening, and trading the financial markets. It supports a wide range of markets and data sources, including international stocks, bonds, forex, crypto, and futures.
You can access TradingView from any web browser or mobile device, as well as integrate it with popular brokers such as Oanda, Interactive Brokers, TradeStation, and more.
Some of the main features and benefits of TradingView are:
A powerful and user-friendly screener that allows you to filter by technical and fundamental criteria, such as price, volume, indicators, earnings, dividends, ratings, and more.
A large library of indicators and drawing tools, as well as the ability to create custom indicators using Pine Script, a proprietary coding language that is easy to learn and use.
A direct broker integration that enables you to trade from the platform without switching to another application or website. You can also use paper trading to practice your strategies without risking real money.
A social network that enables you to share your ideas, learn from experts, and access live streams and trade signals. You can also join chat rooms, follow other traders, comment on charts, and participate in contests.
If you want to try TradingView risk-free, you can sign up for a TradingView free trial to test out all of the premium features at no cost! When you use my affiliate link to register, you will also get a discount on your subscription. You can also read my full review of TradingView to learn more.
TrendSpider is a great alternative to TradingView for those who want a more advanced platform with automated technical analysis tools and more charts per layout.
TrendSpider is a relatively new platform that aims to automate technical analysis and make it easier and faster for traders. It uses artificial intelligence and machine learning to draw trendlines, chart patterns, Fibonacci retracements, candlestick patterns, and more. It also allows you to create custom strategies and backtest them with historical data.
Some of the main features and benefits of TrendSpider are:
An advanced automated chart pattern recognition that draws trendlines, chart patterns, Fibonacci retracements, candlestick patterns, and more. You can also adjust the sensitivity and accuracy of the automation according to your preferences.
A no-code custom strategy builder and backtester that allows you to test different scenarios and optimize your trading performance. You can use predefined templates or create your own based on custom parameters.
A comprehensive technical screener that incorporates pattern recognition and multiple timeframes. You can scan for stocks that match your criteria across different timeframes simultaneously.
An alternative data integration that provides insights from social media sentiment, analyst estimates, dark pool volume, short volume, and more. You can use these data sources to complement your technical analysis and find hidden opportunities.
If you want to try TrendSpider out, you can get 25% off your subscription using my affiliate link and the code: FTW25! You can also read my full review of TrendSpider for more information.
Factors to Consider Between TradingView & TrendSpider
Both TradingView and TrendSpider offer excellent features and benefits for traders of all levels and styles. However, there are some differences between them that you should consider before choosing one over the other. Here is a table comparing some key features of TradingView and TrendSpider:
Indicator Selection
Both TradingView and TrendSpider offer plenty of indicators for technical analysis. However, there are some differences in their indicator selection that might affect your trading style.
TradingView Indicator Selection
TradingView offers session volume profiles, which show the distribution of volume within a specific day. This is great for day traders who enjoy using volume or market profile.
TradingView also has a large community of people creating custom indicators using Pine Script, which is a proprietary coding language that is easy to learn and use. You can find thousands of custom indicators on TradingView’s public library or create your own based on your needs and preferences.
TrendSpider Indicator Selection
TrendSpider only offers volume by price, which shows the distribution of volume across different price levels over several days. The volume by price can be anchored from anywhere on the chart, so technically, you can anchor it at the start of the day to simulate a session volume profile.
TrendSpider does not have a similar community custom indicator feature, but its team is a lot more responsive and knowledgeable about trading, reducing the need for the community aspect.
Backtesting
Backtesting is the process of testing your trading strategies with historical data to evaluate their performance and profitability. Both TradingView and TrendSpider allow you to create and backtest your own trading strategies with custom parameters.
You can also write your own trading strategies using Pine Script, which gives you more flexibility and control over your logic and rules.
You can then use TradingView’s strategy tester to analyze the results of your backtesting, such as net profit, drawdown, win rate, and more.
TrendSpider Backtesting
TrendSpider allows you to create your own trading strategies without coding using its no-code custom strategy builder. You can use predefined templates or create your own based on custom parameters, such as indicators, patterns, timeframes, and more.
You can then use TrendSpider’s automated backtester to test your strategies with historical data and see how they would have performed in the past. The backtester allows you to compare different strategies and optimize them based on various metrics, such as net profit, drawdown, win rate, and more.
Multiple Chart Abilities
TrendSpider allows you to view up to 16 charts per layout, which is more than TradingView’s non-professional plans, which only offer up to 8 charts per layout.
This can give you more flexibility and convenience when analyzing multiple markets or timeframes at once. However, if you need more than 8 charts per layout on TradingView, you can upgrade to a professional plan that offers up to 16 charts per layout.
Another difference is that TrendSpider allows you to sync your charts across different timeframes, which means that when you change the timeframe on one chart, it will automatically change on all the other charts in the same layout.
This can help you keep your analysis consistent and save time when switching between timeframes. TradingView does not have this feature, but you can use its split-screen mode to view different timeframes side by side.
Both TradingView and TrendSpider offer excellent stock screeners that allow you to filter stocks based on various criteria. However, there are some differences in their stock screeners that might affect your trading results.
You can also use TradingView’s social network integration to find stocks that are popular or trending among other traders. You can access live streams, trade signals, chat rooms, and more from TradingView’s social network.
TrendSpider Screeners
TrendSpider offers a technical screener that incorporates pattern recognition and alternative data integration. You can filter stocks by technical criteria, such as indicators, patterns, timeframes, and more.
You can also use TrendSpider’s pattern recognition feature to find stocks that match specific chart patterns or candlestick patterns across multiple timeframes. Additionally, you can use TrendSpider’s alternative data integration to find stocks that have unusual options volume, high social media sentiment, positive analyst estimates, high dark pool volume, high short volume, and more.
Mobile App
Both TradingView and TrendSpider have solid mobile apps that make charting on the go relatively easy. However, the web platforms are, of course, much better in terms of functionality and features.
TradingView Mobile App
TradingView’s mobile app is available for iOS and Android devices. It allows you to access most of the features of the web platform, such as charts, indicators, drawing tools, and more. However, some features are not available on the mobile app, such as Pine Script editor, strategy tester, split screen mode, and more.
TrendSpider Mobile App
TrendSpider’s mobile app is only available for iOS devices. It allows you to access most of the features of the web platform, such as charts, indicators, drawing tools, screeners, pattern recognition, and more. However, some features are not available on the mobile app, such as strategy builder, backtesting, alternative data integration, and more.
Pricing
TrendSpider is slightly more expensive than TradingView, but it also comes with more features and real-time data at no additional cost. TradingView charges for real-time data on top of the subscription charge, although many popular ETFs like SPY are just barely 1 second delayed without paying on TradingView.
TradingView’s pricing starts from $14.95/month for the basic plan and goes to $59.95/month for the highest tier subscription.
However, these prices do not include real-time data for most markets. You have to pay extra charges for real-time data depending on the market you want to access.
TrendSpider’s pricing starts from $39/month for the standard plan and goes up to $179 per month for the highest tier
These prices include real-time data for most markets except futures. You have to pay extra charges for futures data depending on the exchange you want to access.
TradingView vs. TrendSpider | Bottom Line
TradingView and TrendSpider are both excellent platforms for charting, screening, and trading the financial markets. However, they have some differences that might make one more suitable for you than the other.
Ultimately, the choice between TradingView and TrendSpider depends on your personal preferences and trading goals. You can try both platforms for free for a limited time and see which one works better for you. Alternatively, you can use both platforms together to get the best of both worlds.
Among TrendSpider’s innovative offerings, Raindrop Charts stand out as a revolutionary way to visualize price and volume data.
These charts offer a more advanced perspective compared to traditional charting methods by effectively blending the volume profile with candlesticks.
Understanding Raindrop Charts
Unlike conventional candlestick charts, which focus on open, high, low, and close prices, Raindrop Charts incorporate volume into their visual representation.
Raindrop charts allow you to view advanced data like the VWAP and volume by price in a simpler way. Generally, the raindrop charts are best used on the daily timeframe.
How to Read Raindrop Charts
The raindrop consists of a few different aspects:
Left dash: VWAP for the first half of the day
Right dash: VWAP for the second half of the day
High: The highest price of the day
Low: The lowest price of the day
Volume Shading: Shows volume activity by price
There are three different colored raindrops:
Green raindrop (Bullish): When the right dash is higher than the left
Red raindrop (Bearish): When the right dash is lower than the left
Blue raindrop (Neutral): When both dashes are at the same level
Green raindrops indicate that buyers ended the day in control, signifying bullish momentum going into the next day. However, bulls should look for prior raindrops on the chart for potential resistance levels.
Red raindrops indicate the day ended with sellers in control, meaning the bearish momentum can continue to the next day. However, bears should look for prior raindrops on the chart to see potential support levels.
Blue raindrops show that neither buyers nor sellers were in control, which can lead to a big move in either direction.
Advantages of Using Raindrop Charts
Makes trend reversals easy to spot: The raindrop charts allow you to see trend reversals easily, especially when there are blue raindrops forming. Similar to doji candles, blue raindrops can lead to breakouts.
Allows you to see volume: Unlike traditional candles, raindrops show which prices get a lot of volume, which is crucial for determining specific levels of support and resistance.
Unique to TrendSpider: Raindrop charts were invented by TrendSpider and can very well be one of the best modern charting styles created in recent times.
Practical Application in Trading
Using Raindrop Charts effectively requires understanding their nuances. For instance, a Raindrop Chart with a larger “bulge” in the second half suggests a strong volume-supported price movement.
Traders can compare Raindrop Charts with traditional charts to validate their analysis, enhancing their decision-making process in both short-term and long-term trading strategies.
How to Activate TrendSpider Raindrop Charts
On the TrendSpider platform, navigate to the top left of the chart. Next to the timeframe, you will see the icon to change the chart to raindrop charts.
TrendSpider Raindrop Charts – Bottom Line
Raindrop Charts by TrendSpider are a testament to innovation in financial charting. They offer traders a more nuanced and insightful view of the markets, combining the power of volume and price data.
If you aren’t already, you can get 25% off of TrendSpider using my affiliate link and coupon code: “FTW25” to try out raindrop charts today! I would also recommend reading my full review of TrendSpider to conitnue your research.
FAQs
What makes Raindrop Charts unique?
Raindrop Charts uniquely blend volume data with price action, offering a deeper insight into market sentiment.
Can Raindrop Charts be used for all types of trading?
Yes, they are versatile and can be adapted to various trading styles, including swing trading and day trading.
How do Raindrop Charts help in market analysis?
They assist in identifying potential trend reversals and breakout patterns, backed by volume data for added reliability.
Click get started, and choose the plan for prefer.
Fill in your personal details, and when prompted, enter the coupon code FTW25 in the box.
Complete your registration and enjoy your discounted membership!
That’s it. You’ve just secured your TrendSpider discount for life. As long as you keep your subscription active, you’ll pay less than the regular price.
Why Use TrendSpider for Technical Analysis?
TrendSpider is not just another charting platform. It’s a smart and automated system that can help you with technical analysis, market scanning, backtesting, and more. Here are some of the reasons why you should use TrendSpider for your trading:
Volume by price: TrendSpider allows you to see the volume distribution at different price levels, which can help you identify support and resistance zones, breakouts, and reversals.
Automated analysis: TrendSpider uses algorithms to detect trendlines, patterns, Fibonacci retracements, candlestick formations, and other technical indicators automatically. You can also customize the settings to match your own style and preferences.
Real-time data: TrendSpider includes real-time data for stocks, ETFs, forex, crypto, and futures in all plans. You don’t have to pay extra for data feeds or worry about delays or inaccuracies.
Dynamic price alerts: TrendSpider lets you set alerts based on various criteria, such as price movements, technical indicators, patterns, or even custom scripts. You can receive notifications via email, SMS, or browser when your conditions are met.
Automated trading bots: TrendSpider enables you to create and run trading bots that can execute your trades based on your rules. You can backtest your strategies, optimize your parameters, and monitor your performance.
These are just some of the benefits of using TrendSpider for technical analysis. There are many more features and tools that you can explore and use to improve your trading results.
TrendSpider Discount Code – Bottom Line
TrendSpider is a great platform for any serious trader who wants to take their technical analysis to the next level. It offers a unique combination of automation, intelligence, and customization that can help you find trading opportunities faster and easier.
If you want to get started with TrendSpider today, don’t forget to use my coupon code FTW25 to get a 25% discount on any plan.
Trendspider is a smart trading software that helps you find, plan, and time your trades with greater efficiency and precision.
It offers a unique set of integrated tools, such as smart charts, real-time scanners, robust backtesting, dynamic alerts, automated analysis, trading bots, and more.
Does Trendspider Offer Free Trials?
The good news is that Trendspider does offer a free trial that lasts for 7 days.
During this period, you can access all the features of the platform, depending on the plan that you choose.
You can also cancel your subscription at any time before the trial ends without being charged.
There, you will see three subscription plans: Essential, Elite, and Elite Plus. Each plan has different features and prices, so you can compare them and pick the one that suits your needs and budget.
Next, you can select between paying monthly or yearly. You can get a discount when you pay annually, depending on the current Trendspider pricing.
After that, you will need to enter your information to create an account, such as your name, email address, password, and billing details. You will also need to agree to the terms of service and privacy policy.
Once you have completed these steps, you will be able to access the Trendspider platform and start using its features for free for 7 days.
You will also receive an email confirmation with your login details and instructions on how to use the platform.
Can I Use Trendspider For Free Without an Account?
If you are not ready to sign up for a free trial yet, you might be wondering if you can use Trendspider for free without an account.
The answer is that you cannot use the Trendspider charts or other features without an account. However, they do offer some free watchlists that you can access from their website.
These watchlists include insider buying, 52-week highs and lows, social sentiment, and more. You can use these watchlists to get some insights into the market trends and opportunities.
FAQ
How long is the Trendspider free trial?
The Trendspider free trial lasts for 7 days from the day that you sign up. You can cancel your subscription at any time before the trial ends without being charged.
Can I access all the features during the free trial?
Yes, you can access all the features of the platform during the free trial, depending on the plan that you choose. For example, if you choose the Elite Plus plan, you can access all the features of the Essential and Elite plans.
Is Trendspider better than TradingView?
Both TradingView and Trendspider are excellent platforms, and you can check out my article on Trendspider vs. TradingView for an in-depth comparison.
If you have made it this far, learn how to use our TrendSpider coupon code to get a discount on your subscription!
Disclaimer: Financial Tech Wiz is an affiliate of TrendSpider and will be compensated if you use our affiliate links to purchase a TrendSpider subscription.