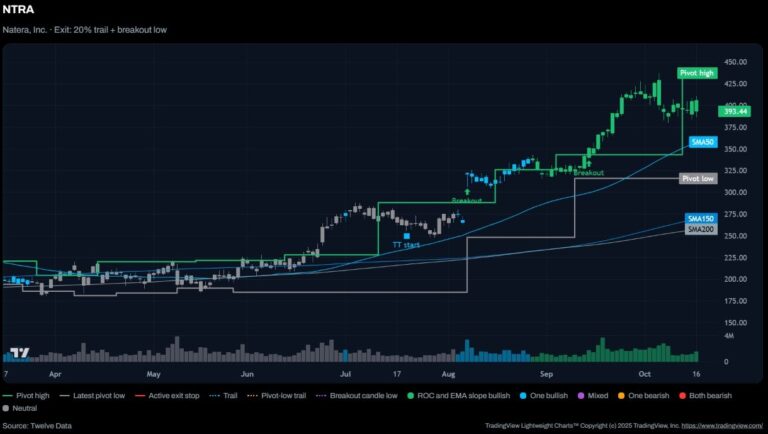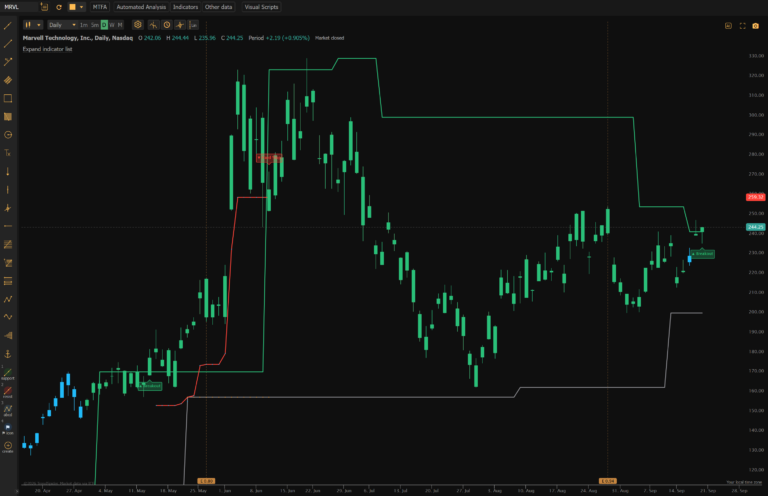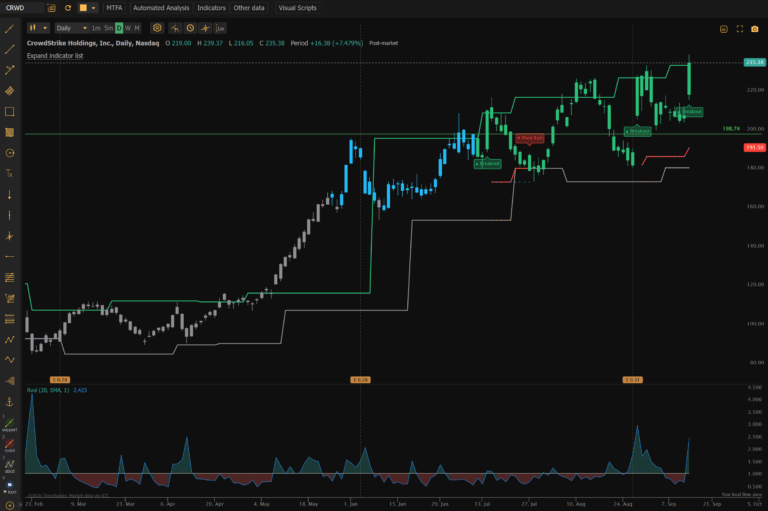
Free Trading Journal, Stock Scanners and Community
Enter your email below to join Financial Tech Wiz’s free trading community and gain access to our trading journal template, custom scanners, custom indicators, and more.
Start Free. Upgrade When You Want the Full Picture
Track trades in the free template, find breakouts with the free scanners and TrendSpider indicator, then get same-day scans, breakout history and AI review in the Financial Tech Wiz Trading Journal.
Free Trading Journal Template
A Google Sheets and Excel journal that tracks and benchmarks every trade for you.
- Auto-calculates P/L, win rate, R:R and profit factor
- Benchmarks against the S&P 500, Nasdaq and Russell
- Imports into the Financial Tech Wiz Trading Journal anytime
- No credit card needed
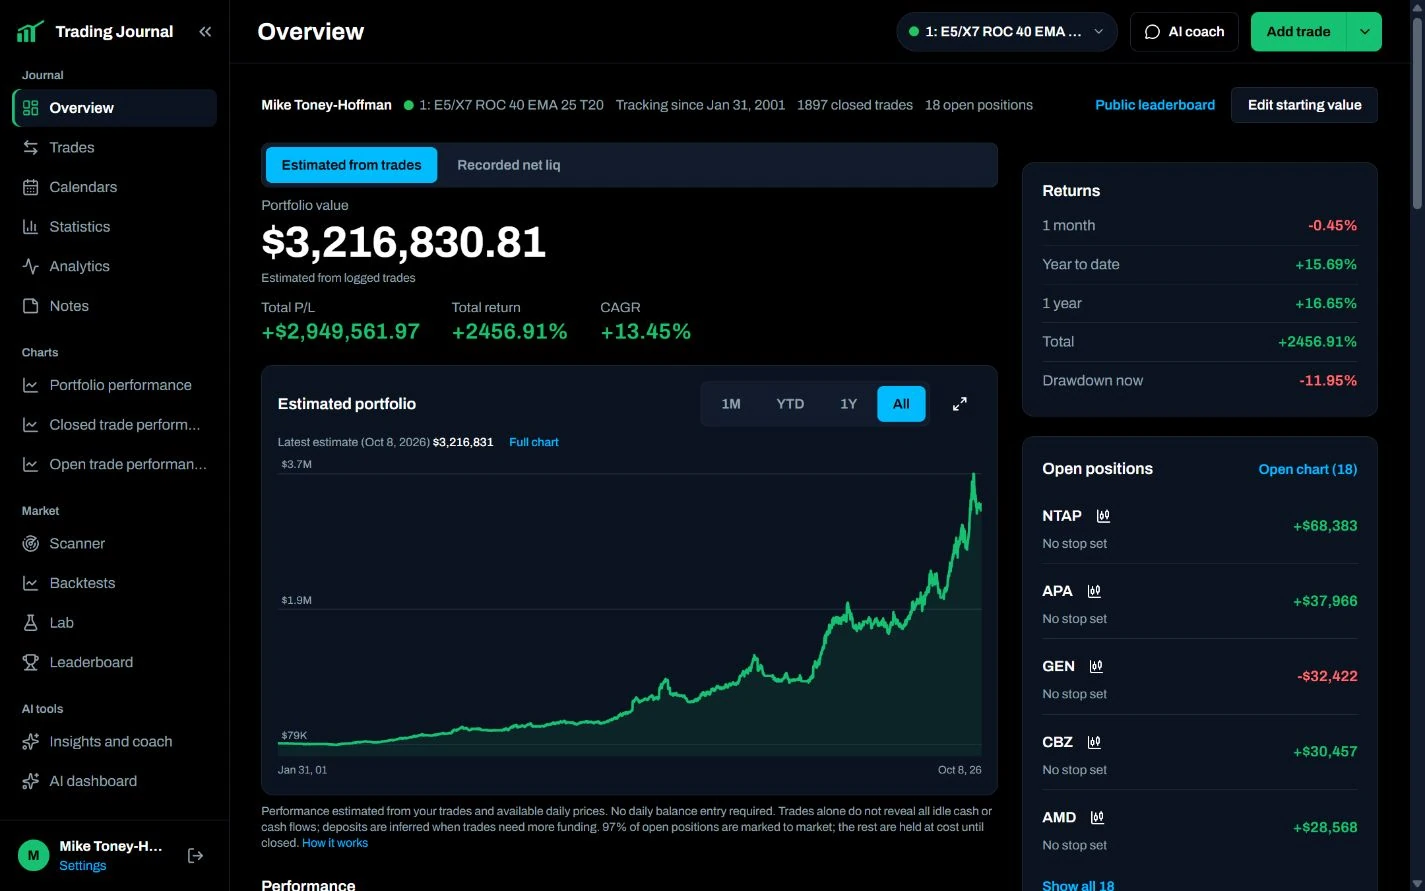
Financial Tech Wiz Trading Journal
Import your trades and backtests from 25+ brokers or a CSV and instantly see your portfolio performance across every account, with your trade analytics, AI coach and breakout scanner in one journal.
- Daily Pivot Breakout scans for all US stocks and ETFs, every day
- Every breakout since 2000, with charts and how each one played out
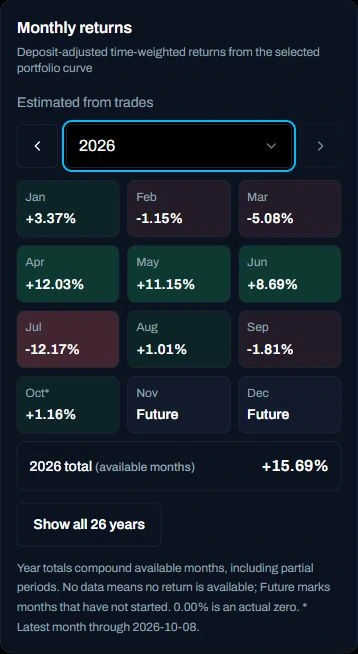
- Portfolio performance built automatically from your trades, with no manual entry. Keep accounts and strategies separate or combine them
- Premium Discord community
Free Stock Scanners and Indicator
Free breakout scans every week, plus the Daily Pivot Breakout indicator for TrendSpider.
- Top 5 breakouts each week, each with a chart
- VCP, gap, Stage 2, cup and handle scanners on the way
- Daily Pivot Breakout indicator, free on TrendSpider
- 4,000+ trader Discord community
Top results across our free stock scanners
One recent liquid result from each of our free daily stock scanners, with its chart and the other scanners it also matched. Signals run 5 trading days late; members of the Financial Tech Wiz Trading Journal see every signal the day it fires.
Daily Pivot Breakout Scanner
Stocks closing above their last confirmed pivot high with strong momentum, above-average volume and real liquidity.

TWLO: Daily Pivot Breakout on Sep 21
 Open chart for TWLO
- Daily Pivot Breakout
- ROC 87%
- Above pivot 9.1%
- Since signal +5.8%
Members saw this signal on Sep 21.See today's signals
- See all 5 free Daily Pivot breakoutsCharts, scan data and the setups each stock also matches.
Minervini Trend Template Scanner
RP above 70, aligned moving averages and a rising 200-day SMA near the 52-week high.
KOD: Trend Template match on Oct 9
 Open chart for KOD
- Trend Template match
- RP percentile 100
- 200-day slope 14.5%
- Meets the Trend Template since Sep 28, 2026
Also matching
Healthcare pick with RP 99.7 and 200-day slope of 14.46 percent. Also matched Ichimoku TK cross bullish on Oct 7 and Relative Strength bullish on Oct 9.
Members saw this match on Oct 9.See today's signals
- See all 5 free Trend Template matchesCharts, scan data and the setups each stock also matches.

Episodic Pivot Scanner
Daily lows at least 6% above the previous high, with final 20-day relative volume above 1.
KOD: Episodic Pivot on Sep 28
Open chart for KOD- Episodic Pivot
- Gap 79.4%
- RVOL 45.0x
- Since signal −4.6%
Gap of 79.44% and relative volume of 44.95x on signal day, with five other scanners matched, the most in this group; down 4.64% since Sep 28.
Members saw this signal on Sep 28.See today's signals
- See all 5 free episodic pivotsCharts, scan data and the setups each stock also matches.

Ichimoku Cloud Crossover Scanner
Daily bullish and bearish Tenkan/Kijun crossovers, together on one page.
ABCL: Bullish TK cross on Sep 24
Open chart for ABCL- Bullish TK cross
- Since signal −6.7%
Also matching
Bullish Ichimoku TK cross on Sep 24, Healthcare, mid size. Down 6.72 percent since signal. Also matched Daily Pivot Breakout, Minervini Trend Template, and Relative Strength.
Members saw this signal on Sep 24.See today's signals
- See all 5 free Ichimoku TK crossesCharts, scan data and the setups each stock also matches.

9/21 Daily EMA Crossover Scanner
Daily bullish and bearish crosses of the 9-day and 21-day EMAs.
AAMI: Bullish 9/21 EMA cross on Sep 21
Open chart for AAMI- Bullish 9/21 EMA cross
- Since signal −2.1%
Also matching
Members saw this signal on Sep 21.See today's signals
- See all 5 free 9/21 EMA crossesCharts, scan data and the setups each stock also matches.

Golden Cross Screener
Stocks whose 50-day SMA just crossed above the 200-day SMA.
ASAN: Golden Cross on Sep 17
Open chart for ASAN- Golden Cross
- 200-day slope -6.3%
- Close vs 200-day 16.1%
- Since signal −2.3%
Also matching
Members saw this signal on Sep 17.See today's signals
- See all 5 free golden crossesCharts, scan data and the setups each stock also matches.

Death Cross Screener
Stocks whose 50-day SMA just crossed below the 200-day SMA.
AKAM: Death Cross on Oct 5
Open chart for AKAM- Death Cross
- 200-day slope 3.1%
- Close vs 200-day -3.4%
- Since signal −18.7%
Also matching
Members saw this signal on Oct 5.See today's signals
- See all 5 free death crossesCharts, scan data and the setups each stock also matches.


RSI Scanner
RSI 14 crosses back above 30 and below 70, plus stocks below 20 or above 80.
ABCL: RSI back below 70 on Oct 1
Open chart for ABCL- RSI back below 70
- RSI 14 65.6
- Previous RSI 73.9
- Since signal −15.2%
Also matching
Bearish RSI Crossover from Oct 1 with RSI at 65.58, down from 73.88. Down 15.17% since signal and also matched a bearish RSI Divergence on Sep 24.
Members saw this signal on Oct 1.See today's signals
- See all 5 free RSI signalsCharts, scan data and the setups each stock also matches.

RSI Divergence Scanner
Confirmed bullish and bearish regular RSI divergences on the daily chart.
ACHC: Bullish RSI divergence on Oct 8
Open chart for ACHC- Bullish RSI divergence
- RSI at first low or high 37.4
- RSI at second 40.6
- Sessions apart 29
- Since signal +5.3%
Also matching
Bullish RSI divergence signal on Oct 8 with a 5.27% gain since. Also matched a bullish 9/21 EMA cross on Oct 7.
Members saw this signal on Oct 8.See today's signals
- See all 5 free RSI divergencesCharts, scan data and the setups each stock also matches.

Relative Strength Scanner
US stocks in the top 5% by 12-month price performance, grouped by sector.
AXTI: Relative strength leader on Sep 25
Open chart for AXTI- Relative strength leader
- RP percentile 100
- 3-month return 12.5%
- Since signal −34.8%
Relative Strength rank of 99.91 with a 12.53% 3-month return, down 34.8% since its Sep 25 signal, and matched three other scanners.
Members saw this match on Sep 25.See today's signals
- See all 5 free relative strength leadersCharts, scan data and the setups each stock also matches.

Stage 2 Stocks Screener
Stan Weinstein stage analysis: Stage 2 uptrends above a rising 30-week average that pass all six quality checks.
KOD: Stage 2 uptrend on Oct 2
Open chart for KOD- Stage 2 uptrend
- Mansfield RS 172.3
- Weeks in Stage 2 1
- Since signal −9.2%
Mansfield 172.27 and slope 8.56%, one week in Stage 2. Down 9.21% since Oct 2 signal. Matched five other scanners.
Members saw this match on Oct 2.See today's signals
- See all 5 free Stage 2 stocksCharts, scan data and the setups each stock also matches.

VCP Scanner
Trend Template stocks tightening below a 10-day-old pivot, with higher lows and drying volume.
NDSN: VCP setup on Oct 9
Open chart for NDSN- VCP setup
- Below pivot 3.2%
- Latest range 4.7%
- Volume vs prior 20 days 0.88x
- Since signal −1.8%
Signaled Oct 9 in Industrials, down 1.79% since. Also matched Minervini Trend Template, Ichimoku TK cross, and Weinstein Stage Analysis. Volume ratio 0.88.
Members saw this match on Oct 9.See today's signals
- See all 5 free VCP setupsCharts, scan data and the setups each stock also matches.

Source: Twelve Data. Charts: TradingView Lightweight Charts. Educational information, not investment advice.
Featured Trading Platforms
Whether you’re doing technical analysis, fundamental analysis, or backtesting, choosing the best trading platform can be a pain.
They can also be expensive, which is why we test and review the best ones and negotiate the best discounts for you. The links below will allow you to access the best prices for these platforms.
Trading View

TrendSpider

Stock Rover

Option Omega