Stock Rover Review 2026: Features, Pricing, Pros and Cons
Stock Rover is a stock screening and portfolio analysis platform built for self-directed investors who want to dig into fundamentals. It connects to 1,000+ brokers, runs over 700 screening metrics, and adds tools competitors charge twice as much for, like Monte Carlo simulations and an equation-based screener. This review covers the four plan tiers (Free, Essentials, Premium, Premium Plus), updated 2026 pricing, what each tier actually unlocks, the standout features like Investor Warnings and correlation analysis, and honest assessments of where the platform earns its price versus where the learning curve and missing mobile app make it a poor fit for certain trader types.
Key Takeaways
- Stock Rover’s screener runs on 700+ fundamental metrics across stocks, ETFs, and mutual funds, with the full library unlocked on the Premium Plus tier ($27.99/month or $279.99/year). The entry-level Essentials plan at $7.99/month opens the screener but locks roughly two-thirds of the metric library behind a visible but grayed-out upgrade prompt.
- The Free plan is a market-news dashboard only with no screener access, no alerts, and no portfolio analysis tools. All three paid tiers share a 14-day full-feature free trial with no credit card required.
- Best fit for fundamentals-driven investors and dividend-focused portfolio builders. Weakest for day traders (no real-time data on lower tiers, no mobile app, charting is an afterthought) and options traders (no options chain or strategy modeling).
Track What Your Screener Actually Finds
Financial Tech Wiz Trading Journal
Stock Rover gets you the setup. The journal tells you whether your screener picks are actually paying off, broken down by symbol, hold duration, and win rate. Connect 25+ brokers for automatic trade import.
Start a Free TrialStock Rover Plans and Pricing in 2026
Stock Rover sells four plan tiers. The Free plan is permanent (no trial expiration) but limited to a news and dashboard experience. The three paid tiers (Essentials, Premium, Premium Plus) all share a 14-day full-feature free trial that does not require a credit card. Stock Rover also discounts significantly on annual and two-year billing, with the two-year rate on Premium Plus working out to roughly $20/month, a 29% discount versus monthly billing.
| Plan | Monthly | Annual | Two-Year | Screener Metrics |
|---|---|---|---|---|
| Free | $0 | $0 | $0 | None (dashboard only) |
| Essentials | $7.99 | $79.99 | $139.99 | 275+ |
| Premium | $17.99 | $179.99 | $319.99 | 375+ |
| Premium Plus | $27.99 | $279.99 | $479.99 | 700+ |
Research Reports are sold as a separate add-on: $49.99/year if you already pay for a Stock Rover subscription, $99.99/year as a standalone purchase. All pricing above is in USD and reflects the 2026 rate structure. Stock Rover has historically increased prices once every few years, so the two-year billing option locks in the current rate for a meaningful planning horizon.
Stock Rover Free Plan
The Free plan is a market-news and watchlist dashboard, not a screener. You get price charts, aggregated news, market-cap performance tracking by sector, and access to basic financial data on individual stocks and funds. The screener, portfolio analysis tools, dividend forecasting, alerts, Monte Carlo simulator, and correlation tools are all locked. The Free tier also serves display ads throughout the interface.
The Free plan is useful if you only want a tidy place to track a watchlist and read aggregated financial news. It is not a substitute for the paid plans on any meaningful screening or portfolio analysis use case. Treat it as a preview of the interface, not a functional research tool.
Stock Rover Essentials ($7.99/month)
Essentials opens the screener with 275+ metrics, five years of historical data, and basic charting. This is the right starting tier for fundamental investors who want to filter on standard metrics such as P/E ratio, EPS growth rate, dividend yield, debt-to-equity, and market cap, but do not need correlation analysis or Monte Carlo simulation.
The catch: the remaining ~425 metrics show up in the screener interface but appear grayed out with a small lock icon. They are visible as an upgrade prompt, which feels intrusive during workflow but does let you map the full feature set and decide whether the next tier is worth the price before committing. At $7.99/month, Essentials is the most competitively priced entry point in the fundamental screening category; the nearest comparable (Finviz Elite) starts at $39.50/month.
Stock Rover Premium ($17.99/month)
Premium adds 100 more screener metrics (total 375+), extends historical data to 10 years, and unlocks the platform’s most differentiating analytical tools: correlation analysis, dividend income forecasts, rebalancing suggestions, and Monte Carlo simulations for portfolio risk modeling.
Correlation analysis is the standout Premium feature. Feed in your holdings and Stock Rover scores each pair of positions on price-movement correlation, flagging stocks that are essentially moving together and inflating your concentration risk in ways that sector labels alone would miss. Two companies in different sectors with similar sensitivity to interest-rate moves will show up as correlated here, which pure sector-based rebalancing tools would miss entirely.
Monte Carlo simulation runs thousands of probabilistic forward paths on your current portfolio, producing a range of realistic best- and worst-case outcomes based on historical return distributions. This is a feature that typically lives behind institutional research platforms or expensive standalone financial planning tools. At $17.99/month on Premium, it is the clearest example of Stock Rover punching above its price tier.
Premium is the most-recommended tier for the typical buy-and-hold investor managing 10 to 30 positions who wants both screening capability and portfolio-level risk analysis without stepping up to Premium Plus pricing.
Stock Rover Premium Plus ($27.99/month)
Premium Plus unlocks all 700+ screener metrics, analyst-driven filters (number of analysts rating Strong Buy, consensus target price, EPS revision trends over 30 and 90 days), and the equation screener. The equation screener is the most distinctive feature at this tier: you type a target outcome in plain language, such as “1 month return versus industry,” and Stock Rover suggests screening parameters designed to surface names matching that criteria.
The analyst-rating filters matter most for investors who weight institutional consensus in their stock selection process. Being able to screen for names where EPS estimates have been revised upward across three or more analysts over the past 30 days, layered on top of fundamental filters, is a meaningful capability that the lower tiers do not offer.
Premium Plus pays off for investors who run multiple thesis-driven screens per week and need the full metric library and analyst-rating filters. It is overkill for casual fundamental investors who screen once a month on a handful of standard ratios.
Stock Rover Core Features
The Screener
Stock Rover’s screener is the headline product. With 700+ metrics on Premium Plus, you can stack filters across fundamentals (revenue growth rate, gross margin, return on equity, net margin, free cash flow yield), valuation (P/E, P/B, EV/EBITDA, price-to-sales), technicals (price relative to 200-day moving average, RSI, beta, 52-week performance), dividend metrics (yield, payout ratio, 5-year dividend growth rate), and analyst data (consensus rating, target price upside percentage, EPS estimate revisions).
The interface is dense by design. Every metric includes an in-tool definition with example target ranges, which helps newer investors who are not already fluent in a given fundamental ratio. The output goes into a customizable table where you can sort by any column, color-code cells by threshold, and export results to CSV. You can save screener configurations and come back to them, which makes it practical to maintain several recurring screens (a value screen, a dividend growth screen, a quality-growth screen) without rebuilding filter stacks from scratch each week.
The weak point is navigation. Moving from the screener output table back into the filter configuration is not intuitive. The interface does not auto-restore your filter stack if you navigate away, which means you can lose your setup partway through a session and have to retrace steps. This is a UX friction issue that has been present for several years and is the most common complaint from experienced Stock Rover users.
Portfolio Analysis Tools
Portfolio analysis is the second pillar of Stock Rover and one of its strongest differentiators against pure screening platforms. Connect your broker account (Stock Rover supports 1,000+ brokers via direct sync, including Schwab, Fidelity, Robinhood, Interactive Brokers, E-TRADE, TradeStation, tastytrade, and Wealthsimple), and Stock Rover pulls your live holdings into a full analysis suite.
Analysis tools available on Premium and Premium Plus include: correlation matrix across all holdings, dividend income forecasting for the next 12 months based on current positions and declared dividend rates, future projected income modeling, sector and industry exposure breakdown with peer comparison, rebalancing simulator (targets a user-defined allocation and shows which trades restore it), and Monte Carlo simulation for downside risk modeling across multiple time horizons.
The dividend income forecaster is particularly useful for investors building toward a retirement income portfolio. It projects forward 12 months based on your current positions and declared dividend schedules, then lets you model how adding or removing a position affects total projected annual income. No comparable tool at this price point does this as cleanly.
Investor Warnings
Investor Warnings is a Stock Rover feature competitors do not replicate well. Pull up any stock on the platform and it surfaces a set of algorithmic flags based on the financial statements: goodwill running high relative to assets (possible overpayment on acquisitions), debt-to-EBITDA outside of the stock’s historical range, declining gross margin over multiple quarters, share buybacks occurring at elevated valuations, or a widening gap between reported earnings and free cash flow.
The warnings are explanatory rather than just labels. You see why the specific metric is flagged, how it compares to the stock’s own historical range (not just a static threshold), and a plain-language explanation of how the condition could affect future earnings or capital allocation. For investors who are not trained fundamental analysts, Investor Warnings acts as a first-pass quality check that surfaces the kinds of concerns a research analyst would flag in a written note. It does not replace diligence, but it consistently surfaces issues that casual financial statement reviews miss.
Watchlists, Alerts, and Charting
Watchlists are available across all paid tiers. You can organize names into multiple lists and view the screener output filtered to a specific list, which makes it practical to maintain a tracked universe and a screened universe side by side. Alerts can fire via email or text when a holding or watchlist name hits a price target, a volume threshold, a dividend yield change, or an analyst rating shift. Alert customization is meaningful at the Premium and Premium Plus tier; Essentials limits the number of active alerts.
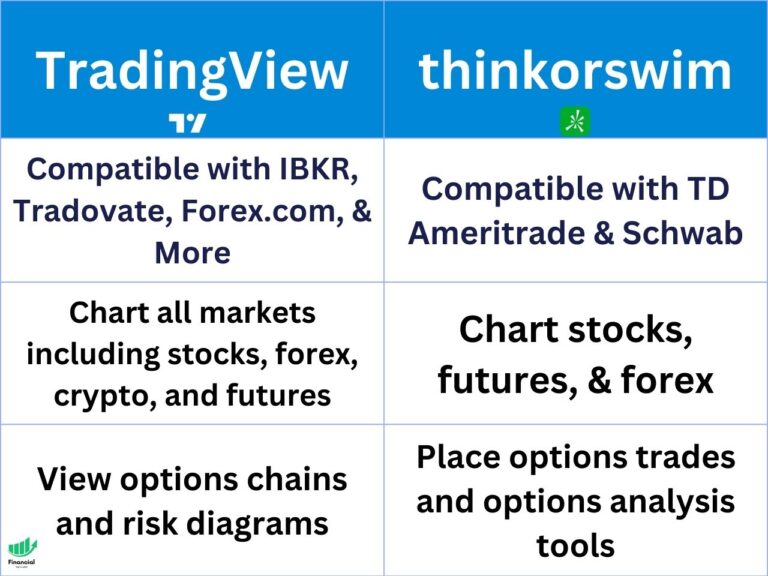
Charting is the weakest feature in the Stock Rover suite. The Free tier strips charting down to basic price lines. Even on Premium Plus, the charting tool is clearly secondary to the screener and portfolio analysis capabilities. Drawing tools are minimal, indicator support is limited compared to dedicated charting platforms, and the overall experience feels like a feature added to complete the product rather than built for serious technical traders. If chart-based technical analysis drives your decisions, pair Stock Rover with TradingView for charting; the two tools are complementary and serve different parts of the research workflow.
Research Reports
Stock Rover Research Reports are a separate add-on covering thousands of individual stocks. With an active Stock Rover subscription, they cost $49.99/year; without a subscription, $99.99/year standalone. The reports include fundamental analysis, earnings trend commentary, valuation context, and forward estimates in a format similar to a sell-side research summary. Compared with Morningstar Investor at $249/year for a roughly equivalent individual-stock research product, Stock Rover Research Reports are priced aggressively for investors who want narrative research alongside the screener data.
Who Stock Rover Is Best For
Stock Rover earns its price for fundamentals-driven equity investors who want professional-grade screening and portfolio analysis without paying enterprise prices. The platform was designed specifically for self-directed long-term investors and shows in every feature priority decision. The specific user profiles that get the most value:
- Dividend-focused investors building income portfolios who use the dividend forecaster and Monte Carlo simulation to model income stability and downside risk over a 5- to 10-year horizon.
- Long-term buy-and-hold investors with diversified holdings who use correlation analysis to surface hidden concentration risk that sector labels alone would miss.
- Value investors running fundamental screens across hundreds of stocks who need 700+ metrics and analyst-rating filters to narrow a large universe to a short thesis list.
- Self-directed investors managing portfolios across multiple brokers who want a single dashboard for performance, correlation, rebalancing, and dividend tracking without paying a financial advisor.
Stock Rover is a poor fit for day traders (no real-time data on the lower two tiers, no mobile app, charting is too thin for technical setups), options traders (no options chain, no strategy modeling, no P&L visualization for multi-leg positions), and beginner investors who are not yet comfortable with fundamental ratio interpretation (the dense interface and 700+ metrics are genuinely overwhelming until you have spent several weeks building familiarity with the tool).
Stock Rover vs the Alternatives
| Platform | Best For | Monthly Floor | Screener Strength | Portfolio Analysis |
|---|---|---|---|---|
| Stock Rover | Fundamentals investors | $7.99 (Essentials) | 700+ metrics on Premium Plus | Best in class for the price |
| Finviz | Fast SERP-style screens | $39.50 (Elite) | 70+ metrics | Light, watchlist only |
| TradingView | Charting plus screening | $14.95 (Essential) | 150+ metrics, real-time | None native |
| Trade Ideas | Active day traders | $89 (Standard) | Real-time alert-driven | None native |
| Seeking Alpha Premium | Analyst-led research | $239/yr | 100+ metrics | Light |
| Yahoo Finance | Casual investors (free) | $0 | Basic | Watchlist only |
Stock Rover vs Finviz
Finviz is the most-asked comparison in the stock screener category. The honest take: Finviz wins on speed and visual polish; Stock Rover wins on depth. Finviz Elite at $39.50/month is roughly five times Stock Rover Essentials and delivers a significantly faster heatmap-style screening experience with a polished, dense output layout that experienced traders navigate quickly. Stock Rover Essentials at $7.99/month buys you 275 fundamental metrics versus Finviz Elite’s roughly 70, plus five years of historical data and basic portfolio tracking that Finviz does not provide.
The decision usually comes down to workflow: if you screen on dozens of fundamental ratios and care about multi-year financial history, Stock Rover. If you screen on a handful of technical and earnings filters and want a fast, polished SERP-style output with built-in heatmaps and news integration, Finviz. For a full head-to-head on the charting and screening tradeoffs, see the TradingView vs Finviz comparison, which covers similar positioning questions from the charting-first angle.
Stock Rover vs Trade Ideas
Trade Ideas and Stock Rover solve fundamentally different problems. Trade Ideas is built for active day traders and starts at $89/month (Standard) or $167/month (Premium). It gives you real-time alert-driven scanning, a proprietary AI trade idea engine that surfaces intraday momentum setups, and a backtesting environment built around short-hold trading. Stock Rover gives you deep fundamental screening with a 5- to 10-year historical window, Monte Carlo portfolio simulation, and dividend income forecasting built around weeks-to-months hold periods.
If you are scanning for momentum breakouts or volume spike alerts intraday, Trade Ideas. If you are building a position list of fundamentally sound companies to hold through earnings cycles, Stock Rover. The two platforms rarely compete for the same use case. See the full Trade Ideas review for a detailed walkthrough of the active-trading features.
Stock Rover vs Stock Analysis
Stock Analysis is the free-tier comparison most fundamental investors should make before paying for any screener. Stock Analysis covers the same basic ratios and screening surface without a paywall, including revenue growth, earnings per share, debt levels, and valuation multiples. For investors who screen infrequently on standard metrics and do not need portfolio-level analysis, Stock Analysis is a legitimate free alternative to Stock Rover Essentials.
Where Stock Analysis falls short: it lacks Stock Rover’s Investor Warnings, Monte Carlo simulation, dividend income forecasting, correlation analysis, and the 700-metric screener depth. The Stock Analysis review covers exactly what the free tier includes and where it hits its ceiling, which is useful context before deciding whether the screener depth of Stock Rover Essentials is worth $7.99/month for your use case.
Workflow: From Screener Output to Trading Journal
The piece most Stock Rover reviews skip is what happens after the screen. You build a Premium screener filtering for 5-year EPS growth above 15%, debt-to-EBITDA below 2.5, and dividend yield between 2% and 4%. The screen returns 18 names. You dig into each one, evaluate the Investor Warnings, check the correlation against your existing holdings, and decide on 4. You place the trades through your broker.
Then what? Most fundamental investors leave Stock Rover at the screening stage and never close the loop on whether their screening criteria are actually delivering results. The trade you took because the screener flagged it: did it work? Did your dividend-yield-plus-growth screen outperform your debt-coverage screen? Did the Investor-Warning-free names outperform the ones with flagged goodwill? Without a trading journal that logs the screener-source, hold duration, exit reason, and outcome for every position, you are guessing at what is working.
The Financial Tech Wiz Trading Journal connects directly to 25+ brokers and pulls every fill automatically. Tag your trades with the screener strategy that surfaced them (“dividend value screen,” “EPS-growth premium screen,” “low-debt quality screen”), and after a few months the analytics tab shows you win rate and P&L broken down by symbol and hold duration. That lets you compare which screening approaches are actually producing results versus which ones look good on paper but underperform in your actual portfolio. If you want a simpler starting point before subscribing, the free trading journal template is a Google Sheets version with the same tagging structure.
Not Ready for a Paid Journal Yet?
Free Google Sheets Trading Journal Template
Track every screener-sourced trade with the same tag and outcome structure the paid app uses. No signup hoops, just download.
Get the Free TemplateFAQ
Is Stock Rover data real-time?
Stock Rover does not provide real-time data on the Free or Essentials tiers, where quotes are delayed 15 minutes. Premium and Premium Plus include real-time data for US-listed equities. If your strategy depends on real-time pricing for execution decisions, plan for Premium or higher. For the fundamental screening and portfolio analysis use cases Stock Rover is designed for, the 15-minute delay on Essentials is generally not a meaningful constraint.
Is there a Stock Rover mobile app?
No. Stock Rover is a web-only platform. The website is responsive and technically loads on a mobile browser, but the screener interface, data tables, and portfolio analysis tools are designed for desktop screens and are genuinely awkward to use on a phone. If you need mobile access to charting and screening tools, TradingView’s mobile app is a better fit for that part of the workflow.
Is Stock Rover good for day trading?
No. Stock Rover is built for fundamental investors and swing-to-position traders with multi-week to multi-month hold periods. The lack of real-time data on lower tiers, the absence of a mobile app, the thin charting tool, and the focus on multi-year financial metrics all point away from intraday use cases. For day trading screens, Trade Ideas, Finviz Elite, or your broker’s native scanner are better-suited tools.
How much does Stock Rover cost in 2026?
Stock Rover Essentials is $7.99/month or $79.99/year, Premium is $17.99/month or $179.99/year, and Premium Plus is $27.99/month or $279.99/year. Two-year prepay drops the effective monthly cost roughly 29% versus month-to-month billing. A Free plan with limited dashboard-only access is permanently available, and all three paid plans include a 14-day free trial with no credit card required.
Does Stock Rover connect to my broker?
Stock Rover supports direct sync with 1,000+ brokers, including Charles Schwab, Fidelity, Interactive Brokers, E-TRADE, Robinhood, TradeStation, tastytrade, J.P. Morgan Self-Directed, Merrill Edge, Public.com, Ally Invest, eToro, and Wealthsimple. Once connected, Stock Rover pulls your live holdings and gives you portfolio-level analysis (correlation, dividend forecasting, rebalancing simulation) on top of the screener data.
Get Your Free Trading Resources
Grab the free trading journal template plus the same tools we use to stay organized, consistent, and objective.
- Free trading journal template
- Custom indicators, watchlists, and scanners
- Access our free trading community
Enter your email below to get instant access.
No spam. Unsubscribe anytime.