
Financial Tech Wiz Custom Trading Tools
These tools are built to make systematic breakout research and trade management more structured. The suite now includes the original Daily Pivot Breakout Strategy Indicator on TrendSpider and TradingView, plus Daily Pivot Breakout Pro on TrendSpider. It also includes a Daily Pivot Breakout Scanner, a Bullish Ichimoku Crossover Scanner, and the free Ichimoku Extension indicator. Enter your email below to receive the current toolkit, including these indicators and scanners, for free.
Get Your Free Trading Resources
Grab the free trading journal template plus the same tools we use to stay organized, consistent, and objective.
- Free trading journal template
- Custom indicators, watchlists, and scanners
- Access our free trading community
Enter your email below to get instant access.
No spam. Unsubscribe anytime.
Key Takeaways
- The original Daily Pivot Breakout Strategy Indicator uses confirmed daily pivot highs, momentum filters, volume confirmation, and separate Day-0 and next-session signals.
- Daily Pivot Breakout Pro is a TrendSpider indicator with separate entry and exit pivots, a structural pivot-low trail, a hard percentage trail, gap cancellation, and dedicated exit signals.
- Enter your email below to get the current free indicator and scanner toolkit, then use a trading journal to review which conditions are producing your best results.
Daily Pivot Breakout Strategy Indicator
Overview
The Daily Pivot Breakout Strategy Indicator identifies confirmed breakouts above daily pivot highs, then checks trend momentum and volume conditions before a signal qualifies. It is available on TrendSpider and TradingView. The core calculations are daily, while the chart display and signal timing depend on the platform and timeframe you are using.
- Available on: TrendSpider and TradingView
- Best for: Swing traders and systematic breakout traders
- Pivot strength: 5 bars on the left and 5 bars on the right by default, with configurable settings
- Pivot lookback: 100 daily bars by default, with a configurable lookback
- Momentum filters: 100-day ROC at a 30% minimum OR a 100-period EMA slope using a 100-day lookback at a 20% minimum
- Volume filter: Daily RVOL greater than 1.0 compared with the preceding 20 daily bars by default
- Trailing stop: Adjustable percentage trail set to 20% by default
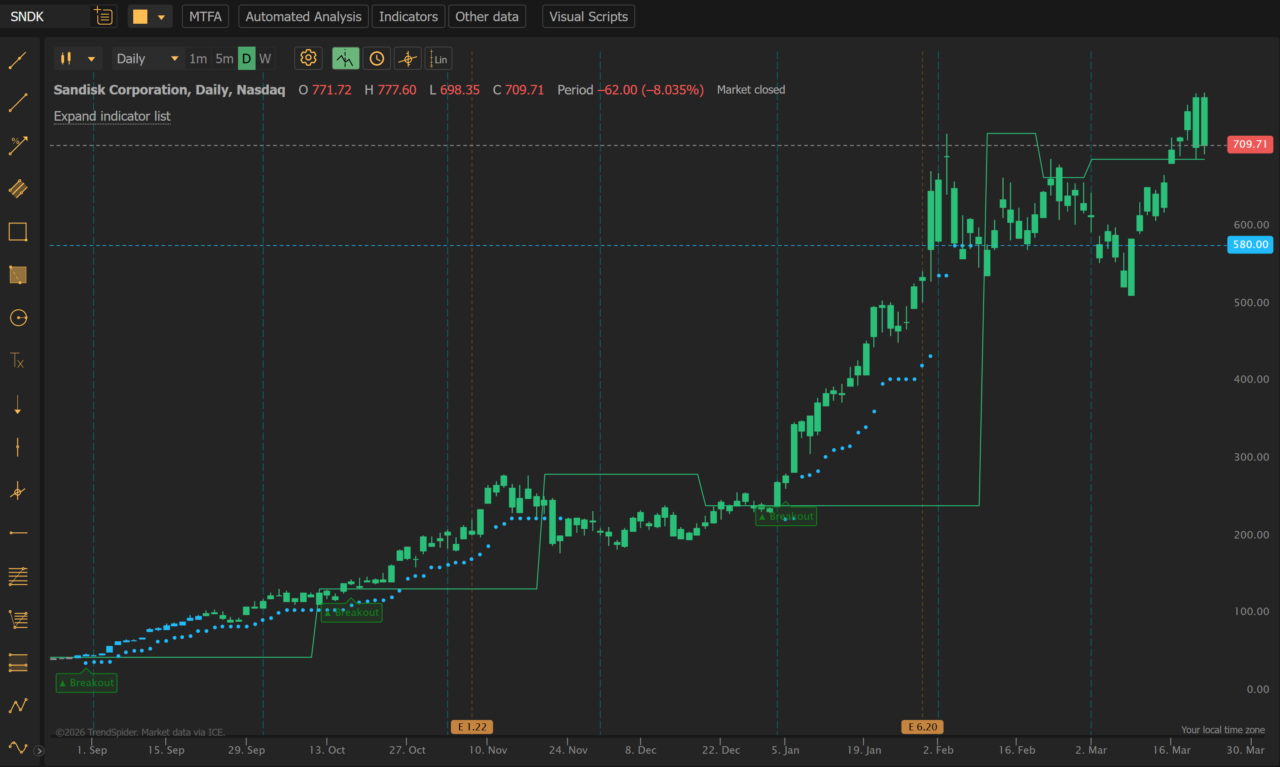
Daily Pivot Breakout Strategy Indicator on TrendSpider
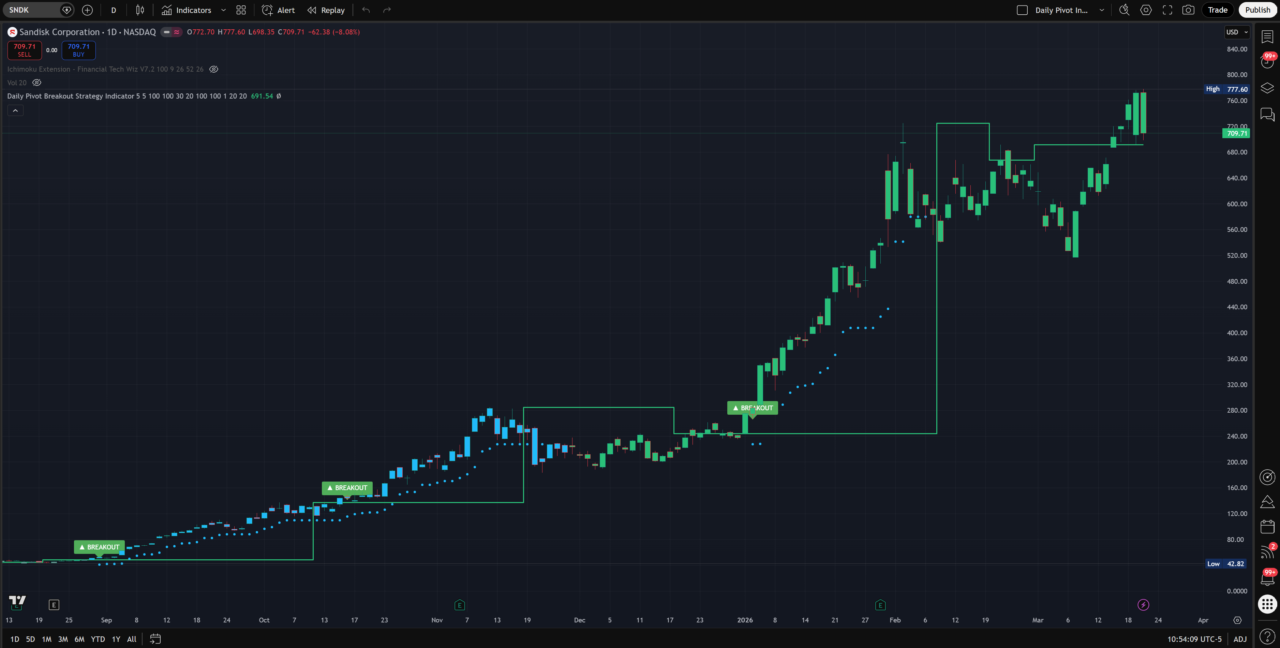
Daily Pivot Breakout Strategy Indicator on TradingView
How It Works
The indicator detects a strict daily pivot high using the configured left and right strength. With the default 5/5 setting, a pivot becomes usable only after five bars to its right have closed. A breakout occurs when the daily close moves from at or below the confirmed pivot high to above it. Only one qualifying breakout signal fires for each pivot, and the signal rule resets when a new pivot high is confirmed.
The pivot must also fall within the configured Pivot Lookback, which defaults to 100 daily bars. The momentum filters use OR logic, so either the ROC condition or the EMA slope condition can qualify the breakout. Volume confirmation is also required. On TrendSpider, the daily RVOL threshold is configurable and defaults to greater than 1.0 versus the average of the preceding 20 daily bars. Setting that threshold to 0 disables the TrendSpider RVOL filter. TradingView uses the same 20-day RVOL greater-than-1 concept, but the current Pine version does not expose RVOL as a user input.
TrendSpider and TradingView Timing
The two platforms share the confirmed daily pivot and breakout concept, but their chart behavior differs.
- TrendSpider: The indicator engine calculates on daily data and maps the results to the active chart timeframe. On intraday charts, the following-session signal is gated to the first chart bar of the new day.
- TradingView: The current Pine implementation performs the daily calculations through
request.security()and displays Day-0 breakout information plus next-session entry markers across chart timeframes.
Because pivots need right-side confirmation, a pivot is not available at the moment its high first prints. Signal timing also differs between a Day-0 scan after the daily close and a following-session entry signal, so the same setup can appear at different chart bars depending on the platform and timeframe.
Momentum Filters and Candle Coloring
The original indicator uses a 100-day Rate of Change (ROC) and a 100-period EMA slope calculated over a 100-day lookback. The default minimums are 30% for ROC and 20% for EMA slope. Either filter can qualify a breakout when the other conditions pass. When both are positive, the setup has stronger momentum confirmation, but both do not need to pass.
Candle colors show the combined state of the two momentum filters:
- Green: Both ROC and EMA slope are bullish
- Cyan: One is bullish and the other is neutral
- Gray: Both are neutral
- Orange: One is bearish and the other is neutral
- Red: Both are bearish
- Purple: The filters conflict, with one bullish and one bearish
The candle-color display can be enabled or disabled in the indicator settings. The colors are a visual read of the combined ROC and EMA state, not a separate entry rule.
Built-in Trailing Stop and Alerts
The original indicator includes an adjustable percentage trailing stop set to 20% by default. It is a trade-management reference that can be plotted on the chart and used as an alert condition. The platform implementations should not be described as identical: TrendSpider’s current version uses completed daily data, while the TradingView implementation manages the trailing stop with chart-bar data after entry.
An alert on the trailing stop provides a notification or signal. The indicator does not contain SignalStack or another automation service. If you want automated execution, configure an external automation tool separately and confirm that its alert and order settings match your own process.
Signal Types
5PivotBreakout_Scan: The Day-0 breakout signal. Use it after the breakout-day close to review candidates and build a watchlist.5PivotBreakout_Strategy: The following-session entry signal. It is gated to the first chart bar of the new day on TrendSpider intraday charts and is displayed as a next-session entry marker in the TradingView implementation.
Key Features
- Confirmed daily pivot highs with configurable left and right strength
- Configurable Pivot Lookback, set to 100 daily bars by default
- 100-day ROC and 100-period EMA slope filters using OR logic
- Daily RVOL confirmation, with platform-specific input behavior
- Six-color momentum display for the combined filter state
- Adjustable percentage trailing stop set to 20% by default
- Day-0 scanning and following-session entry signals
As you collect breakout trades, log the setup, filter state, entry, exit, and outcome in a free trading journal template. A consistent record helps you see whether momentum confirmation and volume are improving your results over a larger sample.
Daily Pivot Breakout Pro
Daily Pivot Breakout Pro is currently a TrendSpider indicator. It keeps the original confirmed daily pivot breakout concept, then adds a more complete trade-management and exit framework. Pro is not the same TradingView script as the original indicator, so the current Pro section should be understood as TrendSpider-specific.
Entry Pivots and Filters
Pro uses separate Entry Left Strength and Entry Right Strength settings, both set to 5 by default. Its Entry Pivot Lookback defaults to 100 daily bars. The entry filters are intentionally stricter than the original defaults:
- ROC: 100-day ROC with a 40% minimum
- EMA slope: A 100-period EMA slope with a 100-day lookback and a 25% minimum
- RVOL: 20-day RVOL greater than 1.0
ROC and EMA slope still use OR logic. Either momentum filter can qualify the entry when the other entry conditions pass. The defaults are stricter than the original indicator: Pro uses a 40% ROC minimum instead of 30% and a 25% EMA slope minimum instead of 20%.
Trade Management and Exit Framework
Pro uses separate exit pivot settings, with Exit Left Strength and Exit Right Strength set to 6 by default. A confirmed daily pivot low creates a structural exit level. If a confirmed pivot low below the breakout close exists, it can become the initial structural stop.
The hard percentage trail defaults to 20% and is based on the entry open and the highest daily price since entry. Pro also maintains a Pivot Low Trail. The effective Active Exit Stop is the higher of the Hard Percent Trail and the Pivot Low Trail.
Pro exits require a daily close below the applicable stop. An intraday touch alone does not trigger an exit. Before entry, if the next session opens at or below the initial pivot stop, the entry is canceled and a gap-cancel signal fires. This keeps a gap through the initial structural risk level from becoming a new position.
Pro tracks one internal position. It does not add to or replace an active position. Breakout signals can still be displayed while a position is active, but Pro does not take an additional entry until the existing position is no longer active.
Plots and Visual Controls
The Pro chart can plot the Pivot High, Confirmed Pivot Low Guide, Active Exit Stop, Hard Percent Trail, and Pivot Low Trail. It also includes breakout labels, gap-cancel labels, and exit labels so you can distinguish setup, entry protection, and trade-management events.
Visual controls include Show Latest Pivot Low, Show Hard Trail Dots, Show Pivot Stop Dots, and Enable Candle Colors. These controls change what is displayed on the chart, while the position and stop rules remain part of the Pro logic.
Pro Signal Names
DPBPro_Breakout: Breakout eventDPBPro_EntryScan: Entry-candidate scan eventDPBPro_Entry: Pro entry eventDPBPro_GapCancel: Entry canceled because the next session opened at or below the initial pivot stopDPBPro_Exit: Pro exit eventDPBPro_HardStop: Hard percentage trail exit eventDPBPro_PivotExit: Pivot-low structural exit event
What’s Different From the Original?
The original indicator has one percentage trailing stop plus breakout and following-session entry signals. Daily Pivot Breakout Pro adds a fuller position-management framework:
- Separate entry-pivot and exit-pivot settings
- A confirmed pivot-low structural trail
- A hard percentage trail plus an effective Active Exit Stop line
- Gap protection before entry
- Dedicated exit signals and labels
- Internal position-state tracking
- Stricter default momentum thresholds
How to Use the Tools in a Daily Workflow
Original Indicator Workflow
- After the daily close, review
5PivotBreakout_Scanfor Day-0 breakout candidates. - Check the confirmed pivot, momentum state, RVOL condition, and chart context before adding a setup to your watchlist.
- Use
5PivotBreakout_Strategyas the following-session entry signal. On intraday TrendSpider charts, that signal is gated to the first chart bar of the new day. - After entry, monitor the original percentage trailing stop and set an alert if you want a notification. Any automated execution requires a separately configured external tool.
Pro Workflow
- Use the Pro breakout and entry-scan signals after the daily pivot and entry filters have confirmed a candidate.
- Before entering, review the initial structural stop created by a confirmed pivot low when one exists.
- Use
DPBPro_Entryfor the Pro entry event. If the next session opens at or below the initial pivot stop, treatDPBPro_GapCancelas an entry cancellation, not a new trade. - Once active, follow the Active Exit Stop and the dedicated Pro exit signals. A daily close below the applicable stop is required; an intraday touch alone is not an exit.
- Do not add to or replace an active Pro position. A new breakout can remain visible for context, but the internal position state prevents a second entry while the first position is active.
Daily Pivot Breakout Scanner
The Daily Pivot Breakout Scanner is a separate screening tool for finding confirmed daily breakout candidates. Use it to build an after-close watchlist, then review the relevant indicator signals and risk levels before making a decision. The scanner is a screening aid, not an automatic trading system.
Premium Discord Alerts
If you prefer not to run the scan yourself, the premium Discord community provides a separate alert workflow. Qualifying scanner setups are posted after the daily close, giving you a short list to review before the next session. Premium access also includes exclusive Discord setups and the Financial Tech Wiz Trading Journal.
The Whop premium plan is currently $19/month or $9.91/month billed annually. It is separate from the free email signup: enter your email below to receive the current indicator and scanner toolkit, while the premium plan adds the community and journal benefits described above.
Bullish Ichimoku Crossover Scanner
Overview
The Bullish Ichimoku Crossover Scanner identifies when short-term momentum turns positive within the Ichimoku Cloud framework. It can help swing traders look for trend alignment before entering and can be combined with pivot breakouts for additional confluence.
Use Cases
- Spot new uptrends or continuation setups after a pullback
- Combine Ichimoku alignment with pivot-breakout confirmation
- Build a repeatable watchlist instead of relying on chart-by-chart guesswork
Ichimoku Extension Indicator
The Ichimoku Extension by Financial Tech Wiz is a free custom indicator that builds on the classic Ichimoku system. It adds automated long and short signals, extended support and resistance levels, and a linear regression overlay to give you a cleaner read on trend direction.
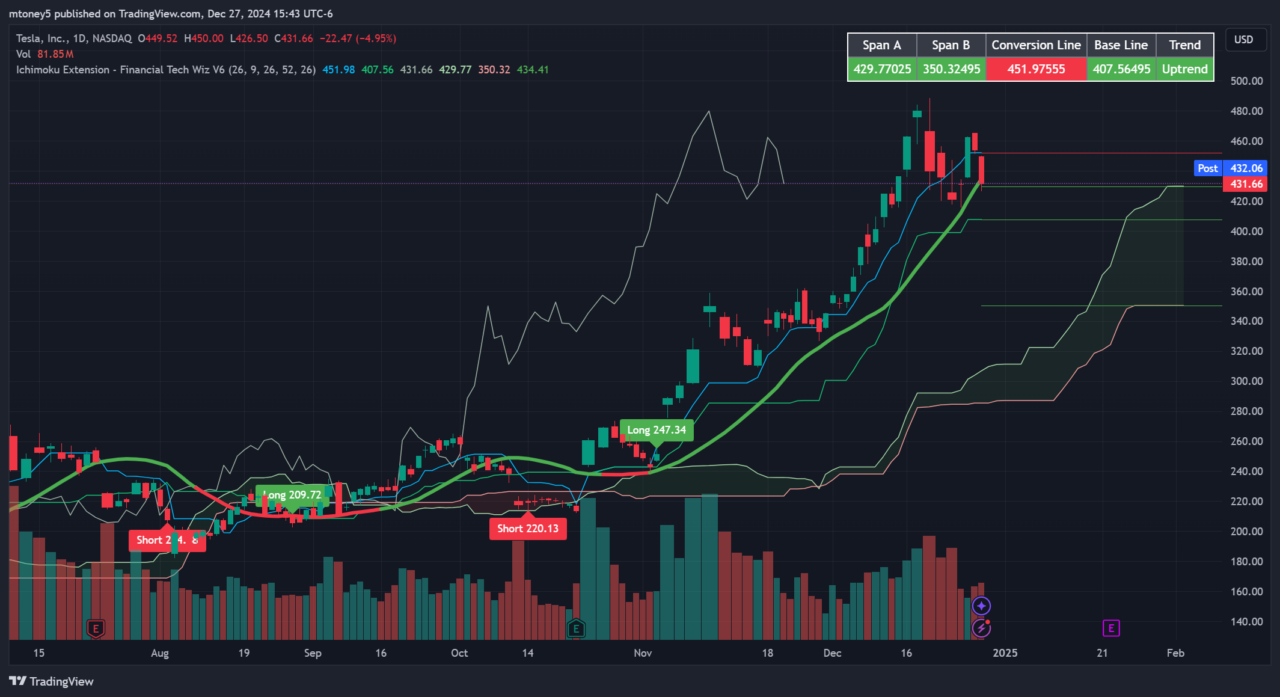
Automated Long and Short Signals
The indicator detects Tenkan-Kijun (TK) crossovers and plots long and short signals directly on the chart, giving you clear entry and exit reference points without requiring you to interpret each crossover manually.
Extended Support and Resistance Levels
It plots extended support and resistance levels on the chart and displays the price values in the top-right corner for quick reference.
Trend Identification with Linear Regression
A linear regression line analyzes overall trend direction based on the slope of the Ichimoku cloud. The regression period is customizable for different markets and timeframes.
Customizable Settings
You can adjust the regression period, hide the full cloud when you want a cleaner chart, and toggle the long and short labels on or off. See the full Ichimoku Extension indicator page for the detailed setup.
Every indicator and scanner on this page sits alongside the rest of the toolkit in the Financial Tech Wiz resources library. If you are comparing other chart tools, the best TradingView indicators guide covers additional community-built options by strategy.
How to Access the Free Tools
Enter your email below to receive the current Financial Tech Wiz custom trading tools, including the original Daily Pivot Breakout Strategy Indicator, Daily Pivot Breakout Pro, the Daily Pivot Breakout Scanner, and the Ichimoku tools. Always test an indicator in your own process before relying on it with live capital.
Recommended Tool
Financial Tech Wiz Trading Journal
Track trades, review performance analytics, use AI insights, compare your equity curve with benchmarks, and monitor drawdown across your trading history. Starting at $9.91/month billed annually.
Try It FreeFrequently Asked Questions
What is the difference between the original Daily Pivot Breakout indicator and Pro?
The original indicator is available on TrendSpider and TradingView and focuses on confirmed daily pivot-high breakouts, momentum and volume filters, a percentage trailing stop, and Day-0 or following-session signals. Daily Pivot Breakout Pro is currently a TrendSpider indicator that adds separate entry and exit pivots, a confirmed pivot-low structural trail, a hard percentage trail, an effective Active Exit Stop, gap cancellation before entry, internal position tracking, and dedicated exit signals.
When does the original Daily Pivot Breakout signal become valid?
A pivot high becomes usable only after its configured right-side confirmation bars have closed. With the default 5/5 setting, that means five bars must close to the right of the candidate pivot. A breakout then requires the daily close to move from at or below the confirmed pivot high to above it, along with the required momentum and volume conditions.
What is the difference between Day-0 scanning and a next-session entry?
5PivotBreakout_Scan is the Day-0 breakout signal, used after the breakout-day close to review candidates. 5PivotBreakout_Strategy is the following-session entry signal. The two stages are related, but they are not the same event, and their chart-bar placement depends on the platform and timeframe.
How does Pro handle a gap before entry?
If Pro has a confirmed pivot low below the breakout close, that level can become the initial structural stop. If the next session opens at or below that stop, Pro cancels the entry and fires DPBPro_GapCancel. The gap-cancel event prevents the strategy from opening a position after price has already violated the initial structural risk level.
How does Pro decide when to exit?
Pro compares the hard percentage trail with the Pivot Low Trail and uses the higher level as the Active Exit Stop. An exit requires a daily close below the applicable stop. An intraday touch alone does not trigger the exit, and the dedicated DPBPro_Exit, DPBPro_HardStop, and DPBPro_PivotExit signals identify the exit path.
What do I receive after entering my email?
The free email access is the distribution point for the current custom trading tools, including the original Daily Pivot Breakout Strategy Indicator, Daily Pivot Breakout Pro, the Daily Pivot Breakout Scanner, and the Ichimoku tools. Premium Discord alerts, exclusive setups, and the Financial Tech Wiz Trading Journal are part of the separate premium offer described above.
For educational purposes only. Not financial advice. Always test thoroughly before live trading.