
StockAnalysis.com Review (2026): Is It Worth $79/Year?

If you research stocks for a living or just want clean fundamentals without paying institutional prices, you have probably bumped into StockAnalysis.com. It is one of the fastest research platforms on the open web, the Pro plan is $79 a year (cheaper than most of its peers by a factor of three or four), and the free tier is genuinely usable. In this review I walk through what the platform actually does, what the paid tiers unlock, where the data comes from, how it stacks up against Yahoo Finance, Seeking Alpha, Stock Rover, and Finviz, and who should (and should not) subscribe.
Key Takeaways
- StockAnalysis.com Pro at $79 per year is one of the lowest-priced fundamental-research subscriptions in 2026, with up to 40 years of financial statement history, a 299-filter stock screener, and a 60-day money-back guarantee.
- The data layer is enterprise-grade: S&P Global Market Intelligence for fundamentals, Cboe Global Markets for real-time prices, Benzinga for analyst ratings, Finnhub for forecasts. Most exports come from Nasdaq Data Link, which can produce slight on-screen versus downloaded number differences.
- Best fit: self-directed fundamental and dividend investors who want fast data and a powerful screener. Not a fit for traders who need technical analysis depth, broker integration, API access, or research recommendations.
StockAnalysis.com tells you what to research. The Financial Tech Wiz Trading Journal tells you whether your picks are actually working. SnapTrade imports from 25+ brokers, equity curve, win rate by symbol, AI insights, $19 per month or $9.91 per month billed annually.
Try the Journal Free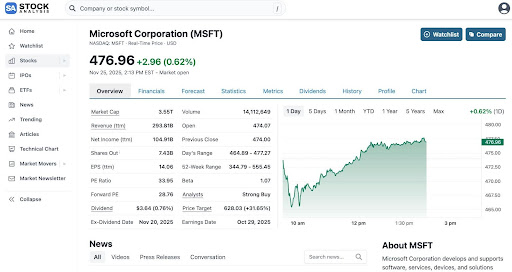
What Is StockAnalysis.com?
StockAnalysis.com is a web-based stock research platform built around fast access to financial statements, valuation ratios, and a screener that goes deep enough for serious fundamental work. It was launched in 2019 by Kris Gunnars, a pen name for Kristjan Mar Gunnarsson, and is owned and operated by Vefir ehf., an Icelandic company. The team page is unusually transparent for a finance site: named editors, clear ownership, and a public mission statement that draws a hard line at investment advice. StockAnalysis.com explicitly does not pick stocks, does not run a newsletter recommending positions, and points users back to SEC filings as the source of record.
Coverage is wide: 130,000+ stocks and funds globally, including every S&P 500 constituent, with deep U.S. coverage and lighter international coverage. The interface is intentionally minimal. There are no pop-ups, no auto-play video, no AI-generated commentary trying to summarize the chart for you, and the page loads are noticeably faster than Yahoo Finance, Seeking Alpha, or Morningstar in side-by-side use. That speed compounds: if you are flipping through 20 to 40 tickers in a research session, shaving a second off every page load is a real workflow upgrade.
The typical user is a long-term investor, a value or dividend investor, a swing trader who uses earnings and valuation data, or someone who has outgrown Yahoo Finance and Google Finance but does not want to pay Bloomberg-style prices. If your process starts with an income statement, a valuation ratio, or a screener filter, the platform is built for you. If your process starts with a chart pattern, it is not.
Who StockAnalysis.com Is Best For
I divide the StockAnalysis.com fit by how someone actually uses the platform in a research session.
- DIY fundamental investors: anyone who reads financial statements before buying. The Pro tier unlocks 10 to 40 years of historical financials, which is genuinely rare outside institutional terminals.
- Screener-first investors: the 299-filter screener (real-time, refreshes every minute during market hours) is the main reason most paid users upgrade. Saved screens require Pro, which turns one-off filters into a repeatable weekly workflow.
- Dividend investors: dividend history goes back up to 50 years on paid plans, plus payout ratio, yield-on-cost, and growth metrics in the screener.
- ETF researchers: full holdings on 4,600+ U.S. ETFs, an ETF-specific screener, and a side-by-side fund comparison tool. The free tier gives a usable sample.
- Cost-conscious self-directed investors: Pro at $79 per year undercuts Seeking Alpha Premium ($299), Morningstar Premium ($249), and Finviz Elite ($299) by roughly 70 to 75 percent.
- Mobile-first users: the iOS app is 4.9 stars on 2,500+ ratings, the Android app is 4.8 on 2,700+. Both mirror the desktop experience.
Who it is not for: technical traders who live in charts (TradingView, TrendSpider, or Trade Ideas are stronger picks), anyone who wants stock picks or analyst write-ups (Seeking Alpha or Motley Fool), developers who need an API (no programmatic access), and traders who want broker integration to sync positions automatically.
Core Features of StockAnalysis.com
Stock and ETF Dashboards
Every ticker opens to a clean overview: real-time price (during market hours, including pre-market and after-hours for U.S. exchanges), the headline valuation metrics, analyst price targets, peer comparison, and quick links to the deeper financials, statistics, and dividend pages. Free users get the dashboard. Pro users get more historical context (longer-period charts, extended ratios, restricted statistical fields).
Financial Statements and Valuation Tools
The Financials tab is where the platform earns most of its serious fans. Income statement, balance sheet, and cash flow are presented in both quarterly and annual views. Free users see roughly 5 years of S&P-sourced history. Pro users see 10 years from S&P directly, and a data-source selector lets users extend that to 40+ years on established companies. The toggle between absolute values and per-share metrics is a one-click switch, which makes cross-company comparison genuinely fast.
Stock Screener (299 Filters)
The screener is the most powerful free-tier feature on the site. You filter on P/E, EV/EBITDA, free cash flow yield, dividend payout ratio, revenue growth, return on equity, debt-to-equity, and roughly 290 other fundamentals, dividend, valuation, technical, and classification fields. Filters update in real time as you adjust them; the underlying data refreshes once a minute during market hours. Saved screens are a Pro feature, and that one feature alone is the upgrade trigger for most subscribers. Pro also unlocks 200+ column indicators in the results table (up to 1,000 rows) and CSV/Excel export. The screener is faster than Finviz Elite at a quarter the price. If you want technical setup scoring layered on top of the fundamentals, our ChartMill stock screener review covers a rating-driven alternative.
Watchlists That Double as a Portfolio Tracker
Watchlists are not just a ticker list. Each watchlist accepts share counts and cost-basis entries, which turns it into a simple read-only portfolio (no broker linking required). Multiple watchlists, custom column views per watchlist, real-time price toggle, CSV export. Pro caps watchlists at 100 stocks; Unlimited removes the cap. The use case is “I want a portfolio view without giving a tool my broker login”, which is increasingly rare in a SnapTrade-and-Plaid world.
ETF Research and Holdings Data
4,600+ U.S.-listed ETFs with full holdings, expense ratio, AUM, sector exposure, and yield filters. The ETF screener is structurally identical to the stock screener. The full-holdings view (not just top 10) is the key Pro unlock here, useful for checking overlap between funds during portfolio construction.
Mobile App Experience
iOS app (4.9 stars, 2,500+ ratings), Android app (4.8 stars, 2,700+). Mirrors the desktop site: charts with 100+ studies, watchlists, screener, real-time and after-hours quotes. iOS in-app pricing is higher than web pricing ($9.99/month or $79.99/year for Pro, $29.99/month or $199/year for Unlimited), so subscribe via web if you can.
Free Daily Morning Newsletter
A short, no-commentary daily market summary sent before the open. Coverage is broad-market and earnings-calendar driven, not opinion. Free to anyone, no signup wall. A reasonable add-on for investors who want a fast pre-market read without committing to a paid market-news subscription.
Pricing and Plans
StockAnalysis.com runs three tiers. The free tier is meaningfully usable on its own, which is rare in this category.
| Plan | Price | Who It Is For | Key Unlocks |
|---|---|---|---|
| Free | $0 | Casual research, validating the workflow | Screener access, basic financial statements (~5 years), watchlists, market movers, IPO calendar, daily newsletter. Ad-supported. |
| Pro | $79/year ($6.58/mo) or $9.99/month | Active self-directed investors | 10 to 40 years of financial history, 10 to 50 years of dividend history, 50,000+ stocks with business KPIs, saved screeners, 200+ table indicators, 1 export/day, 100 stocks per watchlist, full ETF holdings, no ads, dark mode. |
| Unlimited | $199/year ($16.58/mo) | Spreadsheet modelers, daily exporters | Everything in Pro, plus unlimited exports and unlimited watchlist size. |
Both paid plans include a 60-day money-back guarantee, which is substantially more generous than the 7 to 30 day windows typical of competing finance tools. Pro is the right tier for almost everyone. Unlimited makes sense only if you build spreadsheet models daily and need multiple exports per day, or you run watchlists over 100 tickers.
If you decide to upgrade, use our StockAnalysis.com discount link to go straight to the Pro signup page.
Where the Data Comes From
Any honest review of a fundamentals platform needs to answer where the numbers come from. StockAnalysis.com documents this more transparently than most.
| Data Type | Provider | Update Speed |
|---|---|---|
| Financial statements and fundamentals | S&P Global Market Intelligence (default since July 2024) | Within 1 to 3 hours of an earnings release |
| Download and export data | Nasdaq Data Link, Financial Modeling Prep | Varies |
| Real-time stock prices | Cboe Global Markets | Real-time during U.S. market hours |
| Delayed consensus pricing | Nasdaq, NYSE | 15-minute delay |
| Analyst ratings and price targets | Benzinga | Updated regularly |
| Revenue and EPS forecasts | Finnhub (Wall Street analysts) | Updated regularly |
One nuance worth flagging: S&P Global does not allow its data to be downloaded directly, so CSV, Excel, and Google Sheets exports come from a secondary provider (mostly Nasdaq Data Link). That means exported figures can occasionally differ slightly from what is on screen, especially for less-traded names. For most use cases the difference is minor; if you build models that depend on exact reconciliation between your spreadsheet and the live page, spot-check the key fields before relying on the export.
StockAnalysis.com vs Alternatives
Where StockAnalysis.com fits depends on what you are already using.
| Platform | Strength | Weakness | Annual Cost |
|---|---|---|---|
| StockAnalysis.com Pro | Fast UI, deep financial history, 299-filter screener | No editorial research, no API, limited technical analysis | $79 |
| Yahoo Finance Premium | Brand recognition, broad coverage | Cluttered UI, shallower financial history, slower | $250 |
| Seeking Alpha Premium | Quant ratings, crowdsourced research articles | Higher cost, billing complaints, variable article quality | $299 |
| Finviz Elite | Iconic screener, heatmap | Less depth on company-level financials | $299 |
| Morningstar Premium | Proprietary Moat and Fair Value ratings, ETF research | Less screener power, slower UI | $249 |
| Stock Rover (Premium Plus) | Portfolio analytics, deep attribution | Steep learning curve, dated UI | $279 |
| TradingView | Charting, technical analysis, alerts | Not a fundamentals-first tool, screener thinner on fundamentals | $179 to $719 (Plus to Ultimate) |
Quick reads:
- vs Yahoo Finance: StockAnalysis.com wins on speed, financial-history depth, and ad density. Yahoo wins on brand recognition only.
- vs Seeking Alpha: complementary, not competing. Seeking Alpha is the editorial layer; StockAnalysis.com is the data layer. Many investors use both.
- vs Finviz Elite: StockAnalysis.com matches the screener and adds deep company-level financials. Finviz still has the better heatmap.
- vs Morningstar Premium: Morningstar is stronger on fund analysis and proprietary qualitative ratings. StockAnalysis.com is stronger on screening, raw data depth, and price.
- vs Stock Rover: Stock Rover has deeper portfolio analytics and attribution; StockAnalysis.com is faster, cheaper, and easier to learn. Stock Rover is for someone who wants institutional-style analytics; StockAnalysis.com is for someone who wants institutional-style data without the learning curve.
- vs TradingView: different product entirely. TradingView is the chart and technical analysis tool; StockAnalysis.com is the fundamentals research tool. Most active investors run both.
Pros and Cons
Pros:
- $79/year Pro is one of the lowest prices in serious fundamental research.
- 60-day money-back guarantee removes most of the trial risk.
- Speed: consistently faster than Yahoo Finance, Seeking Alpha, and Morningstar.
- Data depth: up to 40 years of financials and 50 years of dividends on paid plans.
- 299-filter screener with saved screens (Pro) and CSV export.
- Mobile apps that mirror the desktop experience (4.9 iOS, 4.8 Android).
- Transparent data-source documentation.
- Free daily newsletter, no paywall.
Cons (the honest ones):
- Data, not interpretation. No analyst notes, no AI summaries, no stock picks. If you want someone to tell you what to buy, this is not the tool.
- Downloaded data can show slight differences from the on-screen view because of the S&P license restriction.
- No API. Quant users and developers will need a separate data provider.
- No broker integration. There is no way to sync your real trades or positions into StockAnalysis.com.
- Limited technical analysis. Charts have 100+ studies but TradingView and TrendSpider go further if charts are your primary workflow.
- International data is thinner than U.S. coverage.
After You Pick the Stocks, Track Them
The blind spot in any research workflow is whether your research is actually producing returns. StockAnalysis.com helps you pick stocks; it does nothing to tell you whether your picks beat the S&P 500, whether your win rate on consumer staples is better than your win rate on biotech, or whether you tend to overtrade after a losing week. That is what a trading journal is for.
If you have not started journaling yet, the free Google Sheets trading journal template is a fast on-ramp: copy the sheet, log each entry and exit, get win-rate and average-P/L breakdowns. It is free, no signup beyond an email opt-in if you want updates.
If you trade actively (5+ tickers a week, multiple accounts, options or futures), the paid Financial Tech Wiz Trading Journal auto-imports from 25+ brokers via SnapTrade, runs AI insight checks on your patterns, and benchmarks your equity curve against the S&P 500. Pricing is $19 per month or $9.91 per month billed annually.
Get Your Free Trading Resources
Grab the free trading journal template plus the same tools we use to stay organized, consistent, and objective.
- Free trading journal template
- Custom indicators, watchlists, and scanners
- Access our free trading community
Enter your email below to get instant access.
No spam. Unsubscribe anytime.
StockAnalysis.com Review: Final Thoughts
StockAnalysis.com has quietly become one of the best fundamental research platforms on the open web. The combination of speed, data depth, a serious screener, and a $79-per-year Pro price makes it an easy recommendation for any self-directed investor whose process starts with the income statement instead of the chart. The free tier is genuinely usable, the 60-day money-back guarantee removes almost all of the trial risk, and the data documentation is more transparent than most peers.
It is not the right tool for technical traders, quant developers who need an API, or anyone who wants a stock-picking newsletter. Use it as the data and screening layer in a broader stack: pair it with a charting tool for entry timing and a trading journal for performance tracking, and you have a research workflow that costs less than $300 a year all in.
If you decide to upgrade, the cleanest path is through our StockAnalysis.com discount link, which sends you straight to the StockAnalysis.com Pro signup page.
FAQ
Is StockAnalysis.com reliable?
Yes. The platform sources fundamental data from S&P Global Market Intelligence (the same provider used by institutional terminals), real-time prices from Cboe Global Markets, analyst ratings from Benzinga, and forecasts from Finnhub. The data updates within 1 to 3 hours of an earnings release. The team publishes named editors, an Iceland-registered parent company (Vefir ehf.), and a transparent data-sources page that explains every provider and known limitation.
Is StockAnalysis.com free?
The free tier is real and meaningfully usable: stock screener access, basic financial statements (around 5 years of S&P-sourced history), watchlists, market movers, IPO calendar, and the daily newsletter, with no signup wall for most pages. The free tier is ad-supported. Pro at $79 per year unlocks deeper history, saved screeners, exports, and removes ads.
How much does StockAnalysis.com Pro cost?
Pro is $79 per year (which works out to $6.58 per month) when billed annually, or $9.99 per month on the monthly plan. Unlimited is $199 per year ($16.58 per month). Both paid plans include a 60-day money-back guarantee. Pricing is higher in the iOS app due to Apple in-app fees, so subscribe via the web if you can.
What is the difference between StockAnalysis.com Pro and Unlimited?
Pro and Unlimited share every feature except two: exports and watchlist size. Pro allows one data export per day and watchlists up to 100 stocks. Unlimited removes both caps. For most self-directed investors, Pro is the right tier. Unlimited is built for users who export to spreadsheets daily or run watchlists with more than 100 tickers.
Is StockAnalysis.com better than Yahoo Finance?
For fundamental research, yes. StockAnalysis.com loads faster, runs a more powerful screener (299 filters versus Yahoo’s basic offering), shows more financial history (up to 40 years on Pro versus roughly 5 on Yahoo), and serves fewer ads. The free tier alone is a clear upgrade over Yahoo Finance for anyone who reads financial statements. Yahoo Finance still wins on brand recognition and on social-style features like community message boards.
Does StockAnalysis.com have a mobile app?
Yes. The iOS app is rated 4.9 stars across 2,500+ ratings and the Android app is 4.8 stars across 2,700+ ratings. The app mirrors the desktop experience: full charts with 100+ studies, the screener, watchlists, and real-time and after-hours quotes. Note that in-app subscription pricing is higher than web pricing because of Apple’s commission, so subscribe via the web for the lowest price.
Get Your Free Trading Resources
Grab the free trading journal template plus the same tools we use to stay organized, consistent, and objective.
- Free trading journal template
- Custom indicators, watchlists, and scanners
- Access our free trading community
Enter your email below to get instant access.
No spam. Unsubscribe anytime.







