TrendSpider Review (2026): Charting, AI, and Scanning in One Workspace
TrendSpider is an all-in-one market research and trading platform that combines real-time charting, AI-assisted pattern recognition, automated technical analysis, market scanning, backtesting, cloud-based alerts, AI tools, and alternative market data in one workspace. Over several years of trading I have used nearly every charting platform on the market, and TrendSpider is one of the few that consolidates that much surface area into a single subscription. Here is what is actually inside, what it costs in 2026, who it fits, and where the limits are.
Key Takeaways
- TrendSpider combines real-time charting, scanning, backtesting, cloud-based alerts, AI tools, and alternative data into one workspace, so it competes with TradingView plus Trade Ideas plus a backtesting tool plus a data terminal at the same time.
- The Strategy Tester, Strategy Bots, AI Strategy Lab, and AI Coding Assistant turn ideas into tested logic and forward-running alerts, which is the most under-discussed reason traders stick with the platform after the trial.
- Pricing covers five tiers (Standard, Premium, Enhanced, Advanced, Business) with usage limits varying by plan; FTW readers can save 25 percent at checkout with code FTW25 on any plan.

Key Features of TrendSpider
- Real-time data included
- Track stocks, ETFs, crypto, and forex
- 16 charts per layout
- Automated trendlines, Fibonacci, chart pattern recognition, and candlestick pattern recognition
- Five plan tiers (Standard, Premium, Enhanced, Advanced, Business); see TrendSpider’s pricing page for current rates
- AI tools that help with chart adjustments, indicator setup, scan creation, and market research using natural language
You can get 25% off using my discounted link and coupon code: FTW25!
Get 25% Off TrendSpider Now!See whether your TrendSpider-flagged trades actually pay out
The Financial Tech Wiz Trading Journal pulls trades automatically from 25+ brokers via SnapTrade, then breaks down win rate and P&L by symbol and hold duration. Built for TrendSpider users who want to know which setups are working.
Start tracking tradesTrendSpider Pros and Cons
Pros
✓ Automated technical analysis tools draw trendlines, Fibonacci levels, candlestick patterns, and chart patterns without manual setup, which is what most users credit for the time savings versus doing that work by hand
✓ Set up advanced screens with simple text prompts
✓ Seasonality trends help you spot which months a stock performs well
✓ Track all markets, including stocks, ETFs, futures, crypto, and forex
✓ Use up to 16 charts per layout, which is much higher than any competitor I have used
Cons
✗ The web-based platform can feel clunky at times, while TradingView runs a bit smoother
✗ A bit pricy when compared to competitors
Review of TrendSpider’s Charting & Indicators
When it comes to charting on TrendSpider, it provides everything a trader would want, including over 200 indicators to choose from and the ability to have up to 16 charts on one layout. TrendSpider offers a plethora of drawing tools, plus the automated features will draw trendlines for you.
The platform even has its own proprietary chart type called TrendSpider Raindrop Charts, which is essentially like a volume profile built into a candle. Another feature I like about TrendSpider is the ability to set anchor points. For example, you can set the anchor point at the lowest point on the chart so your volume by price and anchored VWAP only show you the most relevant volume data.
The only downside I have noticed about TrendSpider is the platform can feel a bit laggy at times, but it is not bad enough to be a huge burden. However, it is something to note if your computer isn’t the fastest.
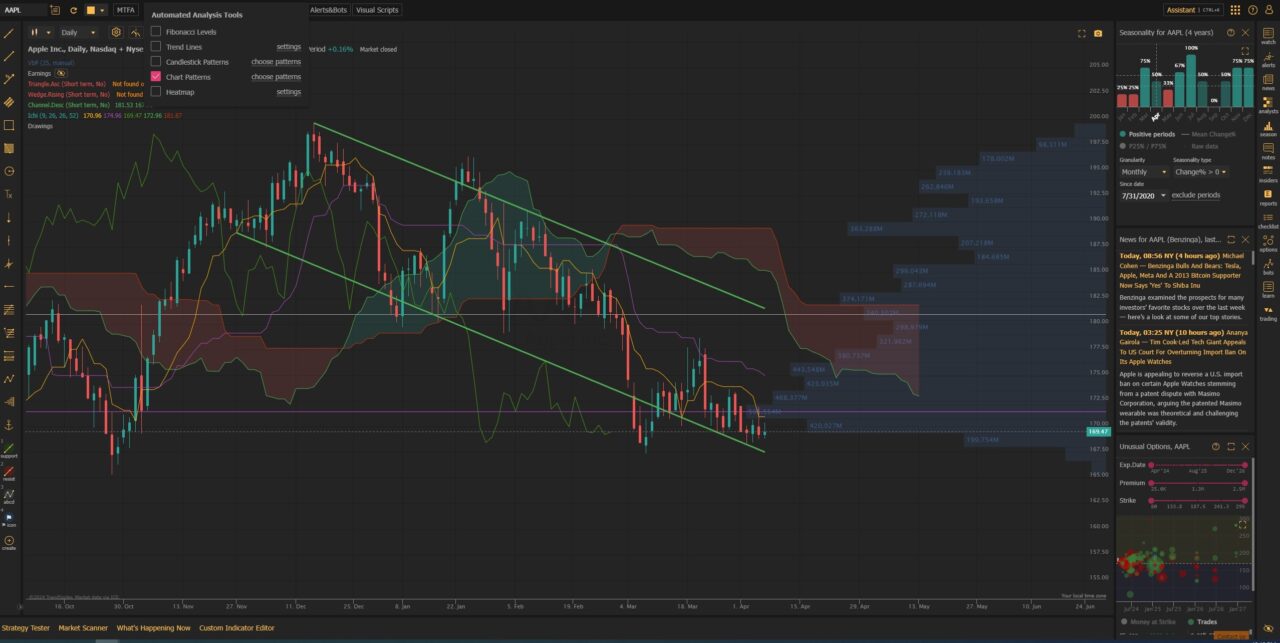
TrendSpider’s Automated Technical Analysis Features
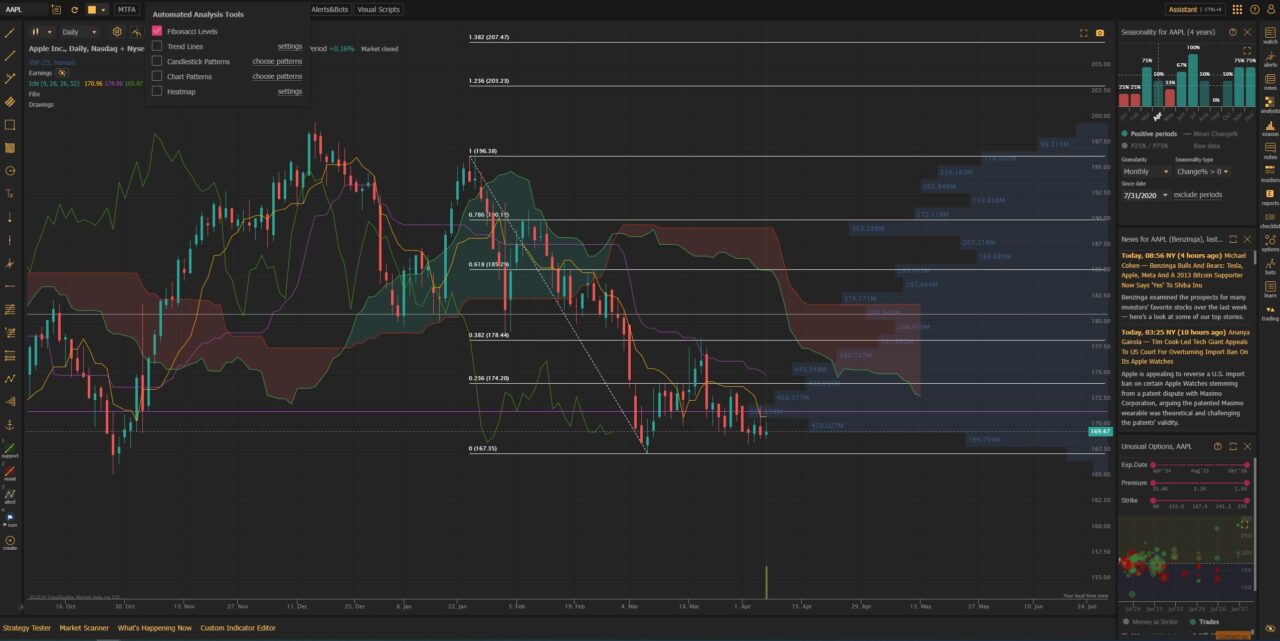
One of the best features of TrendSpider is the automated technical analysis tools. TrendSpider’s automated analysis layer draws trendlines, marks candlestick patterns, plots Fibonacci levels, and applies multi-timeframe analysis without manual setup, which is what most users credit for the time savings versus drawing those signals by hand. Here are all of the automated tools that TrendSpider offers:
- Fibonacci levels – automatically draws Fibonacci retracements on your chart. My experience using this tool was hit or miss. Sometimes it worked perfectly, but sometimes I would prefer it to have drawn the retracements in different spots.
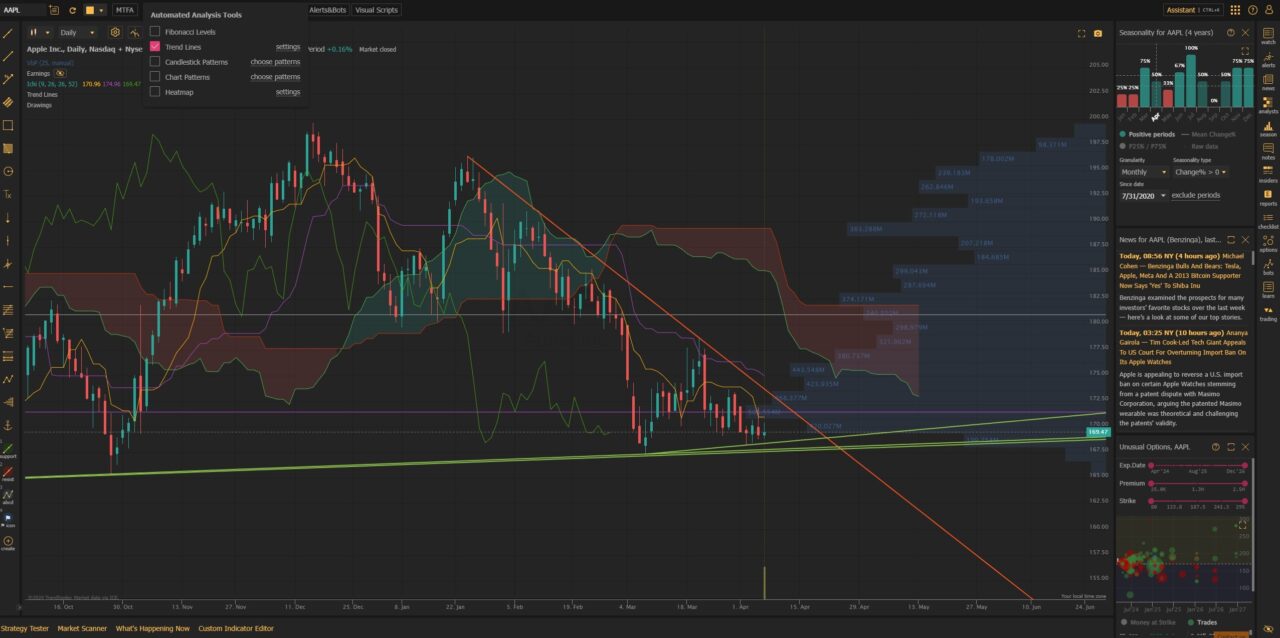
- Trend lines – automatically draws several trend lines on your chart so you never miss key trends. The auto trend lines features is awesome, and it definitely catches lines that the human eye could easily miss.
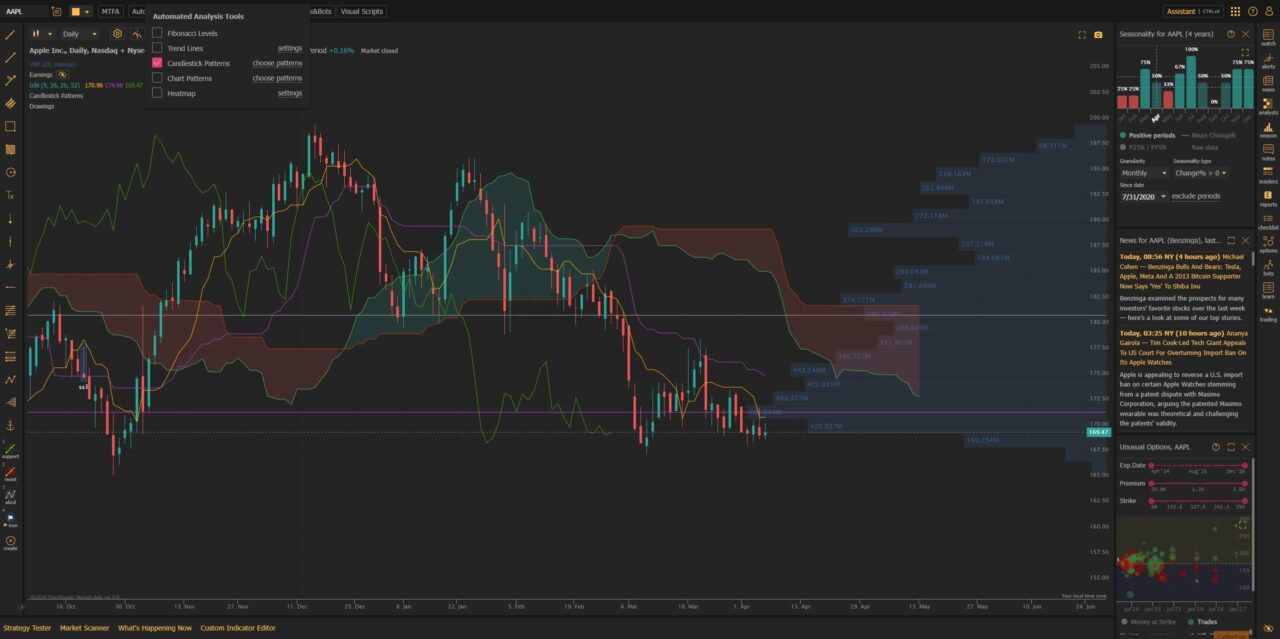
- Candlestick patterns – automatically detects candlestick patterns such as Doji and hammer candles. The auto candlestick pattern recognition is hit or miss in my experience, but it doesn’t hurt to turn it on.
- Chart patterns – automatically detect triangles, head and shoulders, channels, and more. The auto chart patterns tool works well most of the time in my experience using it.
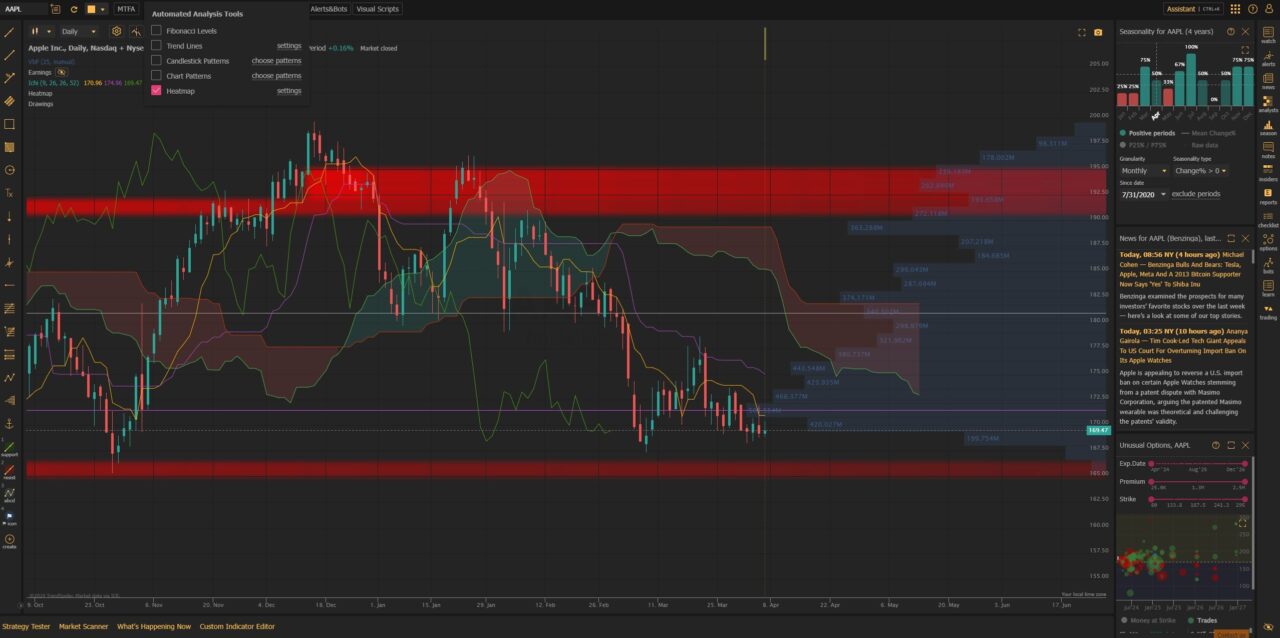
- Heatmap – detects areas of support and resistance based on historical levels. The heatmap tool is a great extension to volume by price and helps highlight key levels.
Benefits of Automation in Technical Analysis
- Time Savings: Automated tools can analyze hundreds of charts in seconds, freeing up traders to focus on strategy and execution.
- Reduced Subjectivity: Algorithmic analysis helps minimize human bias in pattern recognition.
- Comprehensive Scanning: TrendSpider can continuously monitor multiple timeframes and instruments simultaneously.
- Educational Value: For newer traders, these tools can help reinforce technical analysis concepts and improve pattern recognition skills.
While automated analysis tools offer powerful capabilities, it’s important to remember they should complement, not replace, a trader’s own analysis and decision-making process. The most effective approach often combines the efficiency of automation with the nuanced judgment of experienced human traders.
Using TrendSpider’s Scanner
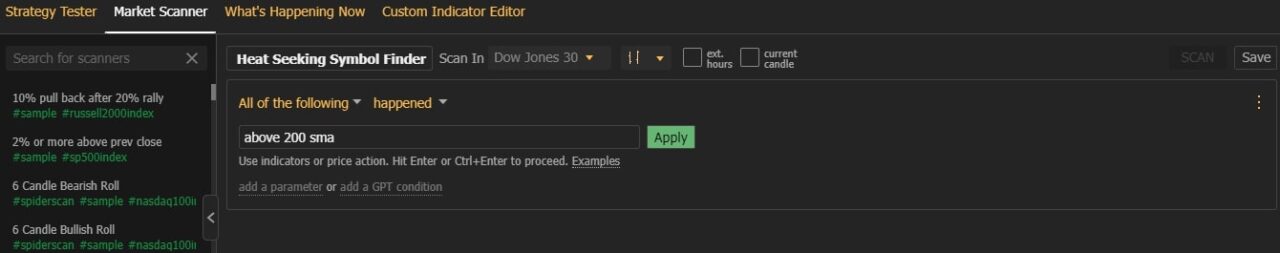
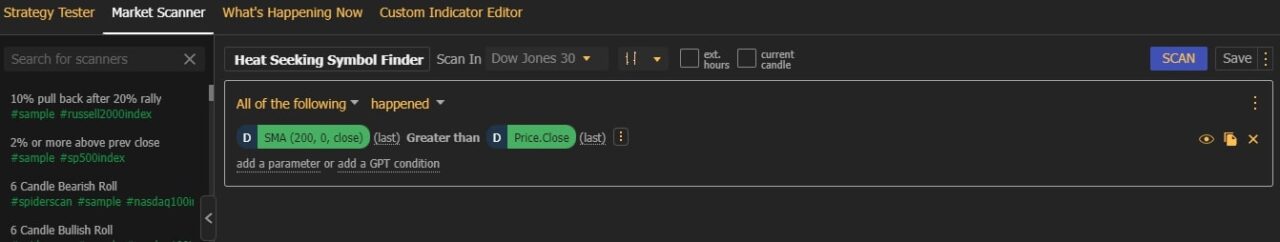
Another great feature of TrendSpider is the scanner it offers, which can be prompted with a GPT condition or from a list of parameters. If you prompt the GPT parameters correctly, scanning for your exact parameters takes much less time.
For example, instead of manually adding a parameter to scan for stocks above the 200 SMA, you can simply type “above 200 SMA,” and it will add the parameter for you. In my experience, it actually works better than I expected, and I highly recommend you try it if you are looking for an easy scanner.
TrendSpider Indicators
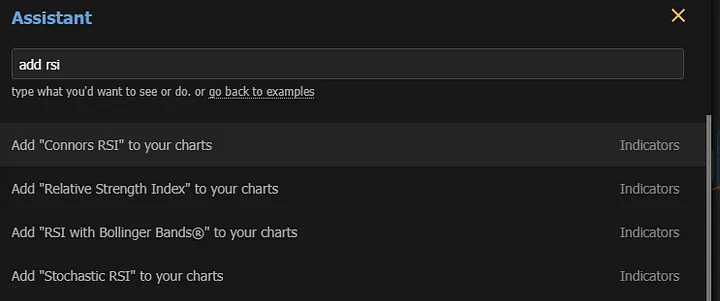
TrendSpider allows you to use tons of indicators from basic ones like the RSI and moving average lines to the volume by price. You can add indicators to TrendSpider by clicking the indicators button at the top of any chart. From here you can search for any indicators you like. Alternatively, you can click the assistant button at the top right of the chart to add indicators by simply typing in a command like “add Ichimoku indicator.”
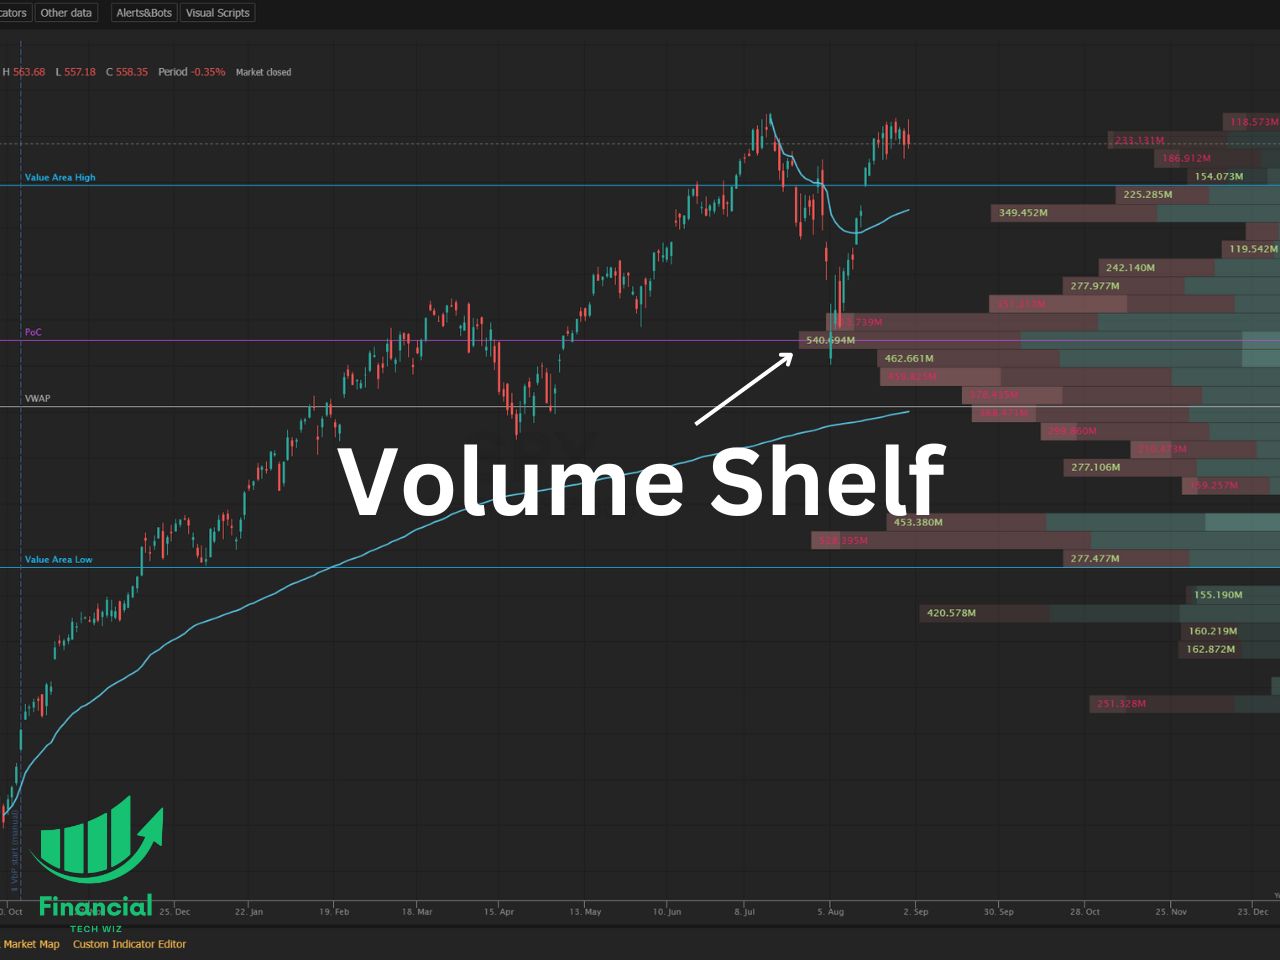
TrendSpider Volume by Price
The volume by price indicator, also known as the volume profile indicator on other platforms, allows you to see volume horizontally instead of vertically. This allows you to determine areas of supply and demand with ease.
Volume shelves, also known as high volume nodes, are price levels where a lot of volume has been traded. This indicates it is a significant area of support or resistance, since many traders are either long or short at that price level. You can spot a volume shelf on the chart by adding volume by price to your chart and finding the price levels with the longest horizontal bars.
TrendSpider’s Sidekick AI
Sidekick AI is TrendSpider’s built-in AI market analyst and trading assistant. It lives in the top right corner of the platform and can see your charts, pull real-time market data, analyze fundamentals, dig into SEC filings and earnings transcripts, and research insider and government transactions. Unlike general-purpose AI tools, Sidekick is built specifically for active investors.
What Sidekick Can Do
Sidekick operates as an agentic assistant with four main modes:
- Scanning Agent: Describe a stock screen in plain English and Sidekick builds, executes, and refines the scanner for you. You can even ask it to find charts that visually match a specific pattern or setup.
- Indicator Coding Agent: Build, edit, and refine custom indicators collaboratively. You describe the logic and Sidekick writes the code.
- Market Analysis Agent: Deep-dive analysis on a symbol or a full watchlist, combining charts, backtests, fundamentals, and alternative data into a single consolidated research output.
- Grunt Work Agent: Create alerts across entire watch lists, compare balance sheets, review earnings call transcripts, track insider and government trades, and handle other high-volume research tasks that would otherwise eat up your session time.
One important limitation: Sidekick does not add or remove indicators directly on your chart. Chart configuration is still handled through the standard TrendSpider interface. Sidekick can help you design or code a new indicator, but placing it on the chart requires a manual step.
Sidekick Personalities
Sidekick ships with six distinct personalities. You choose the one that fits how you think about markets:
- Warren: Long-term value focus. Obsessed with fundamentals and benchmarks, modeled after Warren Buffett’s investment philosophy.
- Neutral Analyst: Unbiased and direct. Designed to tell you the truth even when you don’t want to hear it, modeled after a financial advisor.
- Graham: Systematic and data-driven. Goes deep into numbers and finds meaning in large datasets, modeled after Benjamin Graham.
- Karen: The skeptic. Bold and unafraid to call out bad assumptions or gaps in your thesis.
- Simon: The quant. Short responses, heavy on tables and numbers, zero narrative drift.
- Wall Street Dominator: Modeled after the Wall Street Bets community. Direct, does its diligence, and comfortable with high-conviction positions.
Sidekick Pricing
Sidekick pricing is separate from your TrendSpider platform subscription. Every TrendSpider user gets 25 free Sidekick messages per month. Paid tiers increase the message limit and unlock additional AI models:
| Plan | Messages / Month | Models Available | Price |
|---|---|---|---|
| Free | 25 | Claude 3.7, Claude 4 | $0/month |
| Basic | 100 | Claude 3.7, Claude 4, Gemini 2.5, Gemini 3 Pro | $49/month |
| Plus | 300 | All above + ChatGPT-4.1, ChatGPT-5 | $129/month |
| Max | 1,000 | All models | $349/month |
Strategy Tester and Strategy Bots
The Strategy Tester is one of the most under-discussed features on TrendSpider, and it is the reason many rules-based traders stay on the platform long after their trial. The Strategy Tester lets you define entry and exit conditions using technical criteria, then runs those conditions against historical price bars to generate a full equity-curve output: win rate, average gain, average loss, maximum drawdown, and a trade-by-trade log. You are not just checking whether a pattern appeared in the past; you are generating a structured record of how that pattern would have performed as a forward-tested strategy.
Strategy Bots take the tested logic one step further. Once you have a strategy you believe in, a Strategy Bot deploys that logic forward as position-aware alerts. The bot knows whether you are already in a position, which means it can fire an entry alert on a new signal and a separate exit alert when the exit condition triggers, without repeating the entry on every subsequent bar. You can also route Strategy Bot triggers to a webhook for connection to an order-routing system, though broker integrations should be verified as current before assuming execution-side functionality is live on your specific broker.
For traders who want to track how their tested setups perform in a live account, the free trading journal template is a useful starting point for logging results alongside the Strategy Tester output so you can compare backtest projections against real execution.
AI Strategy Lab and AI Coding Assistant
The AI Strategy Lab is a guided builder that turns plain-language strategy descriptions into testable rule sets inside the Strategy Tester. You describe what you are trying to trade, and the Strategy Lab converts that description into a structured strategy logic block you can backtest immediately. The gap it closes is significant: most traders who want a backtest do not want to write code, and the AI Strategy Lab removes that barrier without requiring any scripting knowledge.
The AI Coding Assistant serves traders who do want to write custom TrendSpider scripts and indicators. It helps you author, debug, and refine scripts written in TrendSpider’s scripting language, functioning similarly to a coding co-pilot that understands the platform’s syntax and common patterns. Together, the Strategy Lab and the Coding Assistant let two very different types of users, no-code traders and script-first traders, each access the full depth of the backtesting and automation layer.
Smart Watch Lists
Smart Watch Lists differ from the static ticker lists most platforms offer. Instead of manually adding and removing tickers, you define a rule set and TrendSpider automatically adds or removes tickers as they meet or fail the criteria. A watch list built around stocks in the S&P 500 with RSI above 50, trading above the 20-day SMA, and with volume above average in the last five sessions will update itself each day based on which tickers currently satisfy those conditions.
Common use cases include rotating earnings watch lists, momentum lists organized by sector, and options-flow-driven watch lists built around unusual activity. Smart Watch Lists pair directly with Strategy Bots and cloud alerts: once a ticker lands on a Smart Watch List, you can fire an alert when it then also triggers a specific chart condition, creating a two-step filter that reduces noise significantly compared to broad market scans.
Cloud-Based Alerts That Keep Running
TrendSpider’s cloud-based alerts continue running when your browser is closed, which is a meaningful differentiator versus chart-side alert systems on competing platforms. Most free-tier or browser-dependent alert systems only fire while the chart is open; if you close the tab, the alert stops monitoring. TrendSpider’s cloud layer runs the alert condition server-side, so a price cross, pattern trigger, or indicator condition will fire a notification even if you have not had TrendSpider open for hours.
Alerts can be set as simple price crosses, multi-factor conditions combining several indicators simultaneously, or pattern-based triggers. Dynamic alerts adjust their trigger level as the underlying data changes, which is useful for trendline or VWAP-relative conditions where the key level shifts day to day. For traders managing positions across multiple sessions or who cannot watch screens actively, cloud alerts are the practical reason to stay on a paid TrendSpider plan rather than using a free charting tool.
Options Tools and Unusual Options Flow
TrendSpider includes an options scanner and an unusual options flow feed that surfaces calls and puts filtered by volume, open interest, implied volatility rank, and days to expiration. The scanner lets you define flow parameters, such as large-notional sweeps, high open-interest contracts crossing above a threshold, or IV rank spikes above a given level, and scan the full options market for matching activity. Tickers surfaced by the flow scanner can be added to Smart Watch Lists or cross-referenced against chart-side analysis in the same workspace.
Chart-side options chains are also accessible directly from the charting view, so you can look at a price level, pull up the options chain for the nearby strike and expiration, and evaluate the trade without leaving the platform. One trade-off worth noting: TrendSpider’s options surface is useful for directional confirmation and sweep monitoring, but dedicated flow analytics tools provide deeper flow filtering and more granular options market dashboards. Whether one TrendSpider subscription covers enough of your options workflow is a personal call depending on how deep your flow research typically goes.
Corporate Fundamentals and Alternative Market Data
At higher plan tiers, TrendSpider bundles corporate fundamentals, alternative market data, and macro data feeds into the same workspace as the charting and scanning tools. The data coverage includes corporate fundamentals (earnings estimates, balance-sheet metrics, valuation ratios, revenue growth), insider activity filings, dark pool and ATS volume prints showing off-exchange trade flow, government trading disclosures, macroeconomic data series from the Federal Reserve’s FRED database, news feeds, and sentiment scores.
What this means in practice is that a trader running fundamental analysis alongside technical setups does not have to open a separate data terminal to cross-reference an idea. The TrendSpider workspace can show you a chart, the volume profile, the auto-drawn trendlines, insider activity on the same ticker, and the most recent earnings revision, all in a single view. For fundamentals-aware swing traders or options traders who want to understand the underlying story before taking a position, this data layer is a meaningful part of the case for a Premium or Enhanced plan subscription.
The dark pool and ATS volume data, government trading disclosures, and FRED macro series are the three surfaces most reviews of TrendSpider skip entirely because they are newer additions. If you are already paying for a separate macro or flow data subscription, evaluating whether TrendSpider’s bundled alternative data coverage is comparable is worth a trial period before renewing the standalone subscription.
Get Your Free Trading Resources
Grab the free trading journal template plus the same tools we use to stay organized, consistent, and objective.
- Free trading journal template
- Custom indicators, watchlists, and scanners
- Access our free trading community
Enter your email below to get instant access.
No spam. Unsubscribe anytime.
TrendSpider Pricing in 2026
TrendSpider offers five plans: Standard, Premium, Enhanced, Advanced, and Business. All core features are available across plans, with usage limits varying by tier. Higher tiers unlock the full alternative data suite, including dark pool flow, government trading data, and FRED series. A 14-day paid trial is available on all plans, and the trial fee is credited toward the first month of a paid subscription if you continue. See the full TrendSpider pricing breakdown on FTW for a plan-by-plan comparison, or visit TrendSpider’s pricing page for current rates. FTW readers can use TrendSpider coupon code FTW25 to save 25 percent at checkout on any plan.
Is TrendSpider Worth It?
TrendSpider is worth it for traders who would otherwise pay for two or three separate tools: a charting platform, a scanner, a backtesting tool, and a fundamentals or alternative data subscription. The all-in-one workspace consolidates those line items into one subscription, and for many traders the combined cost of the alternatives is higher than a TrendSpider Premium or Enhanced plan.
The clearest decision rule: if you would otherwise pay for TradingView Premium plus Trade Ideas plus a backtesting tool plus a fundamentals or alt-data subscription, TrendSpider consolidates those line items into one workspace at a lower combined cost. If you are a casual chartist who only needs price and a few indicators, TrendSpider is overbuilt for your workflow. If you are a high-frequency systematic trader who needs broker-side execution latency, TrendSpider is not that tool.
The sweet spot is the rules-based discretionary trader: someone who wants to define a setup, test whether it has worked historically, set cloud alerts for when the condition fires again, and track whether live results match the backtest. TrendSpider is built almost precisely for that workflow, and very few competitors cover the full loop from chart to backtest to alert to data context in one place. Use code FTW25 at checkout to save 25 percent on any plan.
You can watch my full review video of TrendSpider below:

TrendSpider Special Offer!
Exclusive Deal: 25% Discount with Code FTW25
Elevate Your Trading – Join TrendSpider Today!
- AI-Powered Analysis
- Automated Technical Analysis
- 16 charts per layout
Learn how to get a TrendSpider discount by watching this video!

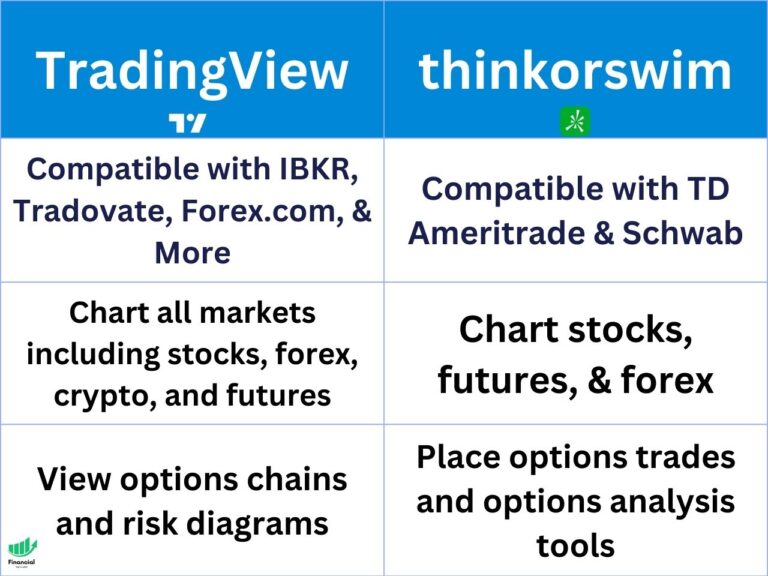
While TrendSpider is great, I still believe that TradingView is the best overall charting software for most people due to its freemium model and much lower plan prices for premium features. However, TrendSpider does have more to offer than TradingView if you are willing to pay the price for it. I recommend you try several charting tools and decide which suits your needs best before committing to an annual plan.
Consider reading my article about TrendSpider vs. TradingView to continue your research.
Frequently Asked Questions
Is TrendSpider worth the price?
TrendSpider is worth it for traders who would otherwise pay for separate charting, scanning, backtesting, and data tools. The all-in-one workspace consolidates those line items into one subscription. It is not the right fit for casual chartists who only need price and a few indicators, or for systematic traders who need broker-side execution.
How much does TrendSpider cost in 2026?
TrendSpider offers Standard, Premium, Enhanced, Advanced, and Business plans. All core features are included, with usage limits varying by plan. A 14-day paid trial is available on all plans. Visit TrendSpider’s pricing page for current plan rates. FTW readers can save 25 percent at checkout with code FTW25 on any plan.
Does TrendSpider have a free trial?
TrendSpider offers a 14-day paid trial across all plans. The trial fee is credited to the first month of a paid subscription if you continue, which means the trial functions as a refundable test drive rather than a free preview.
What does TrendSpider’s Sidekick AI actually do?
Sidekick AI is TrendSpider’s built-in AI analyst designed specifically for active investors. It can see your charts, access real-time market data, analyze fundamentals, dig into SEC filings, and run multi-symbol research. It works as an agentic assistant: you can ask it to build stock scanners, code custom indicators, create alerts across entire watch lists, and research insider or government trades. One key limitation: Sidekick does not add or remove indicators directly on your chart. Chart configuration still requires a manual step in the TrendSpider interface.
Can TrendSpider Strategy Bots place trades?
Strategy Bots deploy tested strategy logic forward as position-aware alerts or webhook-based automation. Broker or order-routing workflows should only be described when a supported integration is current and configured by the user. TrendSpider does not execute trades directly on your behalf.
Is TrendSpider better than TradingView?
TradingView wins on community, chart customization breadth, and price of entry. TrendSpider wins on automated technical analysis, integrated scanning, backtesting via Strategy Tester, cloud-based alerts, and alternative data layers in one workspace. The right answer depends on whether you would otherwise pay for two or three separate tools versus one. For a detailed side-by-side, see the TrendSpider vs TradingView comparison.
Related Articles
Get Your Free Trading Resources
Grab the free trading journal template plus the same tools we use to stay organized, consistent, and objective.
- Free trading journal template
- Custom indicators, watchlists, and scanners
- Access our free trading community
Enter your email below to get instant access.
No spam. Unsubscribe anytime.