Best TradingView Indicators
Are you overwhelmed with the massive amount of TradingView indicators to choose from? Figuring out which ones work best takes time, so I compiled a list of the top indicators to improve your trading in this article. They are also all indicators I have used personally over my years of trading.
Indicators behave very differently across chart speeds; pick the right time frame for your style before you tune any settings (here is the breakdown of the best time frame for intraday trading by trader type).
What are the Best Indicators on TradingView?
There are tons of indicators on TradingView. However, the best ones include:
- Ichimoku Extension – our custom extension of the Ichimoku indicator
- Volume Profile – view volume by price instead of by time
- Auto Fib Retracement – draws Fibonacci retracements automatically
- Market Profile – view how much time is spent at various price levels
- VWAP – a smooth line showing you the average trading price for one day weighted by volume
- MACD – moving average convergence divergence determines momentum
- Moving Averages – view EMA and SMA lines such as the 50 and 200-day moving average lines
- Relative Strength Index (RSI) – quick way to tell if a stock is overvalued or undervalued on a scale of 0-100
- Anchored VWAP – VWAP anchored to a specific date
- IV Rank and Percentile – detrmines whether a stock’s implied volatility is high or low
- Footprint Charts – view filled order volume by price for each candle
Clicking the links above will bring you to the detailed descriptions of the indicators within this article.
- The best TradingView indicators to use are the volume profile, anchored VWAP, Ichimoku Extension, and Fibonacci retracements.
- Continue reading to view the 11 best TradingView indicators and how you can use them to improve your trading strategy.
- Consider joining our community to get hands-on help with these indicators.
Recommended Tool
Financial Tech Wiz Trading Journal
Picking indicators is the easy part. Knowing which ones actually work for your strategy is harder. Track every trade, see win rate by symbol and hold duration, and let AI-powered insights surface the patterns you would otherwise miss. Starting at $9.91/month billed annually.
Try It Free1- Ichimoku Extension – Financial Tech Wiz
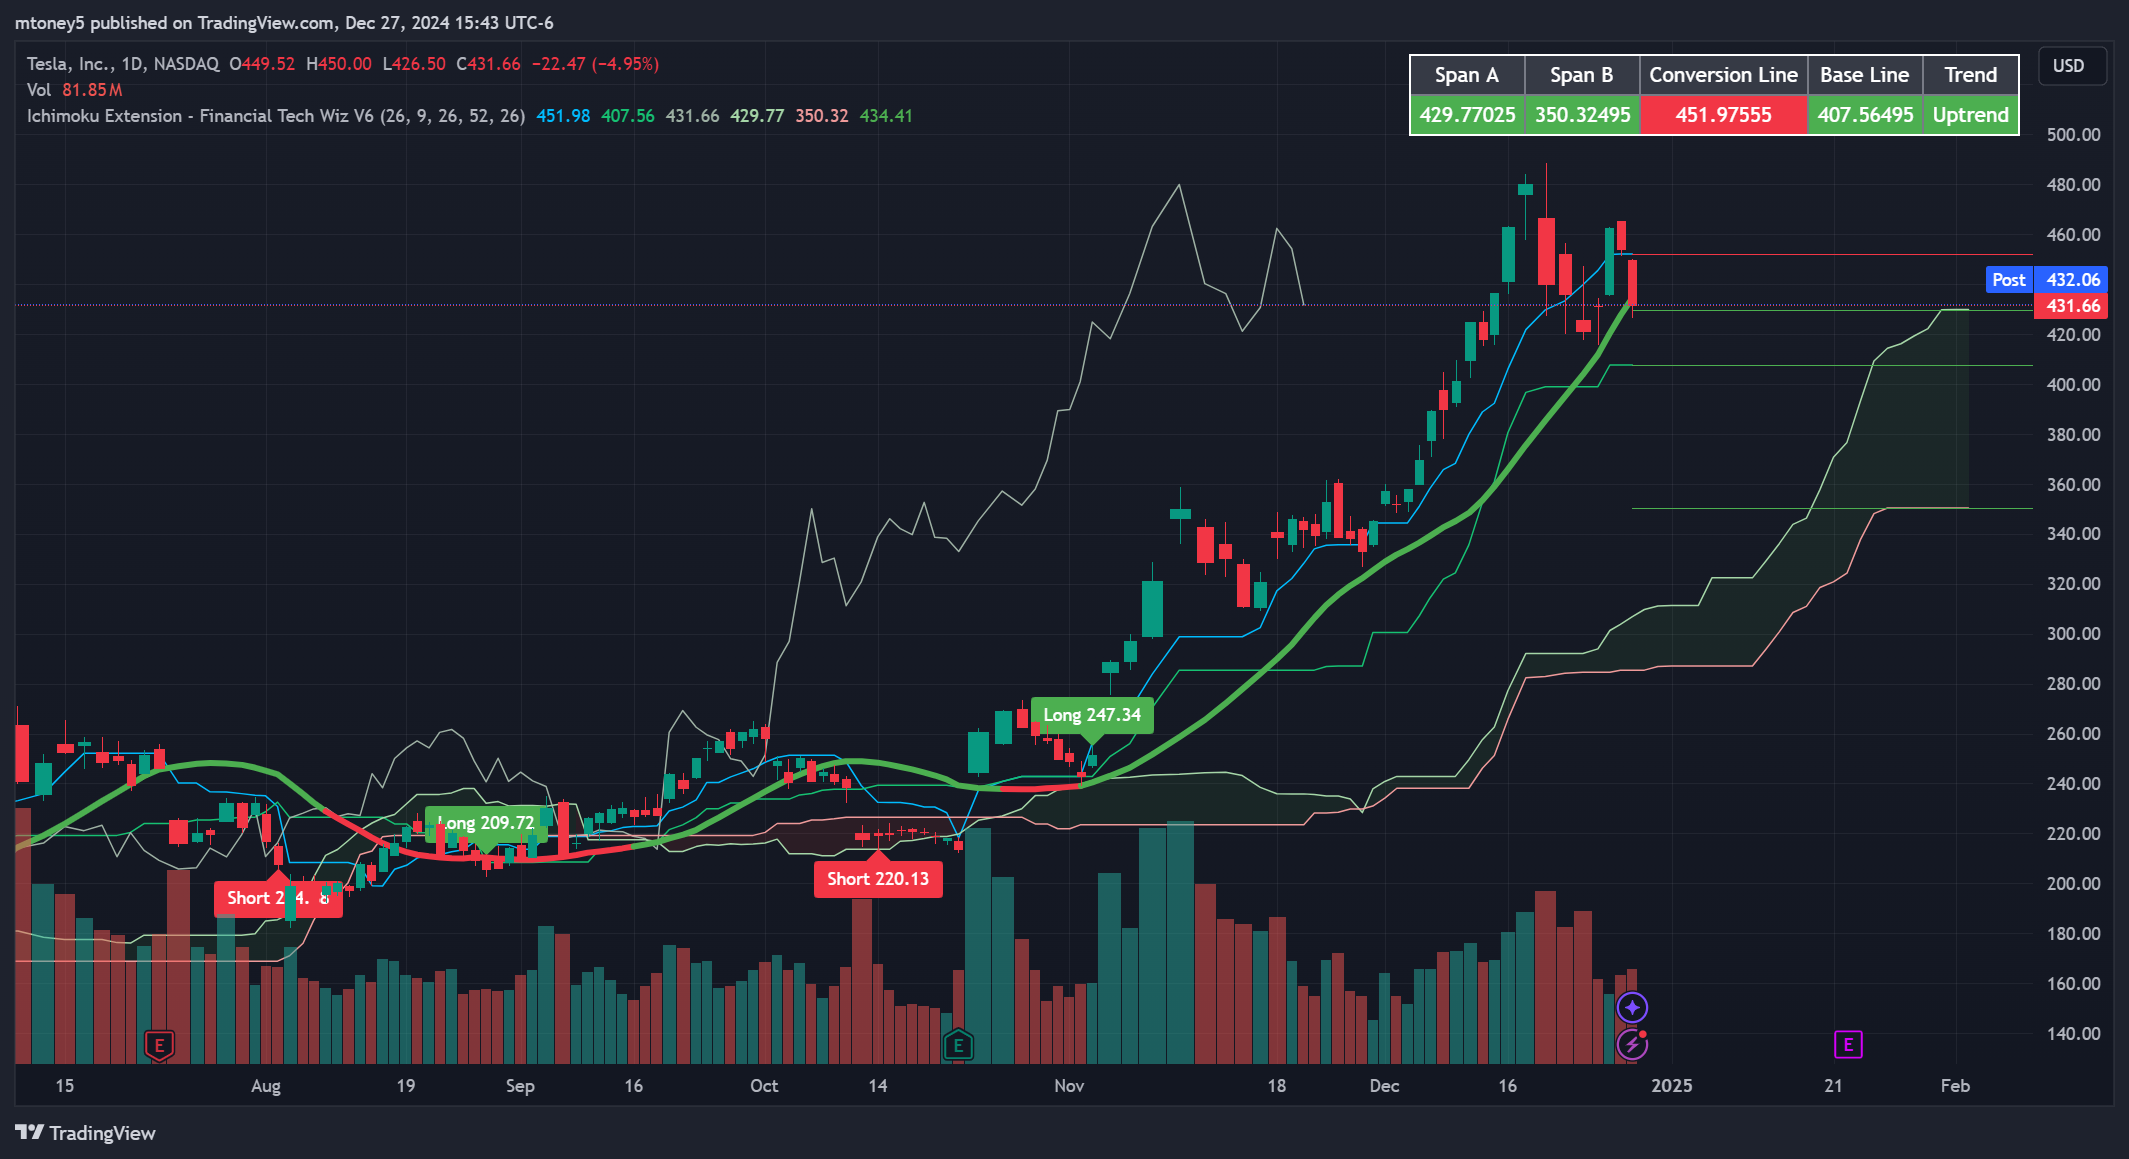
The Ichimoku Cloud is a dynamic trend following indicator involving several moving average lines. It consists of five lines and a “cloud” formed by the interaction of two of these lines.
A green cloud signals an uptrend, while a red cloud signals a downtrend. Additionally, you can use the baseline and conversion line crossovers to determine entry and exit points.
We created the Ichimoku Extension indicator to make it easier to read the standard Ichimoku Cloud indicator. It automatically identifies and displays these crossovers and translates them into long and short signals.
The baseline and conversion lines are similar to a 9EMA and a 26EMA, another common indicator traders use.
The Ichimoku Extension allows you to identify trends easily and determine entry and exit points based on TK crossovers much easier than on the default Ichimoku indicator. If you have any questions you can join our free community.
Get access to the indicator plus our trading journal template and community for free!
Don’t miss out – Get access now and start trading smarter!
- Long and Short Signals
- Spot Support & Resistance
- Hands-on Help in Our Community
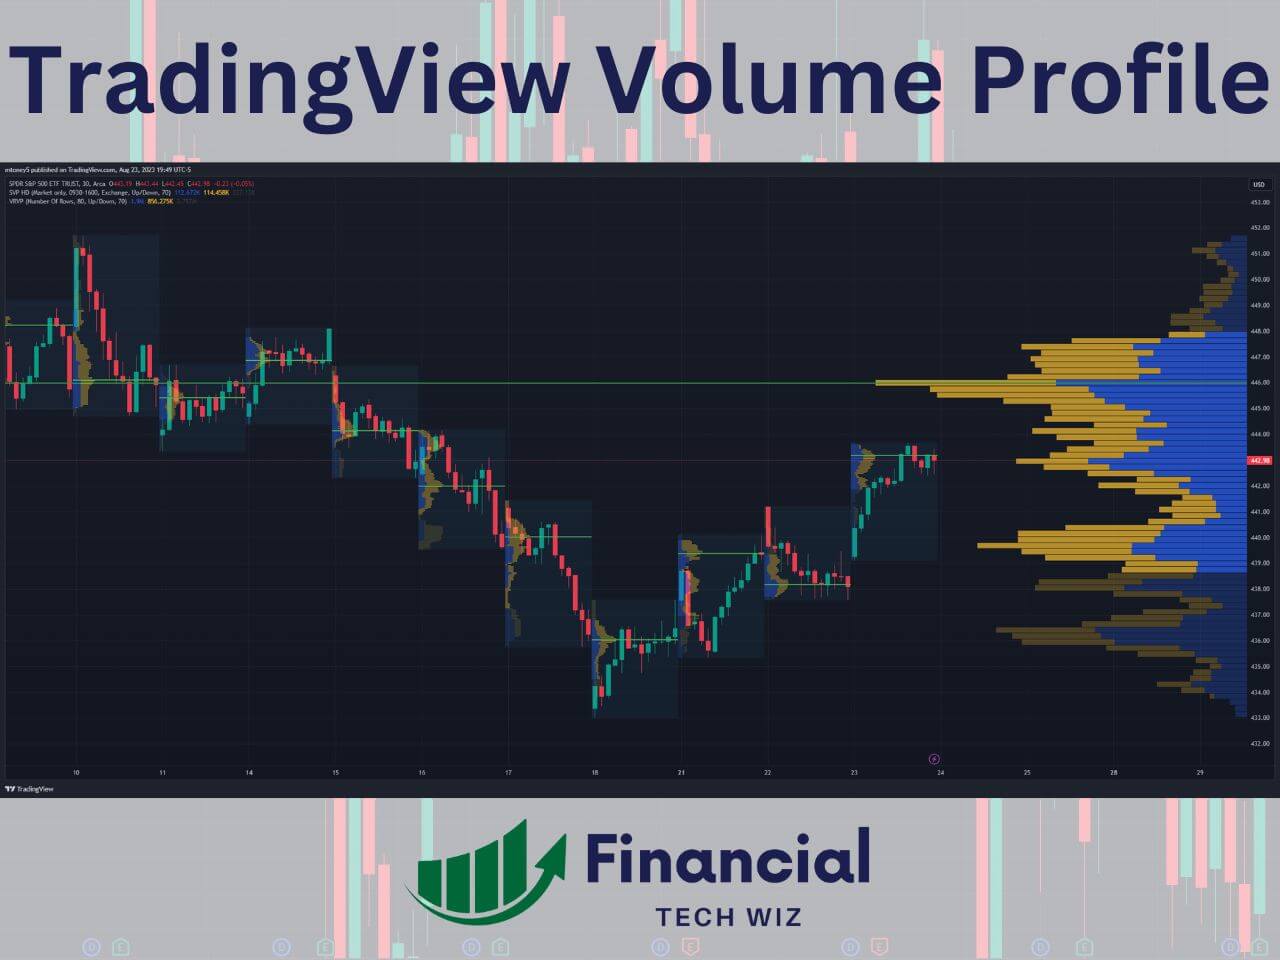
2- Volume Profile Indicator
The volume profile shows you volume by price for a defined time period. Traditional volume charts show you volume by time, which is not nearly as valuable. Traders can determine what price has the most supply and demand, which is extremely helpful in determining support and resistance levels on a chart. Before working with Volume Profile, make sure the basic TradingView volume indicator is set up; our guide covers the settings and how to read the bars.
TradingView offers a few different types of volume profile indicators:
- Visible Range Volume Profile: view the profile for the visible candles on the chart, which adjusts dynamically as you zoom in and out.
- Session Volume Profile: view a unique profile that resets each trading day (session), which is great for day traders.
- Volume Profile Fixed Range: pick a range of candles to view a volume profile for that doesn’t change as you move around your charts.
My favorite way to use the volume profile indicators on TradingView is to combine the session volume profile with the visible range volume profile so you can view profiles for each day and the entire visible chart.
The volume profile indicator on TradingView is an advanced tool that requires you to have a premium subscription. However, new users can usually get a TradingView free trial to test it out for 30 days.
Full Indicator Review: Learn more about the volume profile
Exclusive Deal: 30-Day FREE Premium Access + Bonus Credit
Don’t Miss Out – Sign up for TradingView Now!
- Advanced Charts
- Real-Time Data
- Track all Markets
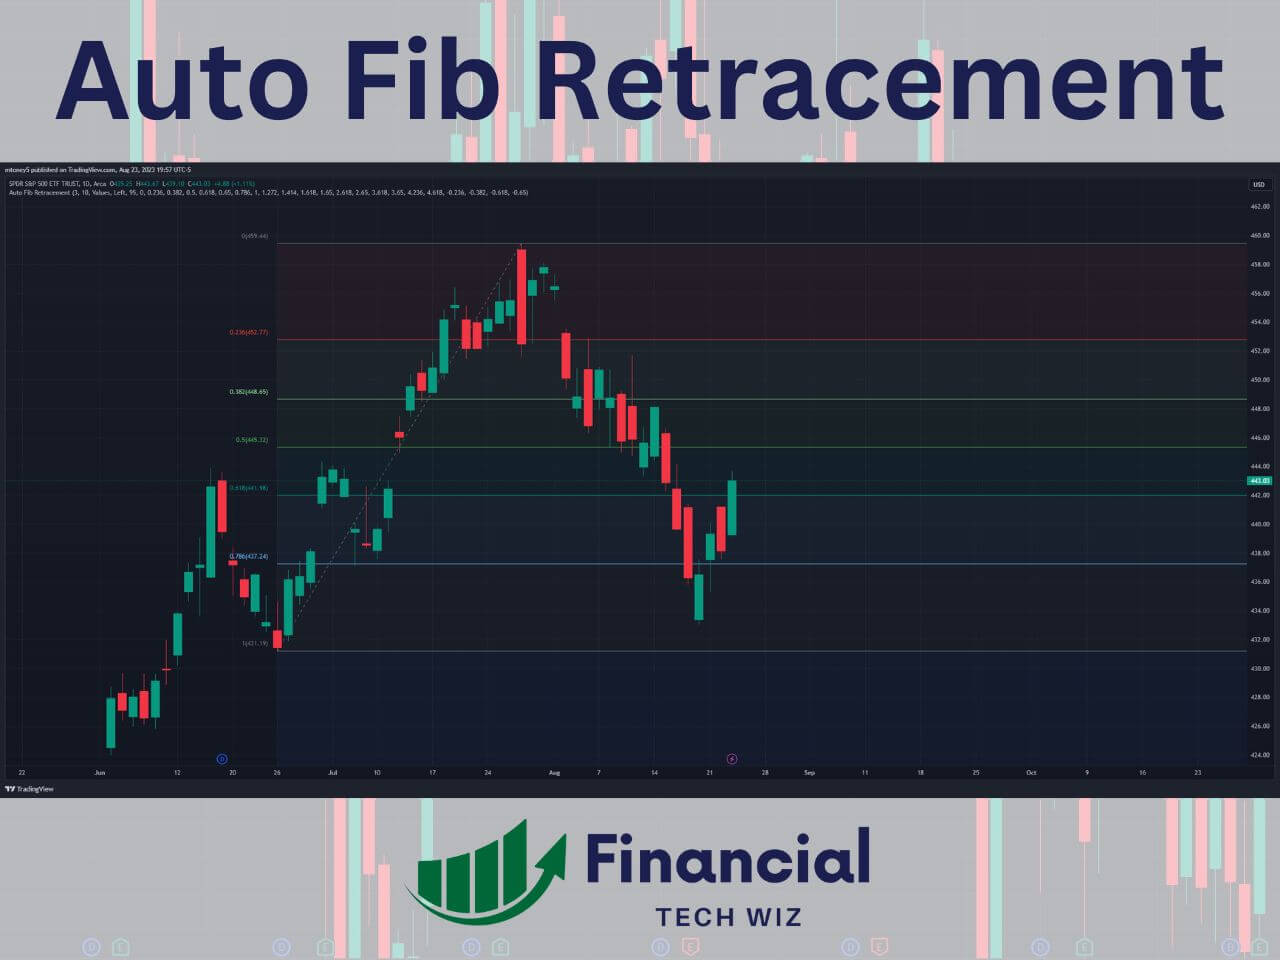
3- Auto Fib Retracement
The Auto Fib Retracement indicator automatically plots Fibonacci retracement levels on a chart, helping traders identify potential support and resistance zones based on the key Fibonacci ratios (23.6%, 38.2%, 50%, 61.8%, and 78.6%).
While traders often draw their own Fib Retracement lines manually, the Auto Fib tool is a great way to save time and view retracement levels on several time frames.
You can also change the depth to a larger number if the indicator is drawing the lines too close to the current stock price.
Auto fib retracement tools are also available on Trendspider. To learn more, check out my article on TrendSpider vs. TradingView!
Full Indicator Review: Learn more about the Fibonacci retracements on TradingView
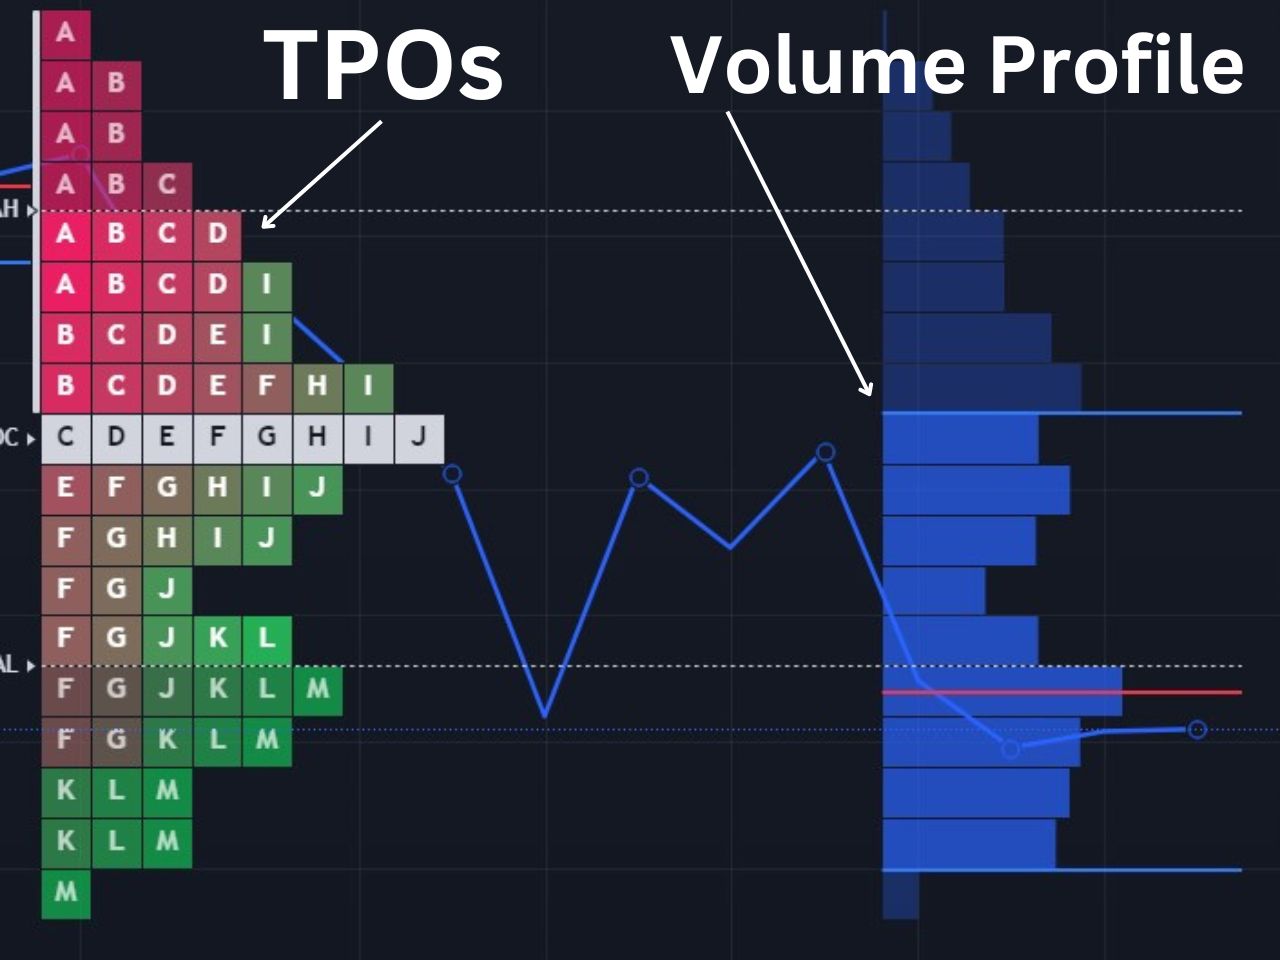
4- Market Profile (Time Price Opportunity TPO Charts)
The market profile is similar to the volume profile, except it also shows time spent at prices on top of volume by price. The market profile is commonly used by futures traders to interpret the market structure and identify trading opportunities.
I recommend you learn to identify market structures like poor highs, poor lows, single prints, and understand the mechanics of auction market theory to make the best use of the TPO charts. TradingView’s TPO charts aren’t available to free users, but you can use my affiliate link to get a free trial to test it out for 30 days with no commitment.
Full Indicator Review: Learn more about the TradingView TPO charts
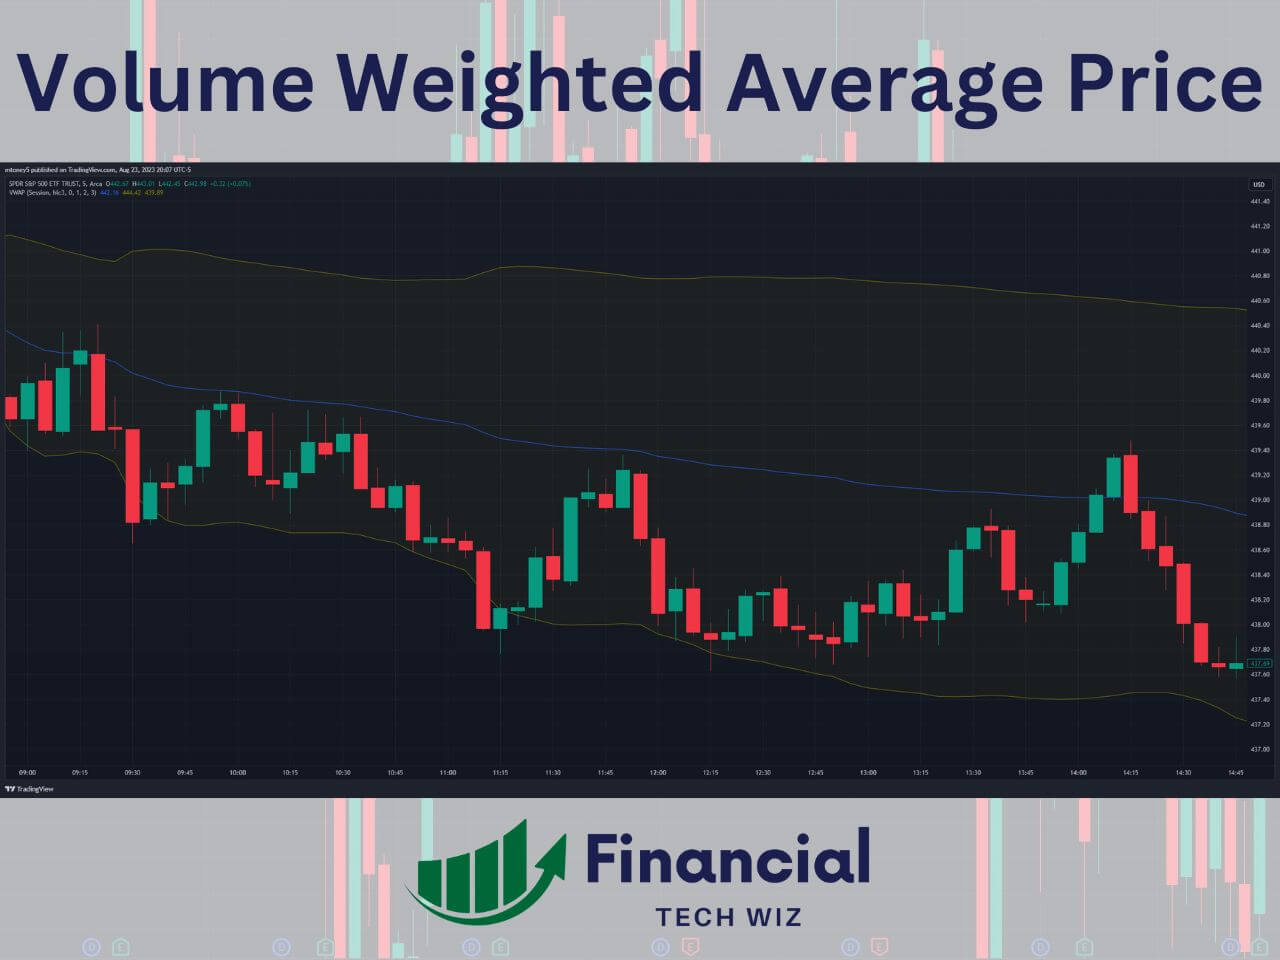
5- VWAP (Volume Weighted Average Price)
The VWAP is a TradingView indicator for day traders that shows you where the most volume has occurred through a particular trading day. It is considered about the fair price for a stock since it is where the most shares have been traded.
VWAP strategies include buying when the price breaks over the VWAP for a continuation play. Alternatively, you can wait for the stock price to be far away from the VWAP and use a mean reversion strategy. You can also check out the anchored VWAP if you are not a day trader.
Full Indicator Review: Learn more about the VWAP on TradingView
If you are tracking VWAP-based entries across multiple symbols, the Financial Tech Wiz Trading Journal will show you which symbols and hold durations actually pay off.
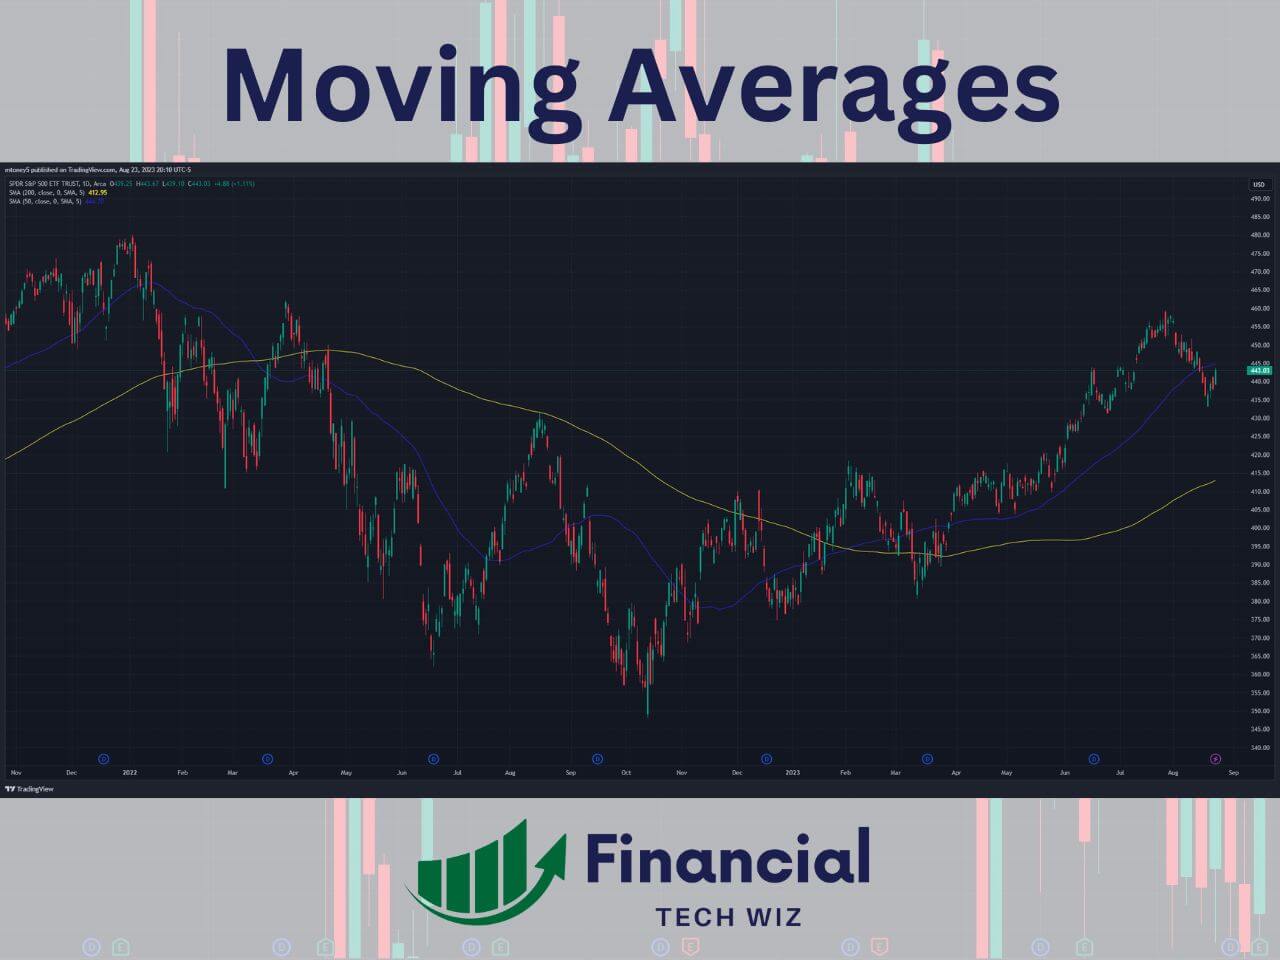
6- Moving Averages
There are two types of moving averages, SMA (simple moving average) and EMA (exponential moving average). The most common ones for swing traders and investors to utilize are the 50 and 200 SMA lines on the daily chart. Otherwise known as the 50 and 200-day moving averages.
Short-term traders use EMA lines such as the 9 and 26-period lines on shorter-term time frames like the 5-minute and 1-minute charts for day trading and short-term swing trading.
Full Indicator Review: Learn more about TradingView moving averages
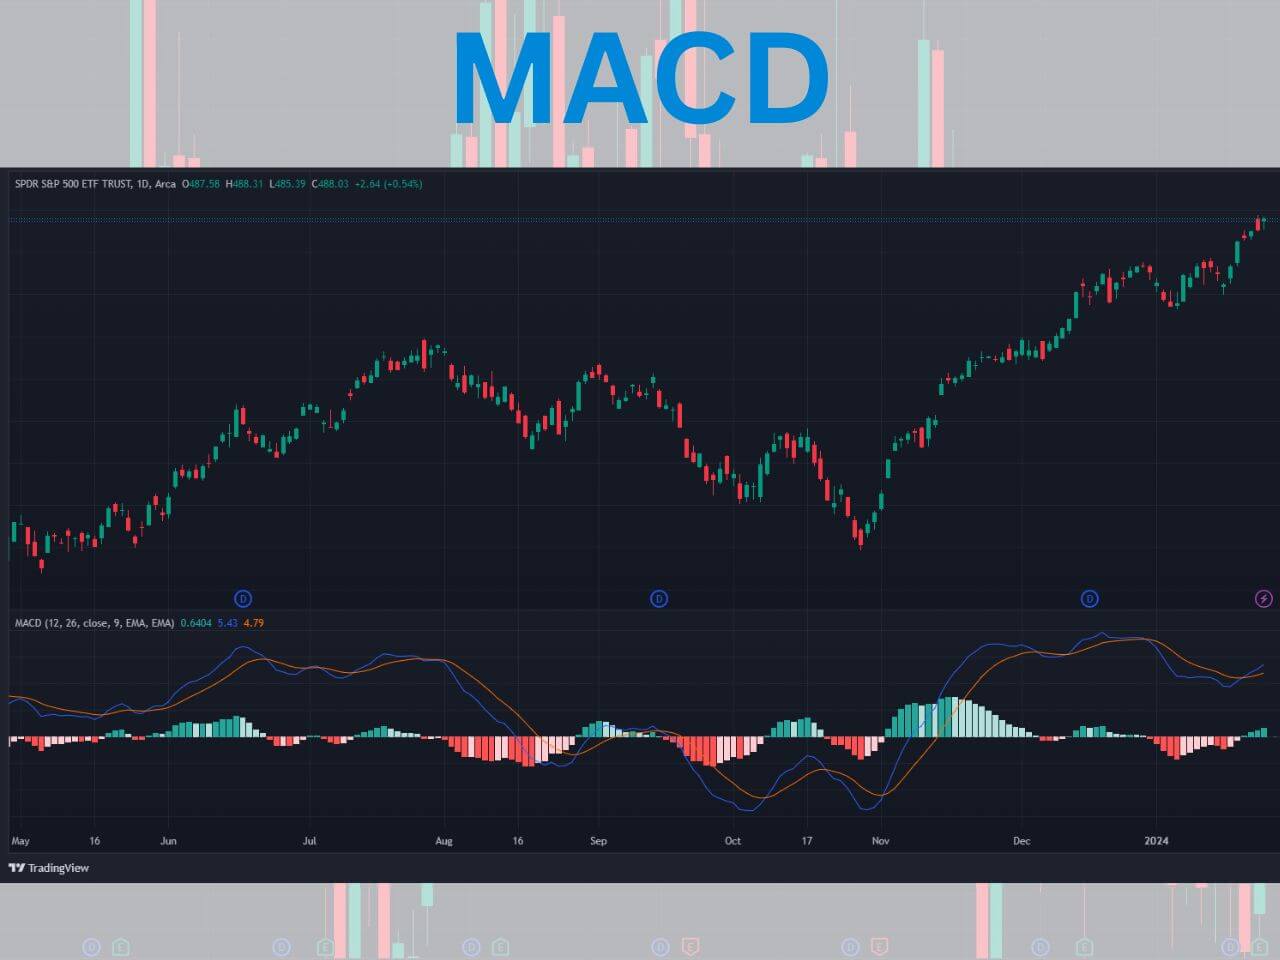
7- MACD
The MACD (Moving Average Convergence Divergence) is a popular trend-following indicator. It is the result of two lines: the MACD line and the signal line.
- MACD Line: The MACD line is the result of subtracting the 26-period EMA by the 12-period EMA, typically for days when used on the daily timeframe.
- Signal Line: The signal line is the 9-period EMA of the MACD line.
When the MACD line crosses above the signal line, it’s considered a bullish signal (suggesting it might be a good time to buy). Conversely, when the MACD line crosses below the signal line, it’s viewed as a bearish signal (suggesting it might be a good time to sell).
Full Indicator Review: Watch our video on the TradingView MACD
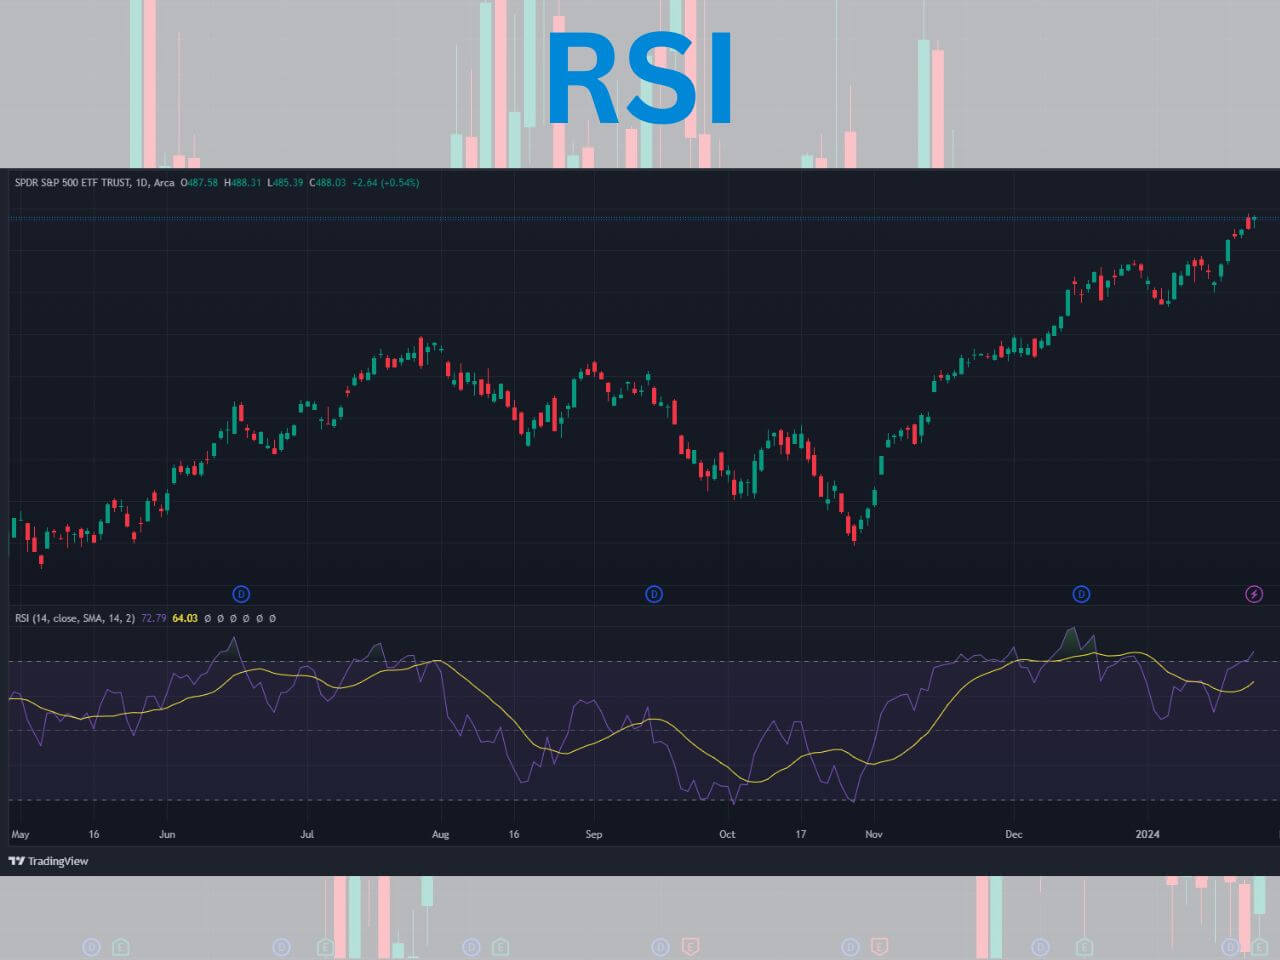
8- Relative Strength Index (RSI)
The RSI indicator is a popular tool for identifying whether an asset is overbought or oversold. It is a momentum oscillator that measures the speed and change of price movements on a scale from 0 to 100.
Typically, a stock with an RSI reading over 70 is considered overvalued, while a reading under 30 is considered undervalued. However, it is best to combine the RSI with other indicators to determine optimal entry and exit points.
The RSI is calculated based on an asset’s price movements over a certain period, typically 14 days. It compares the magnitude of recent gains to recent losses to determine the speed and change of price movements.
Full Indicator Review: Learn more about the TradingView RSI
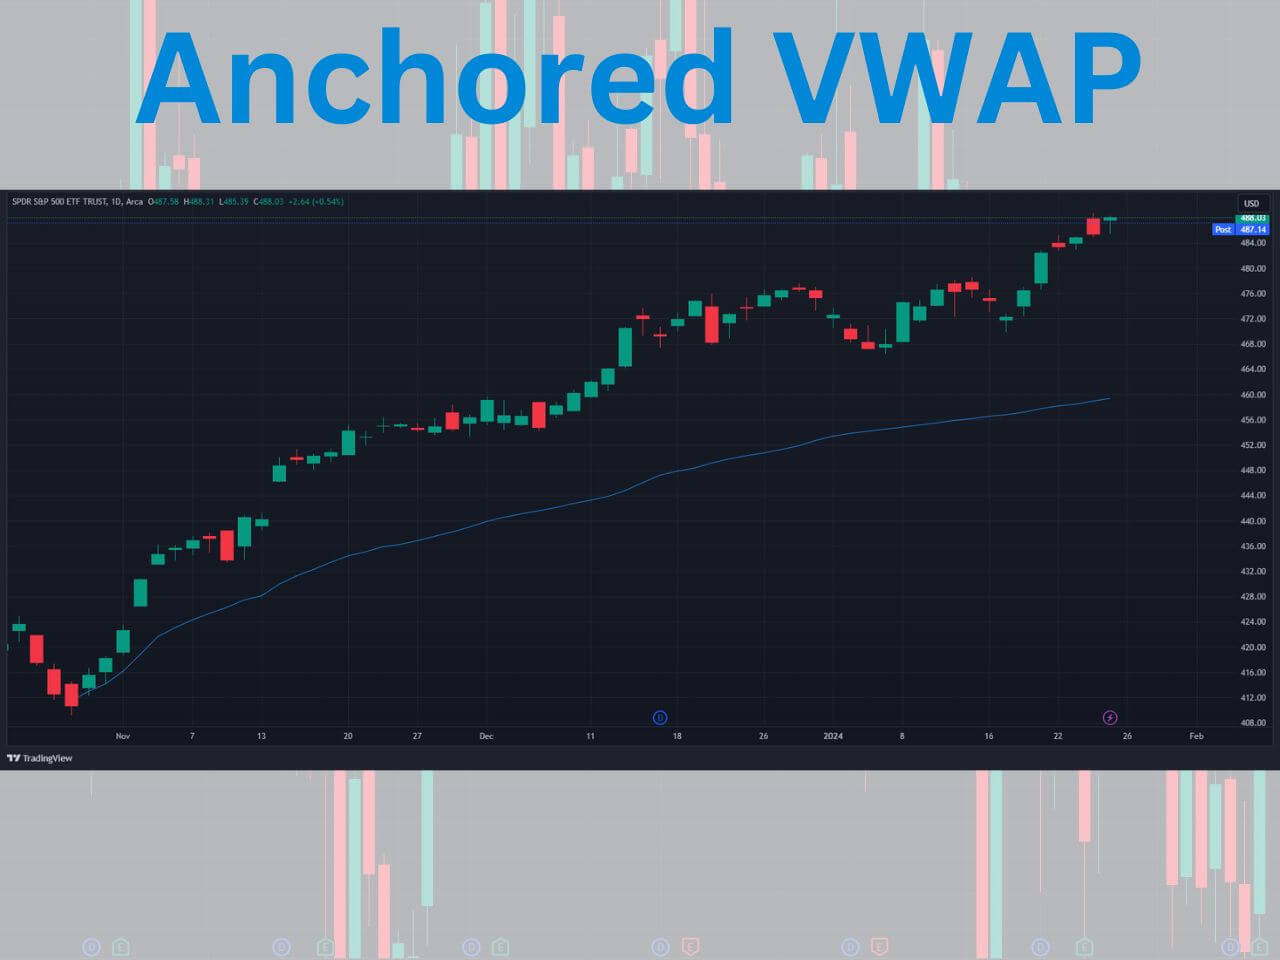
9- Anchored VWAP
The Anchored VWAP (Volume Weighted Average Price) is a trading indicator that gives traders a comprehensive look at a stock’s price in relation to its volume over a specific time frame.
Generally, traders will set the anchor point at a swing high or a swing low. For example, if a stock made a 52-week low a few weeks back, you can set the anchored VWAP here to determine a good medium term support level.
The regular VWAP is the average price of a stock weighted by its volume. The unique feature of the Anchored VWAP is that it allows traders to choose a specific starting point (or “anchor”) from which to calculate the VWAP.
Full Indicator Review: Learn more about the anchored VWAP
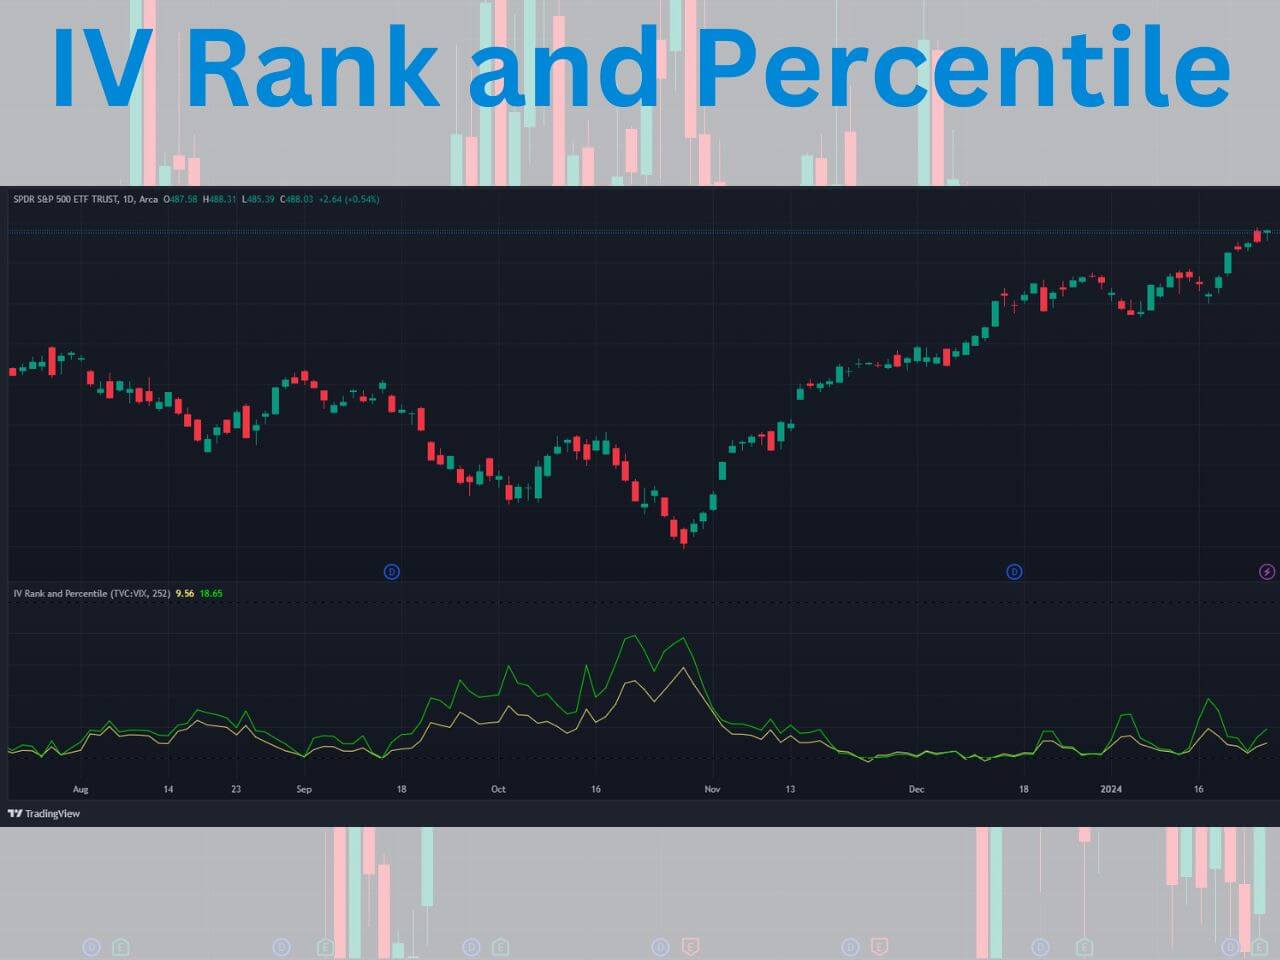
10- Implied Volatility Rank and Percentile
Implied volatility represents how much volatility the market is pricing for a specific asset. When implied volatility is high, options are generally more expensive to account for the perception of large price movements in the future. It is a key factor in options pricing and trading strategies.
Implied volatility rank and percentile help you determine whether a stock’s implied volatility is high or low based on the last year of data. Implied volatility rank is free to use on TradingView but is not native to the platform. You can use the IV Rank and Percentile custom indicator by Martin Shkreli for free.
Full Indicator Review: Learn more about IV Rank & Percentile on TradingView
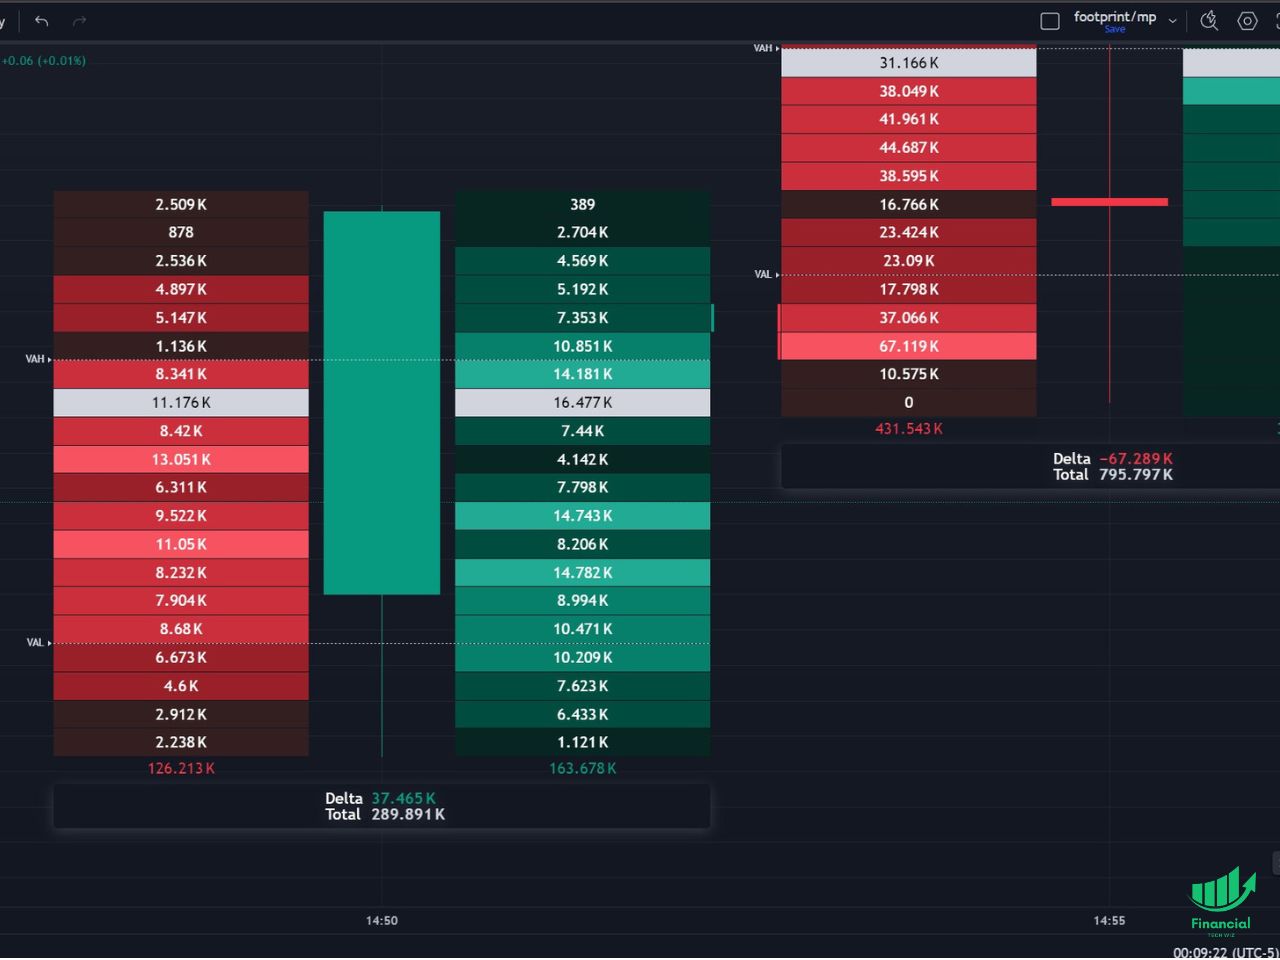
11- Volume Footprint Charts
TradingView’s volume footprint chart type allows you to view how many orders have been filled on both the buy and sell side.
On the left side of the candle, you can see how many shares were sold by price in red. On the right side of the candle, you can see how many shares were bought within that candle and at what price.
The bottom of the candle also shows you the delta and total volume traded during the candle you are analyzing. The volume footprint feature requires you to have a TradingView paid subscription, but you can use my affiliate link to get a free trial to test it out for free.
Full Indicator Review: Learn more about the TradingView footprint charts
Many of these oscillator and trend-following indicators are also available as screener filter columns in TradingView. See the TradingView stock screener guide for filter recipes that put RSI, MACD, and moving average conditions to work on the full ticker universe.
How to get a TradingView free trial
If you don’t want to spend your hard-earned money testing out some of these indicators, new users can usually get a 30-day TradingView free trial.
TradingView is one of the most widely used charting tools available, and it is great for beginners and advanced traders. We have an entire article explaining how to get a TradingView free trial you can read if you have any questions.
Exclusive Deal: 30-Day FREE Premium Access + Bonus Credit
Don’t Miss Out – Sign up for TradingView Now!
- Advanced Charts
- Real-Time Data
- Track all Markets
Which indicator is best for entry and exit?
There isn’t a single indicator that is “best” for determining entry and exit points. However, the Ichimoku indicator provides traders clear signals when the baseline and conversion lines crossover.
When the conversion line cross above the baseline, it is a signal to buy. On the other hand, when the baseline crosses below the baseline, it is a signal to sell.
Once you are in a position, you can use one of the several lines to determine your stop loss and take profit levels.
What indicator do most traders use?
There are tons of indicators to use on Tradingview, and each trader must find the one that works best for their trading strategy.
However, the most common indicators include Fibonacci Retracements, simple moving averages (SMAs), and exponential moving averages (EMAs).
The Best TradingView Indicators | Bottom Line
Selecting and utilizing the appropriate indicators is crucial for successful trading. The right indicators can provide valuable information on market trends, support and resistance levels, and potential trade opportunities.
By understanding how each indicator works and using them in conjunction with other technical analysis tools, traders can enhance their market analysis skills and improve their overall trading performance. The TradingView heatmap is one such complementary view: a sector-level overlay that shows which markets are moving before you apply any indicator filter. Check out our article on the best TradingView indicators for day trading to learn more!
Most of the indicators on this list are most useful when paired with an alert. Our guide on setting alerts on TradingView walks through the alert creation flow for indicator-based conditions.
Before taking any indicator live, run it against your actual setup in the paper account first. Our guide on how to test these indicators in paper trading first covers the full Order Panel workflow, Bar Replay backtesting, and the four mistakes that make paper practice useless.
Pair your favorite indicators with the free trading journal template so you can measure performance instead of guessing.
If you want a starter spreadsheet to log trades against these indicators while you decide which ones fit your style, here is a free Google Sheets template:
Get Your Free Trading Resources
Grab the free trading journal template plus the same tools we use to stay organized, consistent, and objective.
- Free trading journal template
- Custom indicators, watchlists, and scanners
- Access our free trading community
Enter your email below to get instant access.
No spam. Unsubscribe anytime.
FAQs
What is the most accurate indicator on TradingView?
No single indicator is reliably accurate on its own. The most consistent results come from combining a trend indicator (like a moving average or the Ichimoku Cloud) with a momentum oscillator (like RSI or MACD) and a volume tool (like VWAP or Volume Profile). Each layer confirms a different piece of the setup, which filters out false signals. Anyone advertising a 100% accurate buy and sell indicator is selling noise.
How many TradingView indicators can I use on one chart?
TradingView’s free Basic plan limits each chart to two indicators. The Essential plan raises the limit to five, Plus to ten, and Premium to twenty-five. Most experienced traders use three or four total: one for trend, one for momentum, and one for volume. More than that and signals start contradicting each other.
Are the best TradingView indicators free?
Most indicators on this list, including VWAP, RSI, MACD, moving averages, and Auto Fib Retracement, are free and built into TradingView. Volume Profile and Footprint Charts require a paid plan because they pull tick-level volume data, which costs more to deliver. Full breakdown in our TradingView pricing guide.
What are the best TradingView indicators for day trading?
VWAP, Anchored VWAP, Volume Profile, and a fast moving average such as the 9 EMA are the four indicators most day traders rely on. They show the day’s fair price, where volume is concentrated, and where short-term momentum is shifting. RSI on a 5- or 15-minute chart is useful for spotting intraday exhaustion.
What are the best TradingView indicators for swing trading?
For swing trades held days to weeks, traders typically combine the 50-day and 200-day moving averages, the Ichimoku Cloud, and Fibonacci retracements. Anchored VWAP also helps when anchored to a recent earnings release or breakout candle. MACD on the daily chart confirms whether the swing is still in a trending phase.
Can I create custom indicators on TradingView?
Yes. TradingView’s Pine Script editor lets you write or modify indicators directly in the platform. You can also import community-built scripts from the public library or load private invite-only scripts shared by their creators. The Ichimoku Extension on this page is one example of a custom Pine Script we built to make the standard Ichimoku Cloud easier to read.
Before you go
If you want to keep educating yourself about TradingView, you must check out these posts as well:
- TradingView Review
- TradingView Fibonacci Retracements Guide
- TradingView Footprint Charts
- TradingView Volume Profile
- TradingView Real-Time Data
- How Much Does TradingView Cost?
- Triangle Chart Pattern Guide
- TradingView Free Trial Guide
- TradingView TPO Charts
- How to Remove Indicators on TradingView
Get Your Free Trading Resources
Grab the free trading journal template plus the same tools we use to stay organized, consistent, and objective.
- Free trading journal template
- Custom indicators, watchlists, and scanners
- Access our free trading community
Enter your email below to get instant access.
No spam. Unsubscribe anytime.


