How to Use the TradingView RSI Indicator: Setup, Settings, and Strategy
The Relative Strength Index is one of the most-watched momentum indicators on TradingView, and it earns that attention because the math behind it is simple and the signals are useful when you read them in context. This guide walks through adding the RSI to a TradingView chart, tuning the period and the moving-average overlay for your trading style, reading overbought and oversold signals without being trapped by them, and using divergence and alerts to trade the indicator with more conviction. The last section covers how to track RSI-based trades so you can tell which settings actually work for your strategy.

Key Takeaways
- The default RSI on TradingView is a 14-period calculation plotted between 0 and 100, with 70 marking overbought and 30 marking oversold; both levels are starting points, not absolute rules.
- RSI signals improve when you confirm them with divergence, multi-timeframe alignment, or another indicator (volume, a moving average, or VWAP), and they fail most often when traders use RSI alone in a strong trend.
- The fastest way to figure out which RSI period works for your style is to track your entries and exits in a journal and group them by setting; period 14 is the default for a reason, but scalpers often prefer 7 and swing traders sometimes use 21.
Find the RSI Setting That Actually Works for Your Strategy
Log every RSI entry and exit in the Financial Tech Wiz Trading Journal, then filter by symbol and hold duration to see which period (7, 14, or 21) gives you the best win rate. AI-driven insights surface the patterns you would otherwise miss in a spreadsheet.
Try the Trading JournalHow to Add the RSI Indicator on TradingView
Adding the RSI to a TradingView chart takes about ten seconds. Sign in to TradingView (the free trial is the cleanest entry point if you have not signed up yet, and existing users get a referral credit through the same link), open the chart you want to analyze, and follow these steps.
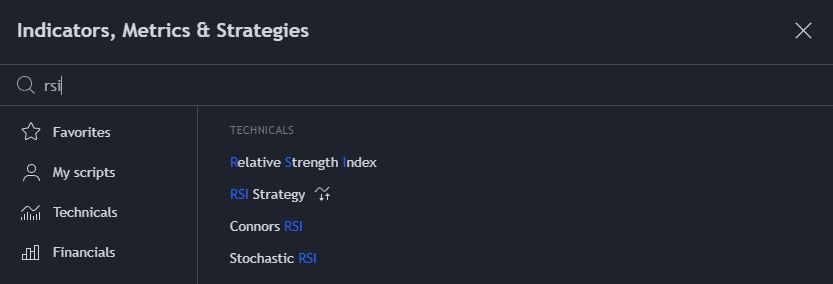
- Click the Indicators button at the top of the chart toolbar, or right-click anywhere on the chart and select Add Indicator.
- In the search field, type RSI and select Relative Strength Index from the Built-ins list.
- The indicator appears in a separate pane below the price chart, plotted on a 0 to 100 scale with horizontal lines at 70 and 30.
The RSI is now applied to the chart with TradingView’s default settings. The next sections cover how to read those defaults and when to change them.
Customizing RSI Settings on TradingView
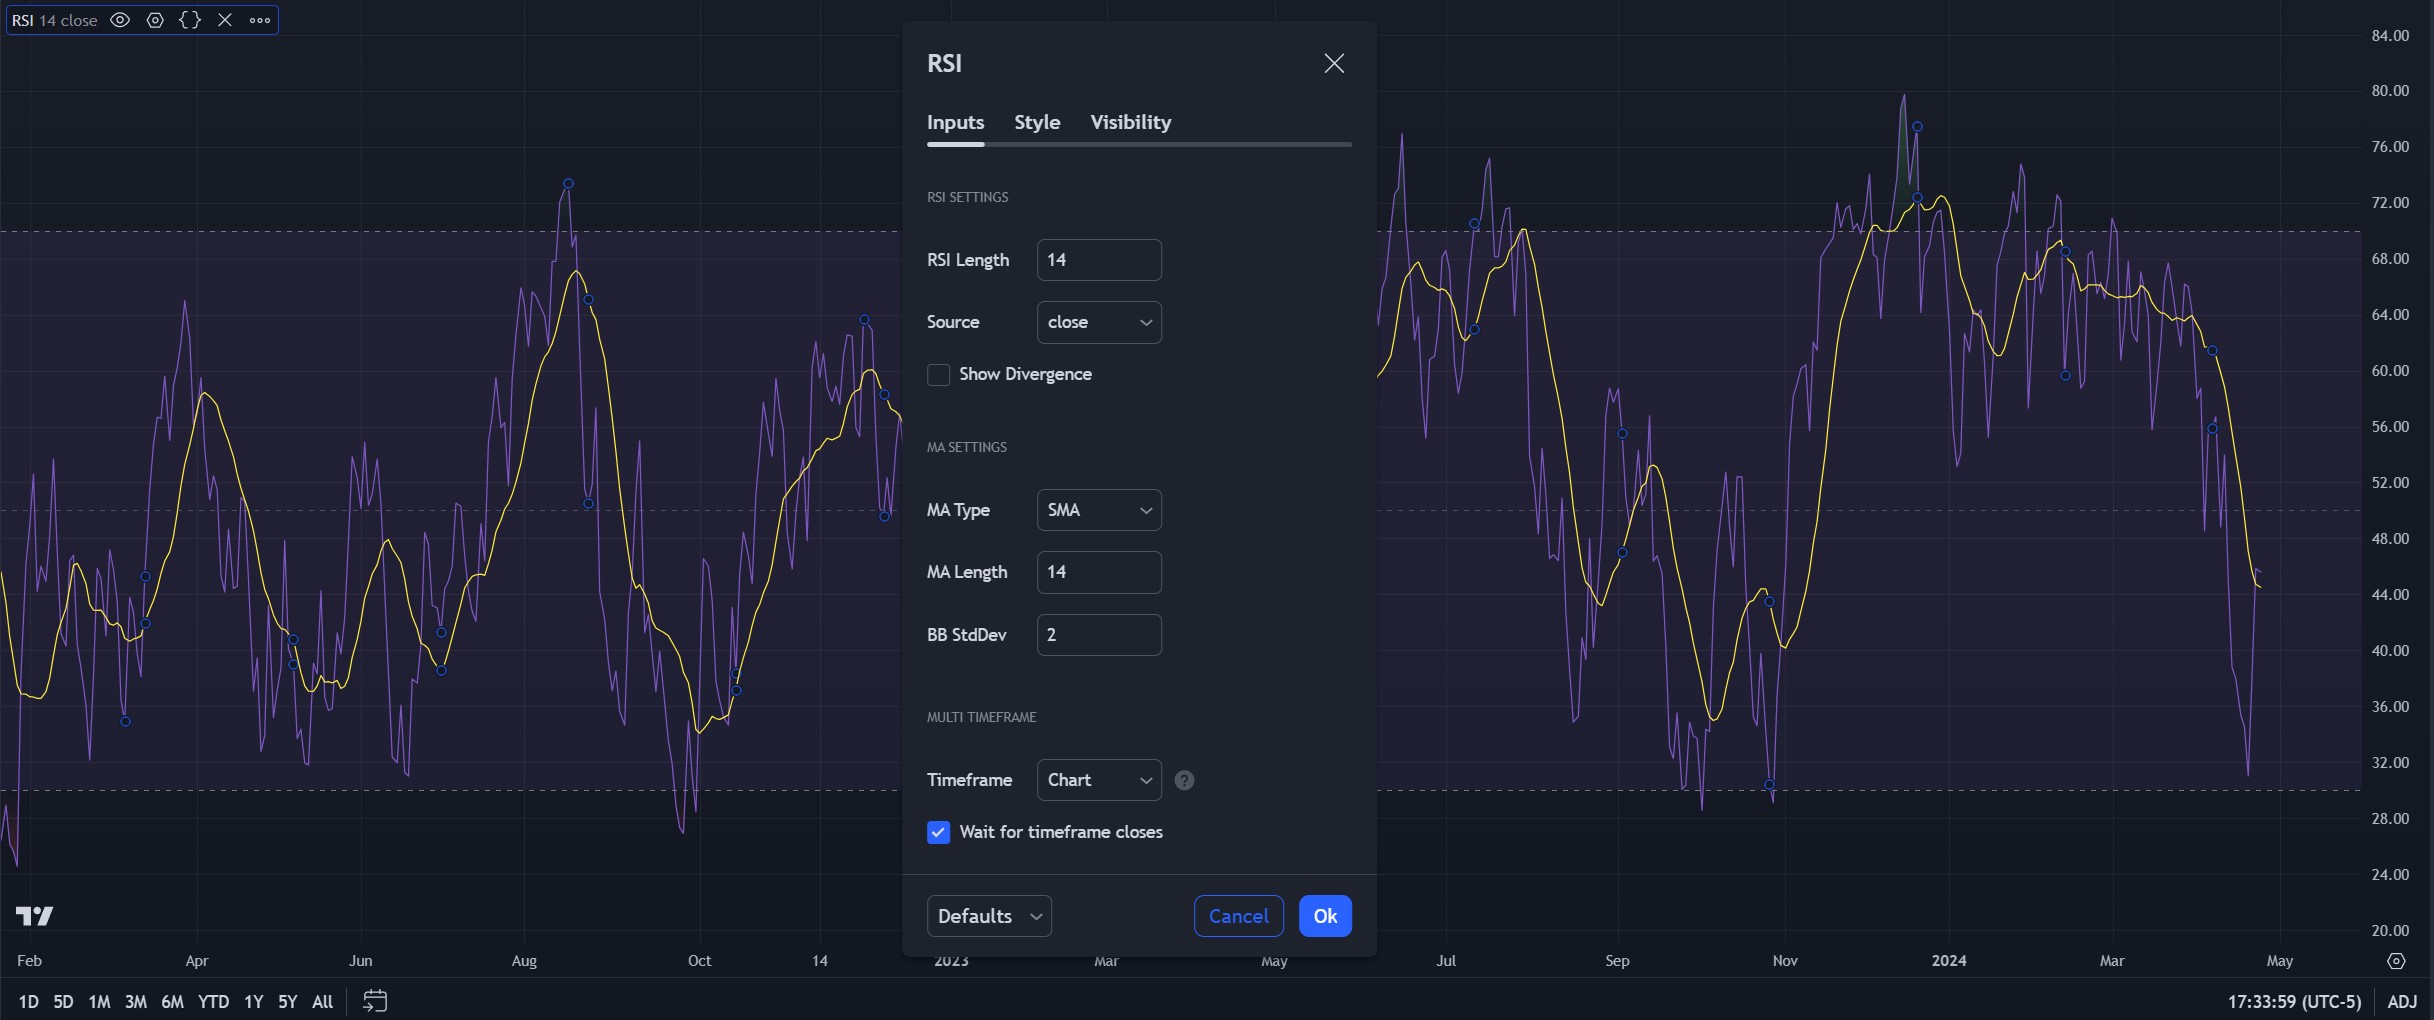
Click the gear icon next to the RSI title in the indicator pane to open the Settings dialog. The two tabs that matter are Inputs and Style.
On the Inputs tab, you can change:
- RSI Length. The default is 14. This is the number of bars used to calculate the RSI value. Shorter lengths (7 to 9) make the indicator more sensitive and produce more signals, which scalpers and aggressive intraday traders prefer. Longer lengths (21 to 25) smooth the line and filter noise, which suits position traders.
- Source. Default is close. Stick with close unless you have a specific reason to use HL2 or HLC3 (some traders prefer those for highly volatile assets).
- MA Length and MA Type. TradingView plots a moving average of the RSI itself in the same pane (the orange line by default). Default is a 14-period SMA. You can switch to EMA, WMA, or VWMA depending on whether you want the MA to react faster (EMA) or smooth more aggressively (SMA). For a deeper comparison see our breakdown of MA, EMA, SMA, and WMA.
On the Style tab, you can change line color and thickness, toggle the upper and lower bands (70/30), and adjust the band fill. Most traders raise the upper band to 80 and lower the band to 20 in choppy markets to filter false signals.
Get a TradingView Referral Credit and Free Trial
If you are not yet on TradingView, our TradingView free trial link gives you 30 days of Pro features (Ultimate currently runs a 14-day trial as of 2026; verify on the signup page). Existing users who sign up through the same link get a referral credit applied to their next plan renewal.
What Time Frame Is Best for the RSI on TradingView?
The RSI works on every time frame, but the period setting should change with the time frame to keep signals meaningful. A 14-period RSI on a 5-minute chart calculates over 70 minutes of data, which is short enough to react to intraday momentum bursts but long enough to filter single-bar noise. A 14-period RSI on a daily chart calculates over 14 trading days (about three weeks), which captures swing-trade context.
For day trading, a 7 or 9 period RSI on the 5-minute or 15-minute chart fires more often and works well with confirmation from VWAP or a moving average. For more on intraday timeframes see our guide to the best time frame for intraday trading.
For swing trading, the default 14-period RSI on the daily chart is the standard configuration, with the weekly chart used for trend context.
How to Read the RSI Indicator
The RSI fluctuates between 0 and 100, but in practice it spends most of its time between roughly 30 and 70. Three patterns matter most.
Identifying Overbought and Oversold Conditions With the RSI
Readings above 70 are conventionally called overbought; readings below 30 are oversold. These labels can mislead beginners. In a strong uptrend the RSI can stay above 70 for weeks, and in a sharp downtrend it can stay below 30 for just as long. A reading at the extreme is a warning that momentum is stretched, not a buy or sell signal on its own. Treat it as a heads-up to look for a confirming pattern (a candle reversal, a divergence, or a return inside the range).
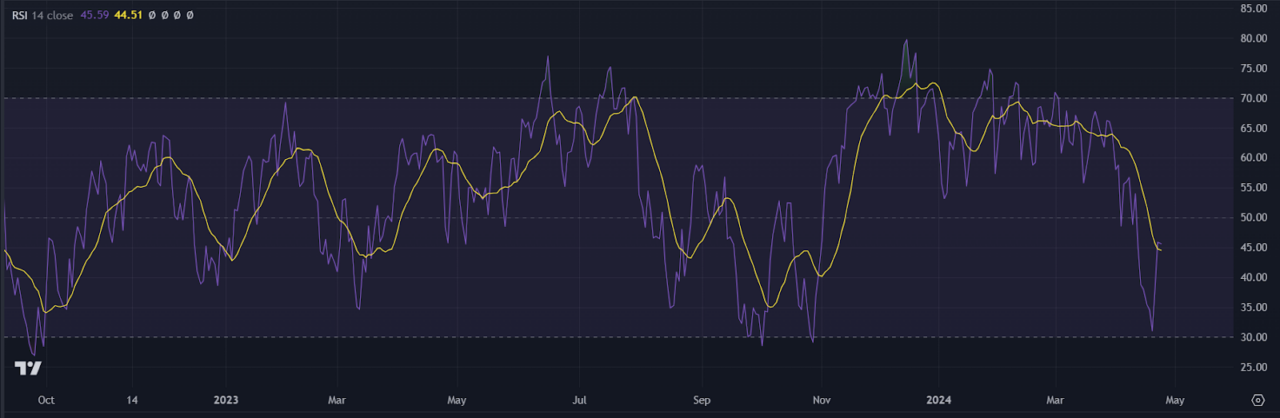
Using the RSI Moving Average (MA) on TradingView
The orange line that ships on top of the RSI by default is a moving average of the indicator. Two practical uses:
- The RSI crossing above its MA confirms upside momentum; the RSI crossing below confirms downside momentum.
- The MA filters whipsaws around the 50 midline. Wait for the RSI and its MA to both cross 50 before taking trend-direction trades.
For a deeper look at how moving averages are calculated and compared, see our TradingView moving average guide.
Combining the RSI With Other Indicators
The RSI carries more weight when it agrees with another non-correlated input. Common pairings:
When your chart gets crowded from layering RSI with other indicators, see our guide on how to remove indicators from your TradingView chart. It covers removing one at a time, clearing all at once, and hiding without losing your custom settings.
- RSI plus a volume profile zone for mean-reversion entries off institutional levels.
- RSI plus VWAP for intraday confirmation. Long when price reclaims VWAP and RSI crosses above its MA.
- RSI plus a Fibonacci retracement for swing entries off the 0.5 or 0.618 level confirmed by an RSI bounce out of oversold.
For a broader list of indicators that pair well with the RSI, see our list of the best TradingView indicators.
How to Trade RSI Divergence
Divergence is where the RSI delivers its highest-conviction signals, and it is the section most likely to push a 1,800-word competitor article ahead of an 800-word one. There are two forms.
Bullish Divergence
Price prints a lower low while the RSI prints a higher low. The interpretation: the most recent down-leg has weaker momentum than the previous one, and a reversal is more likely. Most traders wait for one of two confirmations before entering long: the RSI crossing back above 30, or the next candle closing above the previous swing high.
Bearish Divergence
Price prints a higher high while the RSI prints a lower high. Same logic in the opposite direction: the latest up-leg lacks the momentum of the prior one, and the next move is more likely down than up. Confirm with an RSI cross back below 70 or a close below the prior swing low.
Failure Swings (Higher-Conviction Divergence)
A failure swing happens when the RSI fails to push back into overbought (or oversold) territory on a retest of an extreme. It is a stricter version of divergence: the indicator itself confirms the rejection without needing a price-pattern overlay. Failure swings tend to fire less often but resolve cleanly when they do.
Setting RSI Alerts in TradingView
TradingView lets you set alerts on any indicator value, which means you can step away from the chart without missing an RSI signal. Right-click the RSI line and select Add Alert on RSI. The condition options that matter:
- Crossing Up at 30 (or 20 for a stricter reading): fires when RSI moves out of oversold.
- Crossing Down at 70 (or 80): fires when RSI moves out of overbought.
- Crossing the moving average: fires on the cross of the orange MA line.
For a deeper walkthrough of the alert system see our guide on setting alerts on TradingView.
Multi-Timeframe RSI Confirmation
A signal on a single chart is useful; a signal that aligns across two time frames is much stronger. Practical workflow:
- Pull up the daily chart and check whether the RSI is above 50 (uptrend bias) or below 50 (downtrend bias).
- Drop to the 1-hour or 4-hour chart and only take long entries when the higher timeframe RSI is above 50 and the lower timeframe RSI is bouncing out of oversold or crossing above its MA.
This filter alone removes most counter-trend trades, which are the lowest-probability use of the indicator.
Common RSI Mistakes (and How to Avoid Them)
The RSI is simple to read, which makes it easy to misuse. Three failure modes to watch for:
- Using RSI alone in a strong trend. Selling overbought in a strong uptrend is the classic beginner mistake. Always check the broader trend before treating an RSI extreme as a reversal signal.
- Ignoring the MA cross. The orange MA line on the RSI is not decoration. Crosses above and below it filter most of the choppy noise around 50.
- Skipping the journal. The fastest way to find the RSI period and the divergence pattern that actually works for your trading is to log every entry and tag it by setting. Without that record you will keep cycling through settings looking for one that feels right rather than one that has actually worked.
That last point is where structured journaling pays for itself. The Financial Tech Wiz Trading Journal lets you tag every trade with the indicator setup you used, then break out win rate and profit by symbol and hold duration so you can see which configuration is actually contributing to performance.
Get Your Free Trading Resources
Grab the free trading journal template plus the same tools we use to stay organized, consistent, and objective.
- Free trading journal template
- Custom indicators, watchlists, and scanners
- Access our free trading community
Enter your email below to get instant access.
No spam. Unsubscribe anytime.
FAQ
What is the best RSI setting on TradingView?
The default 14-period RSI is the best starting point because it balances sensitivity and noise filtering and is the version most institutional traders watch. From there, scalpers tend to drop to a 7 or 9 period for faster signals, and position traders sometimes raise it to 21 or 25 to smooth the line further. The right setting is the one your own journaled results say wins for the symbols and time frames you actually trade.
How do I add RSI divergence alerts on TradingView?
The built-in RSI does not include a divergence-detection condition in the standard alert dialog. The cleanest workaround is to add a community-built RSI Divergence indicator from the Indicators search (filter for Built-in or Community Scripts), then right-click the divergence indicator and add an alert on its built-in Bullish Divergence or Bearish Divergence condition. Several reliable scripts are free.
Can I use the same RSI strategy across stocks, crypto, and forex on TradingView?
The mechanics transfer (the math is the same), but the period and the overbought/oversold thresholds usually need adjustment. Crypto often runs hotter, so traders use 80/20 thresholds instead of 70/30 to filter the noise. Forex pairs with strong daily ranges respond well to a longer period (such as 21) to avoid whipsaws. Always backtest the setting before deploying live.
Is the RSI a leading or lagging indicator?
The RSI is technically lagging because it is calculated from past price data. In practice, divergence patterns and the failure-swing setup behave more like leading signals because they show momentum exhaustion before the price actually turns. Either way, treat the RSI as a piece of confirming evidence rather than a standalone trade trigger.
Get Your Free Trading Resources
Grab the free trading journal template plus the same tools we use to stay organized, consistent, and objective.
- Free trading journal template
- Custom indicators, watchlists, and scanners
- Access our free trading community
Enter your email below to get instant access.
No spam. Unsubscribe anytime.


