Fibonacci Retracement TradingView: Draw, Read, and Trade
Fibonacci retracement is the cleanest way to find where a pullback is likely to stop and the trend is likely to resume. The tool itself is one click on TradingView, but most traders draw it inconsistently, miss the levels that actually matter, and never tie the setup to a journal entry that proves whether their Fib reads work. This guide walks through the drawing rules, the levels that earn their keep, the golden pocket, and how to track Fib-based trades so your win rate at each level becomes a number you can actually look at.
Key Takeaways
- In an uptrend, draw Fibonacci from swing low to swing high; in a downtrend, draw from swing high to swing low. The 38.2%, 50%, 61.8%, and 78.6% levels are the ones traders actually watch.
- The “golden pocket” between 61.8% and 78.6% is where the highest-probability trend-continuation entries cluster, especially when it overlaps a moving average or a prior support/resistance level.
- Fibonacci is a confluence tool, not a signal generator. Track every Fib-based trade by the level you entered at to see which retracement depths actually pay you.
Track every Fib trade
Financial Tech Wiz Trading Journal
Log your entry retracement (38.2, 50, 61.8, golden pocket), tag the setup, and pull win rate by Fib level after 30+ trades. AI insights, performance analytics, and 25+ broker auto-imports.
Try the Trading JournalWhat Fibonacci Retracement Actually Measures
Fibonacci retracement levels are horizontal lines drawn between two extreme points on a chart, marking the percentages of that move where price commonly pauses, reverses, or continues. The math comes from the Fibonacci sequence (the ratios 0.236, 0.382, 0.618, and 0.786 are derived from dividing numbers in the sequence by their neighbors). The 50% level isn’t a true Fibonacci ratio, but it sits at the midpoint of any move and traders treat it like one because price reacts there often.
The standard levels you’ll see on TradingView are:
- 23.6% (shallow pullback, used in strong trends)
- 38.2% (first meaningful retracement)
- 50% (psychological midpoint, not a true Fib ratio)
- 61.8% (the golden ratio, deepest pullback that usually still respects the trend)
- 78.6% (last-stop retracement before a trend is invalidated)
Anything past 78.6% on a clean swing usually means the trend that produced the move is breaking down.
How to Draw Fibonacci Retracement on TradingView (Step by Step)
Step 1: Identify the Trend Direction
Before clicking the tool, decide whether you’re looking at an uptrend (higher highs and higher lows) or a downtrend (lower highs and lower lows). The drawing direction depends on it:
- Uptrend: draw from the swing low up to the swing high
- Downtrend: draw from the swing high down to the swing low
If you can’t classify the trend in 5 seconds of looking, the chart probably isn’t ready for a Fibonacci read.
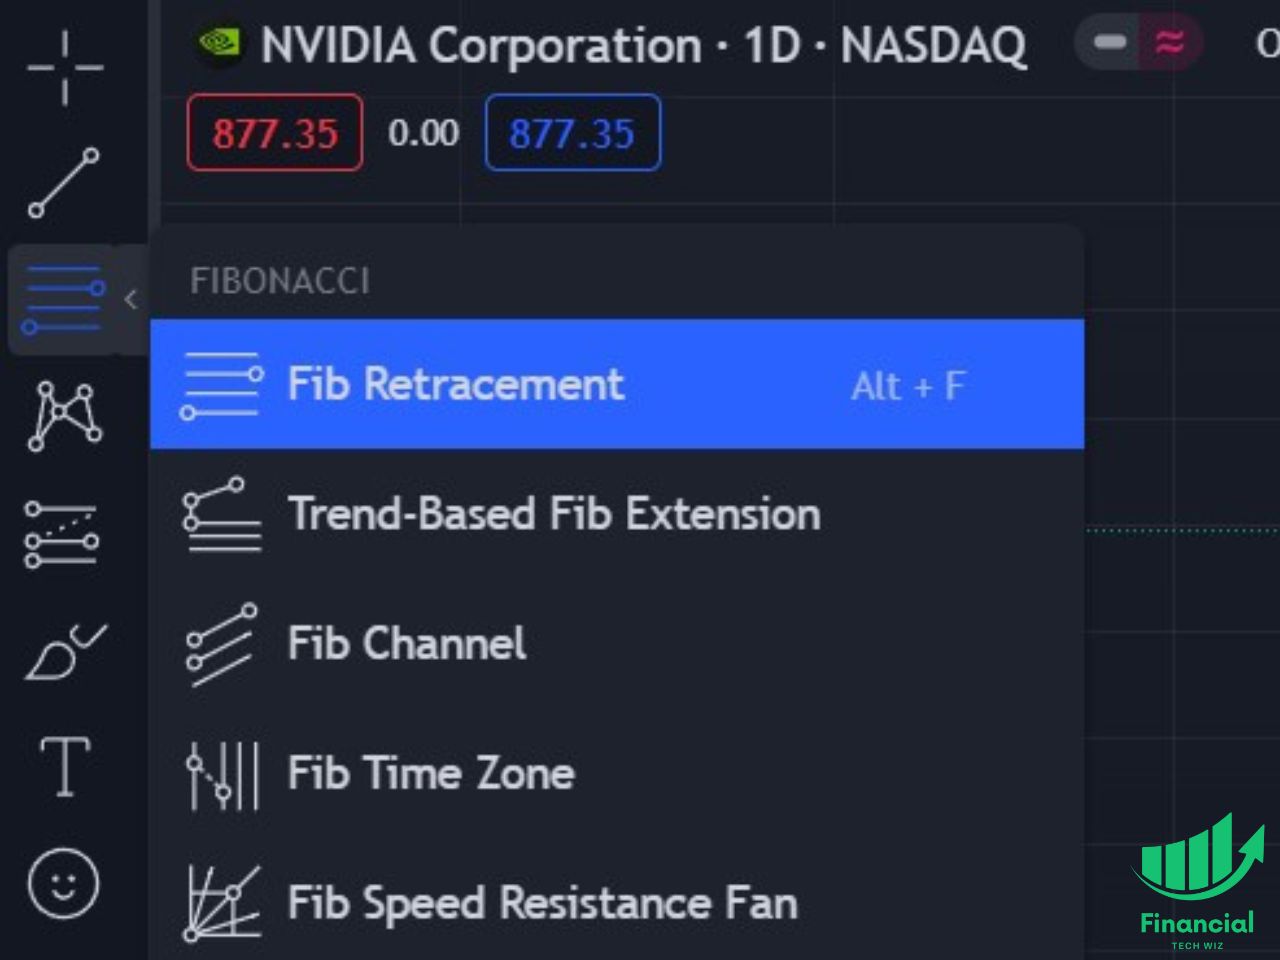
Step 2: Open the Fibonacci Retracement Tool
On the left toolbar, click the Gann and Fibonacci Tools icon, then select Fib Retracement. On mobile, the toolbar lives at the top.
Step 3: Click Swing Low to Swing High (or Swing High to Swing Low)
Click the first extreme on the chart, then drag to the second extreme. TradingView fills in the levels automatically between the two points.
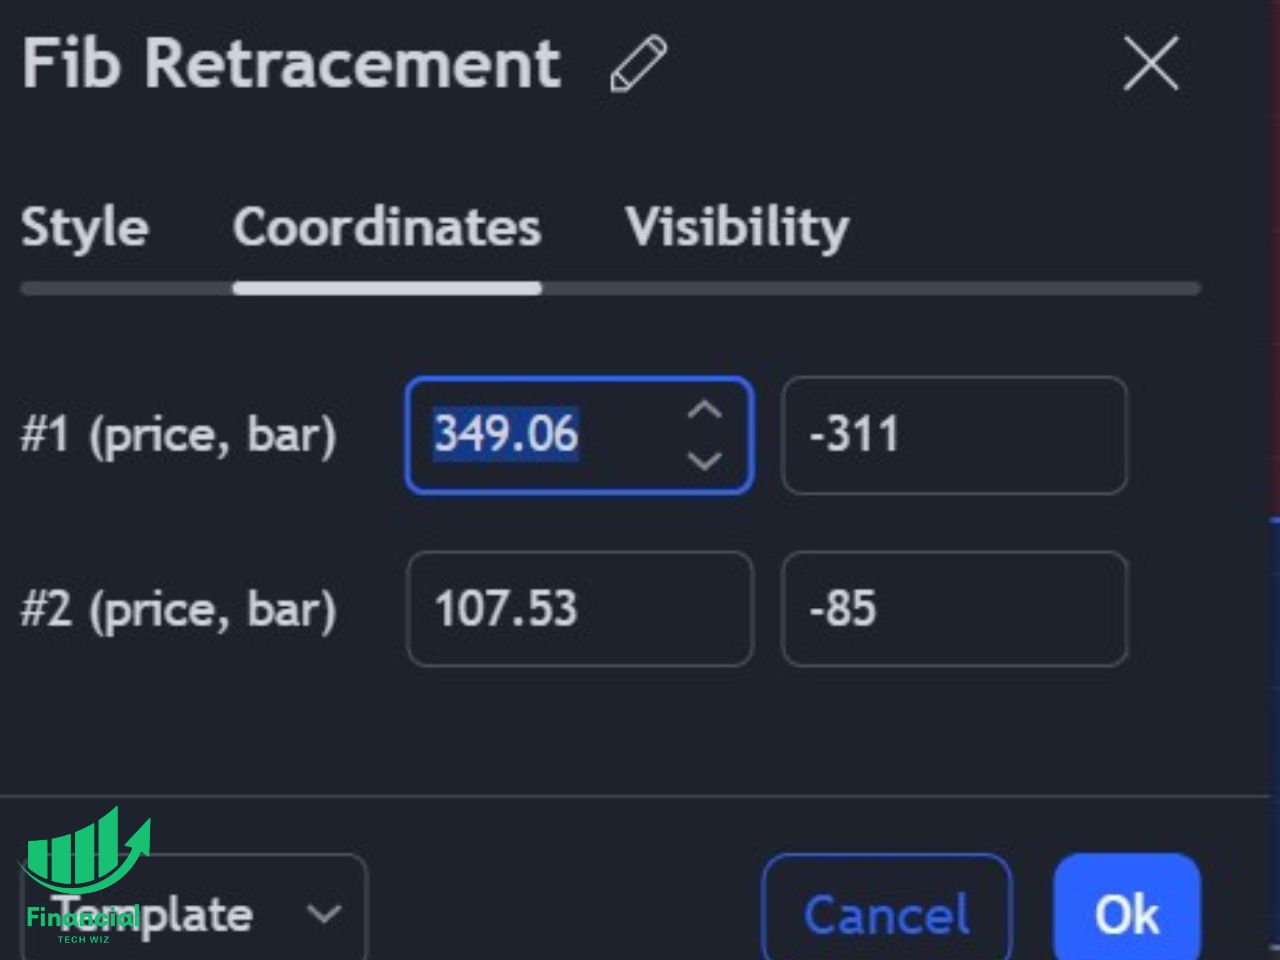
Step 4: Customize Settings (Optional)
Right-click any line on the drawn Fibonacci and choose Settings. From there you can adjust Coordinates (snap to exact highs and lows), Levels (turn extension levels on or off), Style (line color, weight, and label position), and Reverse (flips the percentages so 0% sits at the opposite end; most traders leave this off).

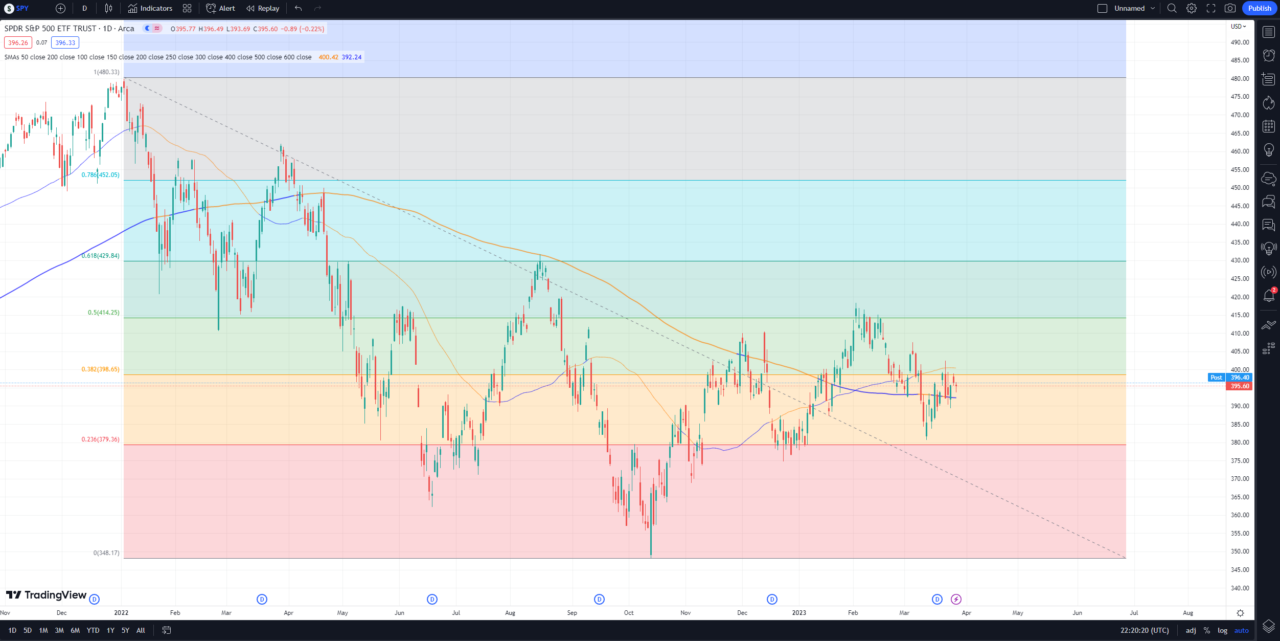
Drawing Direction in Uptrends vs Downtrends
In an uptrend, you’re measuring how far price has pulled back from a recent high. Click the swing low first, then the swing high. The 0% line sits at the high, the 100% line at the low, and the percentages fill in between. Pullbacks are measured top-down: a 38.2% retracement is shallow, a 78.6% is deep.
In a downtrend, the order flips. Click the swing high first, then the swing low. The 0% line sits at the low, the 100% line at the high. Bounces are measured bottom-up: 38.2% is a small bounce, 61.8% is a strong counter-trend rally that usually fails near the level.
The rule of thumb: 0% always sits at the most recent extreme. If price keeps going past 100% without holding any retracement, the swing you used is no longer the dominant move and you need to redraw against a larger one.
Wick-to-Wick or Close-to-Close: Pick One and Stick With It
Two valid drawing methods exist and they produce slightly different levels.
- Wick-to-wick: anchor the tool to the absolute highest and lowest wicks of the swing. Captures the full range, including spikes.
- Close-to-close: anchor to the closing prices of the swing-high and swing-low candles. Filters out spike noise but ignores wick reactions.
There’s no “correct” choice, but consistency matters. If you mix methods between charts, your Fib levels will sit at slightly different prices and your win rate by level becomes uninterpretable. Pick one method, document it (a journal note works), and use it on every chart.
I default to wick-to-wick on liquid daily charts (S&P 500, large-cap stocks) and close-to-close on lower time frames where single-candle spikes are common. Either is defensible.
Free starter tool
Want to start tracking Fib levels by hand before you commit to an app? Grab the free Google Sheets trading journal template, add a “Fib Level Entered” column, and you’ll have win-rate-by-level inside 30 trades.
Get the free templateThe Levels That Actually Matter (and the Golden Pocket)
Not all Fibonacci levels carry equal weight in real charts.
- 23.6%: shallow pullback. Useful only in very strong trends where any retracement is rare. Tradeable rarely; mostly a “trend strength” indicator.
- 38.2%: first level traders watch. Common entry zone for trend-continuation in clean trends.
- 50%: psychological midpoint, no true Fib ratio, but price reacts here so often that ignoring it costs you.
- 61.8%: the golden ratio. Strongest single-level reaction zone. If 61.8% holds, the original trend is intact in the majority of clean cases.
- 78.6%: last-stop level. If price hits 78.6% and bounces, you can still trade with the trend; if it breaks, the swing is invalidated.
The golden pocket sits between 61.8% and 78.6%. This zone gets disproportionate attention from crypto and forex traders for two reasons: it’s the deepest you can go and still call the trend intact, and it overlaps with key moving averages (50-period and 200-period on lower time frames) more often than chance would predict.
Combine the golden pocket with another tool (a moving average, a prior horizontal support level, or an RSI reading below 30 in an uptrend pullback) and you have a high-confluence entry zone. That’s how I personally screen for Fib trades.
Choosing the Right Time Frame
The Fibonacci retracement tool works on every time frame TradingView offers, but the time frame you draw on dictates the holding period the levels will respect.
- Daily and weekly charts: Fib levels here can hold for weeks or months. Best for swing traders and position traders.
- 4-hour and 1-hour charts: levels typically respected for 1 to 5 trading days. Good middle ground for day-and-swing hybrids.
- 15-minute and 5-minute charts: levels respected for hours, not days. Useful for intraday entries within a higher-time-frame setup.
- 1-minute charts: levels become noise. The signal-to-noise ratio is poor, and most reactions look like Fib reactions even when they aren’t.
The general rule: draw your dominant Fib on the daily or 4-hour chart to identify the trade idea, then drop to the 15-minute or 1-hour to time the actual entry. See best time frames for intraday trading for a fuller breakdown.
Using Fibonacci for Entry, Stop, and Target Placement
Entry: place a limit order at the Fib level you’re targeting (38.2, 50, 61.8, or the golden pocket). Don’t market-buy on a candle that’s still inside the level; let price come to you.
Stop loss: place the stop a few ticks below the next Fib level down (or above, in a downtrend). For a 50% entry, the stop sits below 61.8%. For a 61.8% entry, the stop sits below 78.6%. If 78.6% breaks, the trend is dead and you don’t want to be in the trade anyway.
Target: project the move with Fibonacci extensions (the 161.8%, 261.8%, and 361.8% levels). The simplest scaled exit is one-third at the prior swing high (the 0% line on your retracement), one-third at 161.8%, and one-third trailed past 261.8%.
Document every entry by Fib level, hold time, and exit. After 20 to 30 Fib trades, you’ll see which level your edge actually lives at. For most traders, it’s the golden pocket plus a confluence factor; for some it’s clean 50% retracements in trending tickers.
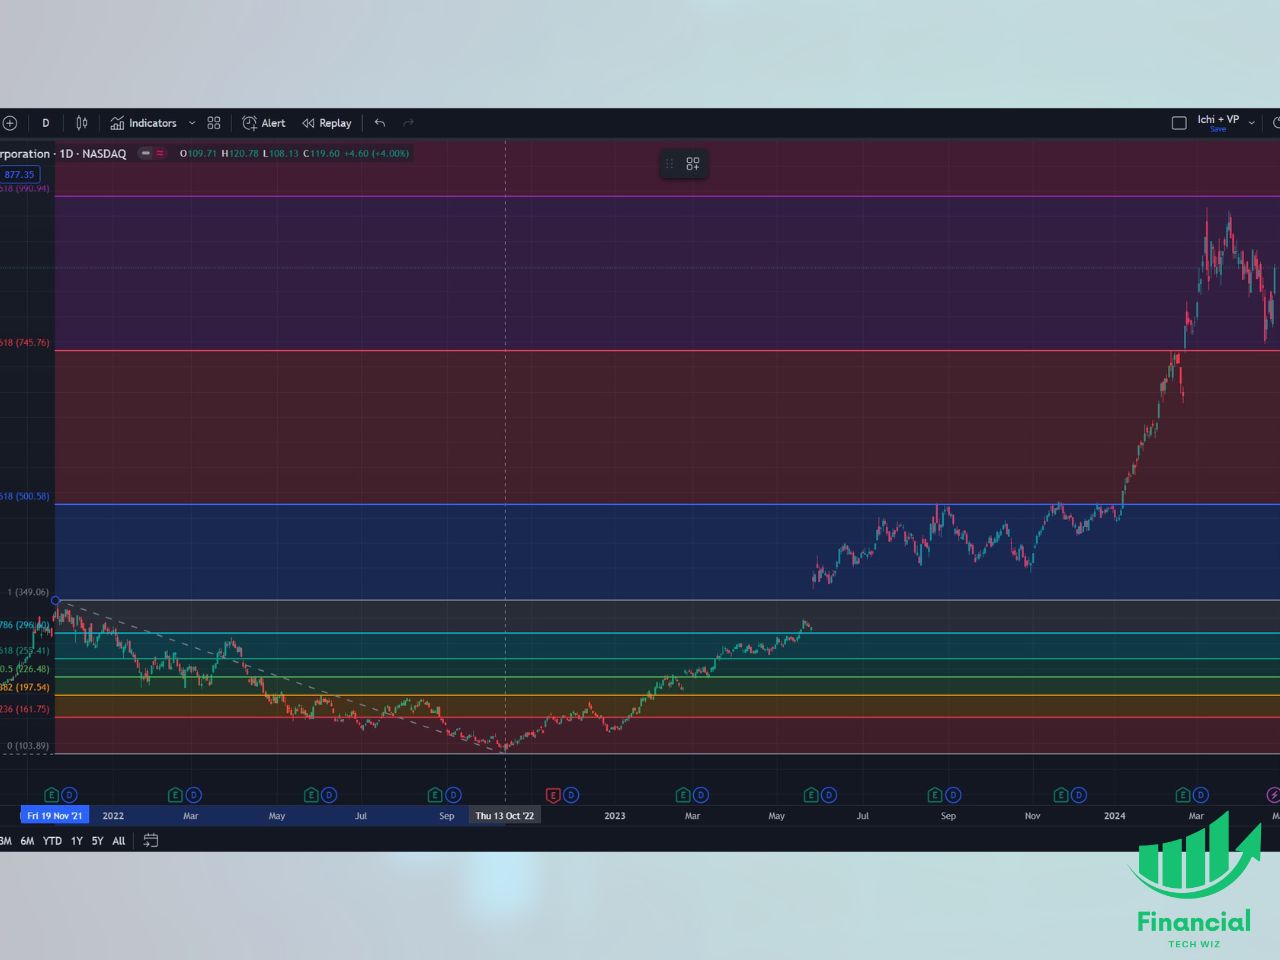
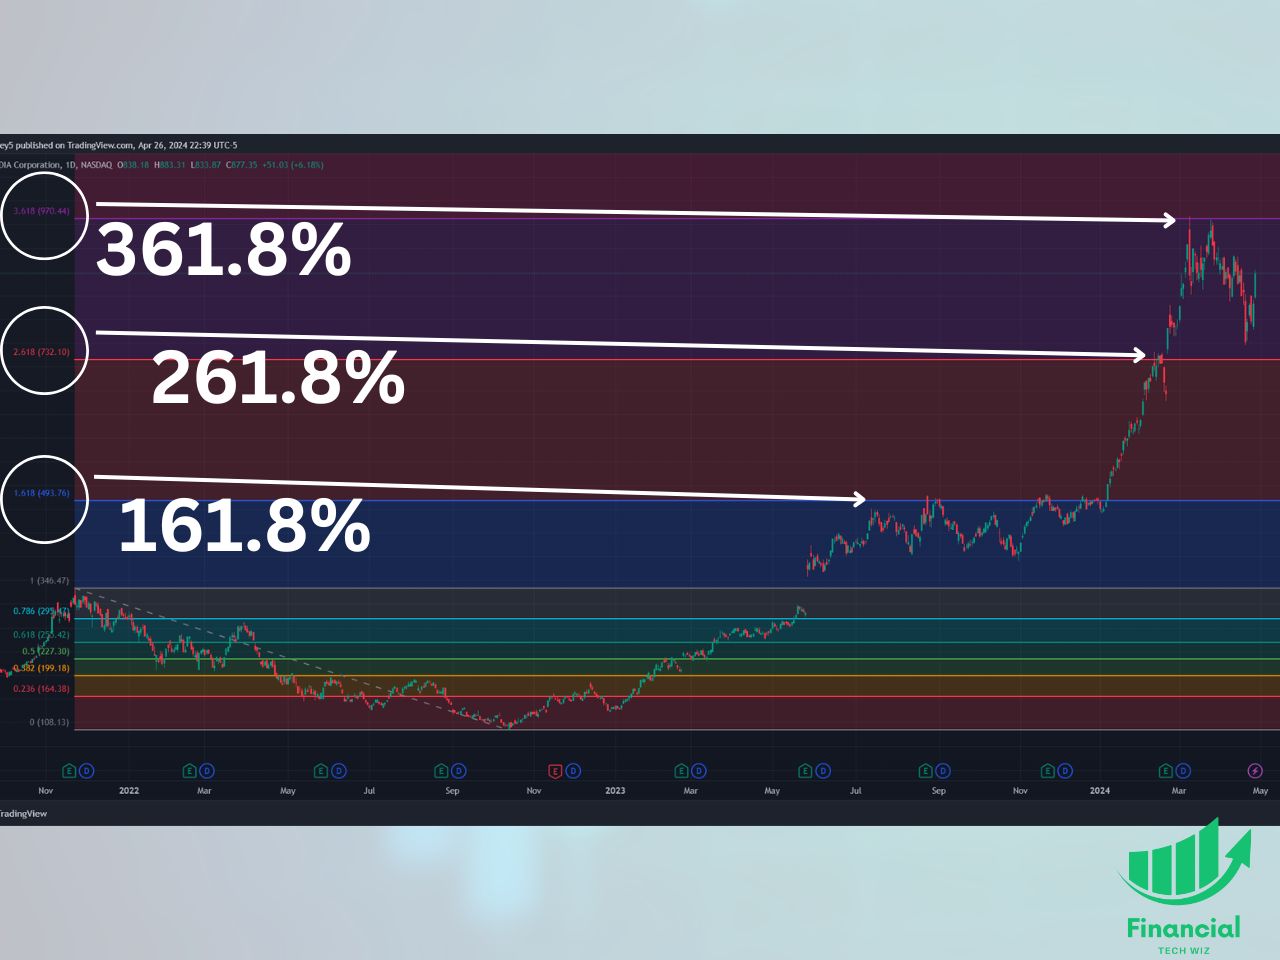
The NVDA Example (Real Levels, Real Reactions)
The NVDA daily chart from 2021 high to 2022 low gives a clean illustration of how Fibonacci extension levels can mark forward price targets. Drawing from the 2021 high to the 2022 low, the 161.8% extension projected a level that NVDA reacted to multiple times on the way back up, followed by 261.8% and 361.8% reactions in 2024.
None of these levels were drawn with hindsight: the swing endpoints existed before the extensions printed. The lesson isn’t that Fibonacci predicts the future. It’s that, on liquid, widely-watched assets, enough traders place orders at extension levels that the levels become self-fulfilling support and resistance.
The Auto Fibonacci Retracement Indicator
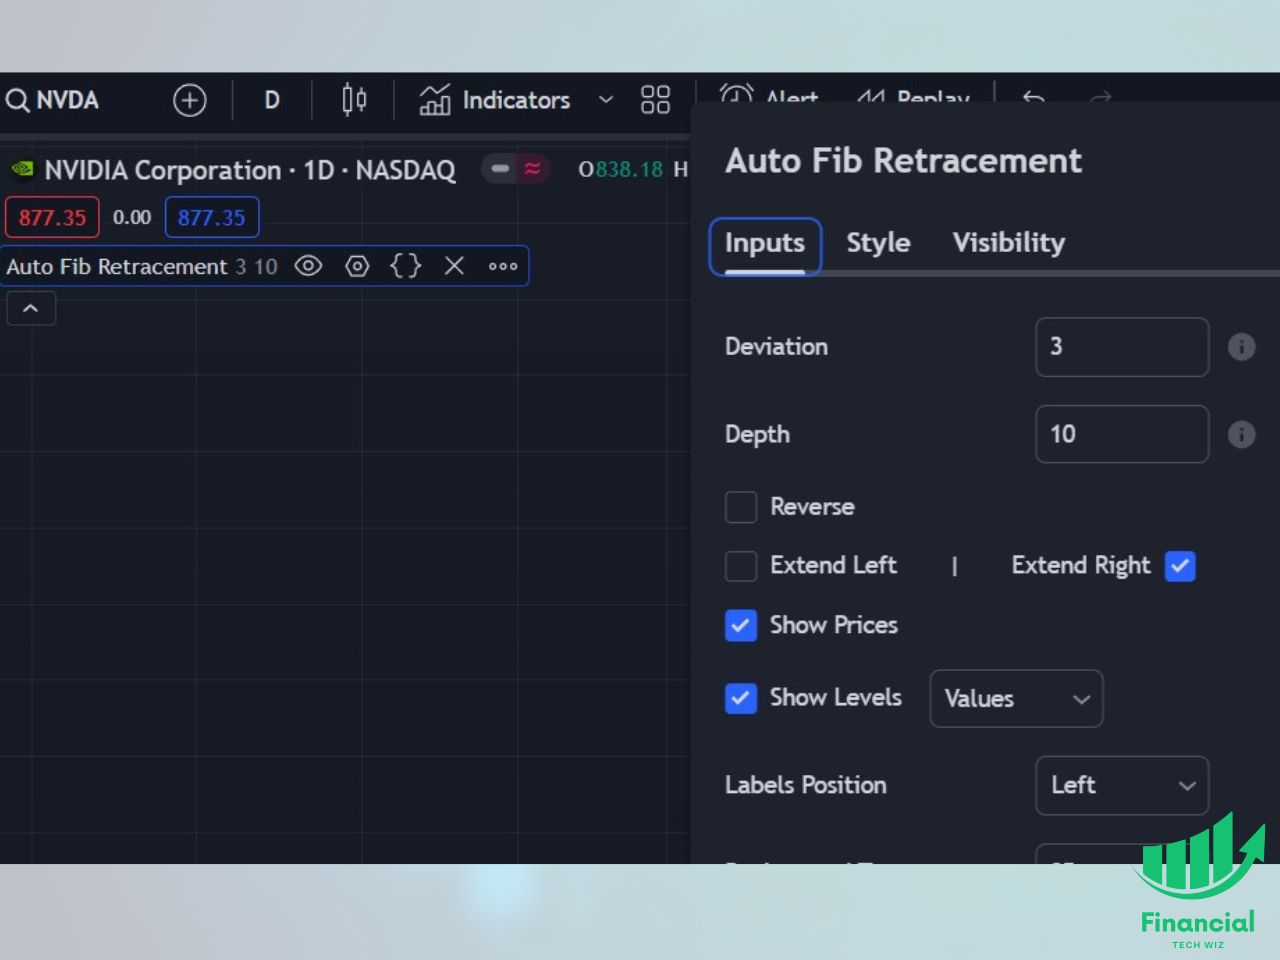
TradingView ships an Auto Fib Retracement indicator that picks the swing endpoints algorithmically and redraws the levels as you switch time frames. It’s most useful for traders who switch between 1-hour and daily charts often. Three settings matter: Deviation (how strict the algorithm is about identifying a swing point, 1 to 3 is the practical range), Depth (how far back the algorithm looks for the first pivot), and Extend Left/Right (extends the level lines visually, cosmetic).
Auto Fib is good for screening, not for execution. When you’ve identified a setup, redraw manually so the levels match your intended swing.
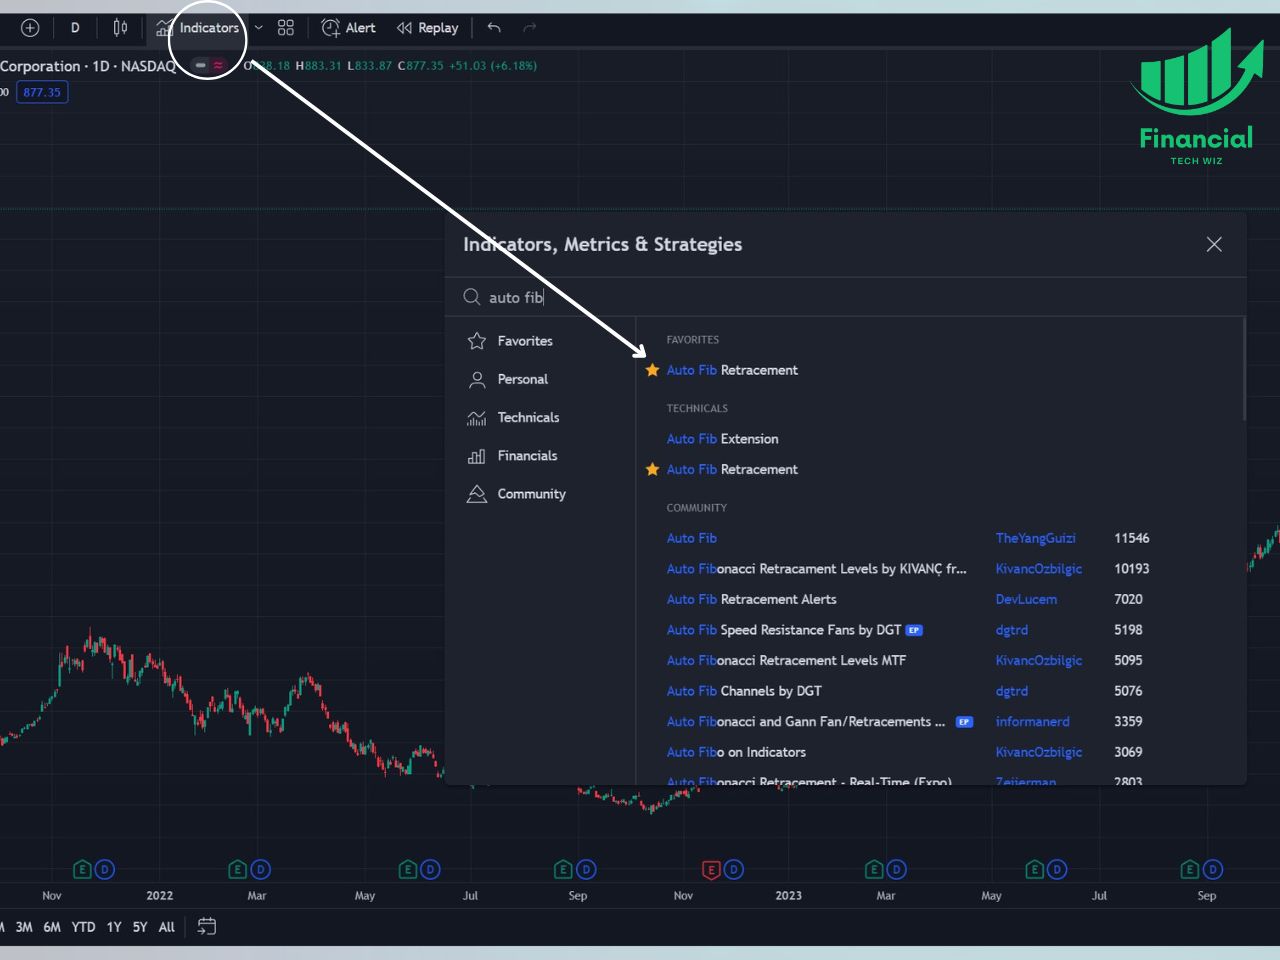
How to Add the Auto Fibonacci Tool to Your TradingView Chart
1. Open any chart on TradingView
2. Click on Indicators at the top of the chart
3. Type “Auto Fib Retracement” and click on it from the list of indicators
Adjusting the Auto Fibonacci Retracement Settings
Here is how to adjust the settings of the auto Fibonacci retracement tool on TradingView:
1. Hover over the indicator name at the top left of the chart
2. Click on the gear icon to open settings
TradingView Limited Time Offer!
Exclusive Deal: 30-Day FREE Premium Access + Bonus Credit
Don’t Miss Out – Sign up for TradingView Now!
- Advanced Charts
- Real-Time Data
- Track all Markets
Common Mistakes Traders Make With Fibonacci on TradingView
- Drawing on the wrong swing. If price has already broken your 100% line, the swing isn’t the dominant move anymore. Redraw against a higher-time-frame swing.
- Mixing wick-to-wick and close-to-close on the same chart. Your levels will be slightly different every time and your win-rate-by-level data becomes useless.
- Treating Fib as a signal generator. A price tag at 61.8% isn’t a buy. A price tag at 61.8% with a moving-average overlap, a clean reversal candle, and an RSI extreme is a buy.
- Forgetting to redraw. After every meaningful swing, the dominant Fib changes. Set a habit: end of session, redraw the daily Fib if the chart printed a new swing.
- Hindsight bias. If you only draw the Fib that “would have worked,” you’re memorializing winners and ignoring the same setup when it failed. Drawing live and journaling matters.
Tracking Fibonacci Trades in a Journal
Fibonacci is a confluence tool, which means the only way to know whether your edge is real is to log every Fib-based trade with the same metadata: which level you entered at, which other tools confirmed it, the time frame, the hold duration, and the result. After 20 to 30 trades, you’ll see a real distribution.
Most traders find that their win rate is highest at the 61.8% level (or in the golden pocket) when at least one other tool confirms the entry, and falls off above and below that band. A few traders’ edges sit at 38.2% in trending markets. You won’t know which camp you’re in until you log it.
The Financial Tech Wiz Trading Journal lets you tag trades by setup, attach notes, and pull P&L and win rate by symbol and hold duration. The simpler starting point is the free Google Sheets trading journal template: add a “Fib Level Entered” column to the template, log every trade, and you’ll have win-rate-by-level after a month.
Combining Fibonacci with Other Indicators
Fibonacci levels work best as a confluence factor, not in isolation. The combinations that consistently produce the cleanest setups:
- Moving averages (SMA, EMA): when the 50-period or 200-period MA overlaps a Fib level, the level is mechanically more likely to hold. Algorithmic flow at MAs creates the same buy pressure that Fib does, so the two reinforce each other.
- Relative Strength Index (RSI): an RSI below 30 (oversold) at a 61.8% retracement in an uptrend is the classic counter-trend bounce setup. Inverse for shorts.
- Anchored VWAP: institutional traders watch anchored VWAP. When VWAP from a meaningful event (earnings, an index rebalance) aligns with a Fib level, the level usually holds.
- Prior horizontal support and resistance: this is the highest-conviction overlap. If 61.8% sits at a level price has already respected three times in the last six months, that’s the trade.
The general rule: one tool is a guess, two tools is a setup, three tools is a high-conviction trade.
FAQ
What are the most important Fibonacci retracement levels on TradingView?
The 38.2%, 50%, 61.8%, and 78.6% levels are the ones traders watch in practice. The 23.6% level rarely matters except in unusually strong trends. The 50% level isn’t a true Fibonacci ratio (it’s the midpoint), but price reacts there so often that traders treat it like one.
How do I draw Fibonacci retracement in an uptrend on TradingView?
In an uptrend, click the swing low first and drag up to the swing high. The 0% line will sit at the high and the 100% line at the low. Pullbacks from the high are then measured by the percentages between them, with 38.2%, 50%, 61.8%, and 78.6% being the levels most likely to provide support.
What is the golden pocket in Fibonacci retracement?
The golden pocket is the zone between the 61.8% and 78.6% retracement levels. Crypto and forex traders watch it especially closely because it’s the deepest a pullback can go without invalidating the trend, and it often overlaps with the 50-period and 200-period moving averages, creating high-confluence entries.
Should I use wick-to-wick or close-to-close to draw Fibonacci?
Both are valid. Wick-to-wick anchors the tool to the absolute highest and lowest wicks of the swing; close-to-close anchors to the closing prices of those candles. The choice matters less than consistency: if you mix methods, your levels will sit at slightly different prices on different charts and your trade-by-level data becomes uninterpretable.
Does TradingView have an auto Fibonacci retracement tool?
Yes. TradingView ships an Auto Fib Retracement indicator that picks swing endpoints algorithmically and redraws the levels when you switch time frames. It’s useful for screening but less reliable than a manual draw for execution, because the algorithm can pick swings that don’t match the trade you’re trying to set up.
Fibonacci Retracement TradingView | Bottom Line
The Fibonacci retracement tool on TradingView is an excellent way to determine support and resistance levels, view breakout price targets, and provide context for use with other indicators. You can also use the auto Fibonacci tool to automatically pick the two points for you.
The tool is completely free to use on TradingView. All you need to do is sign up for a free account to start drawing Fibonacci levels on any asset.
Before you go
If you want to keep educating yourself about trading, you must check out these posts as well:
What is the Most Successful Options Strategy
Options Trading for Income: The Complete Guide
Mark Minervini’s Trading Strategy: 8 Key Takeaways
The Best Options Trading Books
The Best Laptops and Computers for Trading
How to Get a TradingView Free Trial
The Best TradingView Indicators
Get Your Free Trading Resources
Grab the free trading journal template plus the same tools we use to stay organized, consistent, and objective.
- Free trading journal template
- Custom indicators, watchlists, and scanners
- Access our free trading community
Enter your email below to get instant access.
No spam. Unsubscribe anytime.


