
VWAP on TradingView: Settings, Strategy, and Anchored VWAP (2026)

VWAP is the line institutional desks use to benchmark execution, and on TradingView it is one of the most powerful intraday tools you can plot for free. This guide covers default settings, anchored VWAP, standard deviation bands, three setups worth tracking, and the journaling workflow that separates a setup from a guess.
VWAP scales across every chart speed but the entry signal you read off it depends on what time frame to use for your strategy.
Key Takeaways
- Default session VWAP is the right tool for intraday execution context; anchored VWAP is the right tool for swing context tied to a real event like earnings or a session high.
- Treat the standard deviation bands as zones of interest, not hard reversal lines: fade band 2 only with a candle confirmation in a balanced market, never in a clean trend.
- VWAP edge only compounds when you log every setup, so tag pullbacks, band fades, and AVWAP entries in a journal and read win rate by setup type, not by aggregate.
Recommended Tool
Financial Tech Wiz Trading Journal
Tag VWAP pullbacks, band-2 fades, and anchored VWAP setups, then read win rate, hold duration, and P&L by setup type. Starting at $9.91/month billed annually.
Try It Free
Understanding VWAP and Why Traders Use It
VWAP stands for Volume Weighted Average Price. The formula divides the cumulative dollar volume traded by the cumulative share volume across the session, which gives a single line that reflects where the average dollar of volume has actually changed hands so far that day. For the basics of reading raw volume bars on TradingView before layering in VWAP, see our guide to the TradingView volume indicator.
That definition matters because VWAP started as an institutional benchmark, not a retail signal. When a pension fund or mutual fund needs to scale into a position over the course of a day, the trader executing that order is graded on whether their average fill came in above or below VWAP. Buying below VWAP means the desk paid less than the day’s volume-weighted average. Selling above VWAP means the desk got out at a better price than the average participant.
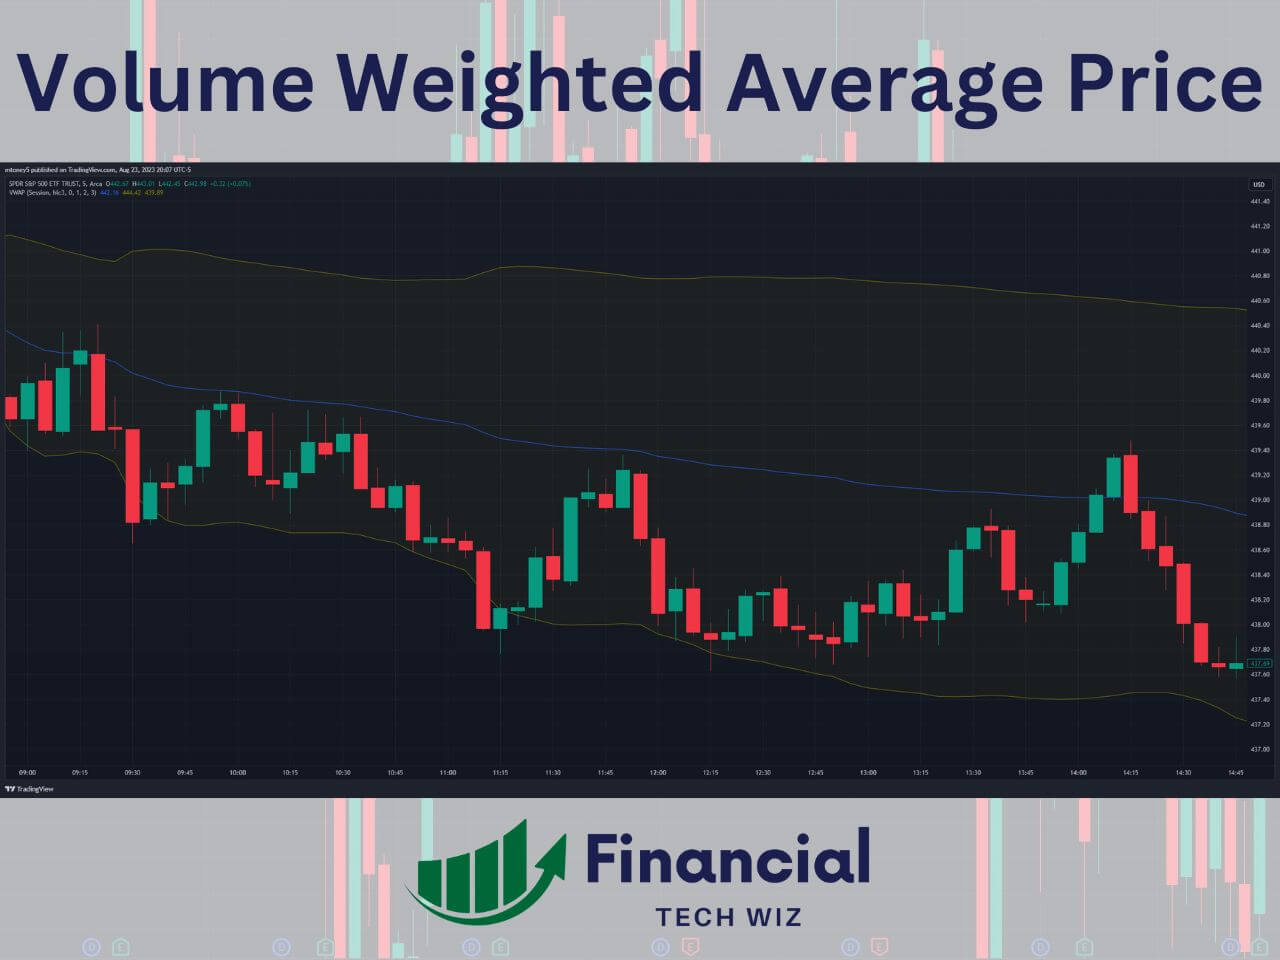
For retail traders, that institutional context is the entire reason the line is useful. Above VWAP, the average participant who has bought today is in profit, which biases the tape toward continuation. Below VWAP, the average participant is underwater, which biases the tape toward selling pressure on rips. VWAP is not a magic level, it is a running scoreboard for who currently has the better average price, buyers or sellers.
How to Add VWAP on a TradingView Chart
Adding session VWAP takes three clicks. Open any chart, click the Indicators icon at the top of the toolbar, type “VWAP” into the search box, and select Volume Weighted Average Price from the results. The indicator drops onto the chart as a line that resets at the start of every session.
VWAP itself is included on every TradingView plan, including the free tier, so you do not need to upgrade to use it. Paid plans only matter if you want more saved layouts, more indicator slots per chart, or extended-hours data; the full breakdown lives in the TradingView pricing post. If you do not have an account yet, you can grab a free TradingView account and have VWAP plotted in under a minute.
If the platform is new to you, the TradingView tutorial walks through chart setup, watchlists, and layouts before you start layering indicators on top. Get the chart configured the way you trade first, then add VWAP last so it sits on top of price.
VWAP Settings Worth Changing
Most TradingView users never open the VWAP settings panel, which is a missed opportunity. Right-click the VWAP line and choose Settings to reveal the inputs.
- Anchor: Session by default. Switch to Week, Month, Quarter, Year, Decade, Earnings, Dividends, or Splits when your strategy spans more than one session.
- Source: hlc3 by default (the average of high, low, and close). Leave it alone unless you have a specific reason to switch to a different price input.
- Bands Multiplier 1, 2, 3: standard deviation envelopes around the VWAP line. Enable all three to see compression versus expansion at a glance.
- Style: line color, thickness, and band fill. Bump the line thickness up so VWAP reads cleanly behind candles.
Reading VWAP on the Chart
The simplest read is location: price above VWAP means intraday buyers are in control, price below means sellers are in control. The more useful read is interaction. When price pulls back to VWAP and holds, the line is acting as dynamic support in an uptrend or dynamic resistance in a downtrend, and the first reaction off VWAP is often the highest probability entry of the day.
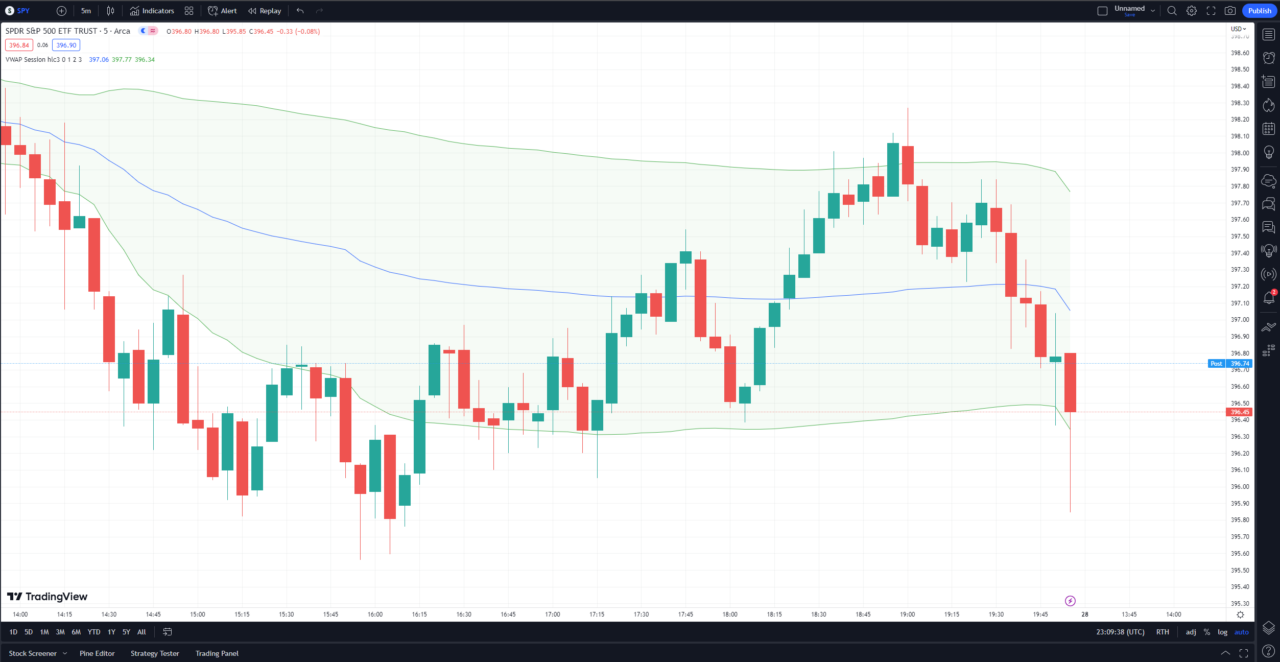
The bands behave differently depending on context. In a trend day with price riding above VWAP all session, a tag of band 2 is usually a continuation signal, not a fade: the trend is strong enough to push two standard deviations above the average. In a balanced or range-bound session, the same band-2 tag is a mean-reversion zone where a rejection candle gives you a setup back to VWAP itself. The same level means two opposite things depending on whether the day is trending or balanced, which is why context matters more than the band touch.
Anchored VWAP, When the Default Is Not Enough
Anchored VWAP (AVWAP) is the same volume-weighted formula, but instead of resetting at the session open it starts from a candle you choose. That makes it the right tool for any swing context tied to a specific event: an earnings release, a Fed announcement, a prior swing high or low, the IPO date, or a major gap day.
On TradingView, AVWAP lives in the drawing toolbar (the left-hand vertical bar), not the Indicators menu. Click the toolbar, scroll to Prediction and Measurement Tools, and select Anchored VWAP. Click any candle on the chart to set the anchor and TradingView calculates the volume-weighted average price from that candle forward.
Two use cases that earn their place on most charts. First, anchor AVWAP to the most recent earnings candle to get a swing-trading line that reflects every dollar traded since the latest fundamental catalyst. If price has held above that AVWAP for weeks, the post-earnings narrative is still bullish; the first deep test of the AVWAP from above is often a high-quality swing entry. Second, anchor AVWAP to the session high or low on the day a reversal sets up. The intraday AVWAP from the session high acts as a dynamic resistance line for the rest of the session, and the first failure to reclaim it is a continuation entry to the downside.
Anchored VWAP is the highest-leverage feature most retail VWAP users ignore, because it requires you to pick the anchor instead of letting the indicator pick one for you. The anchor is the entire point. For strategies, platform setup, and anchoring examples across stocks and swing trades, see the complete anchored VWAP guide.
Standard Deviation Bands and Mean-Reversion Zones
The 1, 2, and 3 sigma bands plotted around VWAP measure how far price has stretched from the volume-weighted average. About 68% of session price action sits inside band 1, around 95% sits inside band 2, and roughly 99.7% sits inside band 3 in a normal-distribution sense. In trading terms, band 2 is the level where a session’s typical noise gives way to extension, and band 3 is the level where extension gives way to extreme.
Read the bands as zones, not as lines. When the bands compress (the distance between band 1 and band 2 narrows), volatility is contracting and price is consolidating. Mean-reversion fades to VWAP work well in those conditions. When the bands expand (the distance widens rapidly), volatility is exploding and the day is trending. Fading band 2 in that environment is the fastest way to fund someone else’s account.
Pair every band-2 setup with a candle confirmation: a rejection wick, a bearish or bullish engulfing candle, or a clear failure to push further. Without a confirmation candle, the band touch is just a number on a chart.
VWAP vs Moving Averages
VWAP and moving averages get conflated, but they answer different questions. A 20-period EMA on a 5-minute chart smooths recent price action across an arbitrary lookback, regardless of how much volume traded at each price. VWAP weights every print by the dollar volume that traded at that price, which is why it lines up with where institutional fills actually happened.
The decision rule is simple. Use VWAP for intraday execution, intraday mean-reversion, and any context where you care about where institutional flow has been transacting today. Use a 20 EMA or 50 SMA for trend confirmation across multiple sessions, especially on swing timeframes where VWAP would reset every day. The two are complementary, not competitive: VWAP for today’s fight, the moving average for the week’s direction. VWAP also pairs well with momentum oscillators, and the RSI on TradingView guide covers a complementary read on overextension. For traders working with price distributions, market profile adds a time-based view of where acceptance happened across the session, making it a natural companion to VWAP when mapping where institutional flow actually transacted.
Three VWAP Strategies That Hold Up
Three named setups worth journaling, each with explicit entry, invalidation, and target rules.
1. VWAP Pullback in a Trending Market. Price has held above VWAP for the entire session and the bands are expanding (trend day). Wait for the first pullback to VWAP. Enter long on the first reaction candle off VWAP (a hammer, a bullish engulfing, or a clear rejection wick). Invalidate below the prior swing low or below VWAP minus a small buffer, whichever is tighter. Target band 2 above. The setup has the best risk-to-reward on the first VWAP pullback of the day, weakens on the second, and is usually invalid by the third.
2. VWAP Mean Reversion at Band 2. The session is balanced, the bands are compressing, and price tags band 2 with a clear rejection candle (long wick, opposite-color engulfing, or a doji that fails to push further). Enter against the move on the close of the rejection candle. Invalidate past the high or low of the rejection candle. Target VWAP. This setup explicitly does not work on trend days, and the band-compression context is the filter that keeps you out of the trap.
3. Anchored VWAP From Earnings as a Swing Line. Drop AVWAP at the most recent earnings candle. If price has spent weeks holding above the AVWAP, that line is the swing-trade equivalent of intraday VWAP. Enter on a hold-and-bounce of the AVWAP from above, after a clean test and a reclaim candle on the daily timeframe. Invalidate on a daily close below the AVWAP. Target the next resistance, the prior swing high, or a measured move depending on the chart. This setup converts a quarterly fundamental event into a tradable technical line.
Common VWAP Mistakes
- Using session VWAP on a daily chart. The session anchor resets at the open, so on a daily chart it just plots that day’s evolving average and tells you nothing useful. For daily-chart use cases, switch the Anchor input to Week, Month, or Quarter, or use Anchored VWAP tied to a specific event.
- Fading every band-2 touch in a trend day. In a strong trend, band 2 is a continuation signal. The fade is the wrong-way trade.
- Ignoring volume context. VWAP without volume context is just a line. Always check whether the session has built real volume around the VWAP zone or whether price is drifting on thin tape.
- Treating VWAP as a hard reversal level. VWAP is a zone of interest, not a stop-loss line. Pair every interaction with a confirmation candle before acting.
Tracking VWAP Setups With a Trading Journal
The fastest way to stop overtrading VWAP is to log every entry by setup type and read your own results. Tag VWAP pullback, band-2 mean reversion, and AVWAP-from-earnings as three separate setup tags inside the Financial Tech Wiz Trading Journal and the analytics will surface win rate, average hold duration, and P&L by setup. Most traders discover that one of the three setups carries their account and the other two are net flat or slightly negative, which is the entire point of measuring instead of guessing.
If you are not ready to subscribe, the free template below will get you the same setup-tagging discipline at zero cost.
Get Your Free Trading Resources
Grab the free trading journal template plus the same tools we use to stay organized, consistent, and objective.
- Free trading journal template
- Custom indicators, watchlists, and scanners
- Access our free trading community
Enter your email below to get instant access.
No spam. Unsubscribe anytime.
Frequently Asked Questions
Is VWAP free in TradingView?
Yes. The default Volume Weighted Average Price indicator is included on every TradingView plan, including the free tier. Anchored VWAP is also free; it lives in the drawing toolbar rather than the Indicators menu. You only need a paid plan if you want more saved layouts, additional indicator slots, or extended hours data, and a TradingView discounted subscription handles the upgrade if you decide to go that route.
Can you use VWAP on a daily chart?
You can plot it, but the default session VWAP resets at the open of each session, so on a daily chart it just shows that day’s evolving average. For a daily-chart use case, switch the Anchor input from Session to a longer period (Week, Month, Quarter) or use Anchored VWAP tied to a specific event such as the last earnings date.
What are the best VWAP settings on TradingView?
Start with the defaults: Anchor Session, Source hlc3, Bands multiplier 1, 2, and 3 enabled. The defaults match the formula institutional desks use. Adjust the anchor period only when your strategy spans multiple sessions, and adjust band multipliers only after you have logged enough trades to know your edge sits at a specific deviation level. VWAP also slots in alongside other staples covered in the best TradingView indicators short list.
How do you find the VWAP of a stock on TradingView?
Open the chart, click the Indicators icon at the top, search VWAP, and select Volume Weighted Average Price. The current VWAP value reads on the right-hand price scale and updates each tick. Hover the line on any candle to see the VWAP value at that moment, or open the Data Window panel for a precise readout.
Bottom Line
VWAP earns its place on a TradingView chart because it tells you something no moving average can: where the volume-weighted average dollar of activity has actually transacted today. Default session VWAP for intraday execution context, anchored VWAP for swing context tied to a real event, and the bands as zones of interest rather than reversal lines.
Plot it, log every setup by tag, and let the data tell you which version of the VWAP playbook actually pays you. The chart is free; the discipline is what compounds. If you do not have a chart open yet, start with a TradingView free trial and add VWAP as your first indicator.
This article contains affiliate links I may be compensated for if you click them.
Get Your Free Trading Resources
Grab the free trading journal template plus the same tools we use to stay organized, consistent, and objective.
- Free trading journal template
- Custom indicators, watchlists, and scanners
- Access our free trading community
Enter your email below to get instant access.
No spam. Unsubscribe anytime.







