Anchored VWAP: Strategies, Settings, and How to Use It
The anchored VWAP is one of the few indicators that improves the more specific you get with it: instead of resetting every day like a standard VWAP, you anchor it to a meaningful event and let the market’s volume-weighted behavior relative to that point tell you where fair value actually sits. Most traders who add it to their charts within the first week wonder why they ever read support and resistance without it. This guide covers what it is, how to anchor it correctly, platform-by-platform setup, and four strategies you can start using today.
Key Takeaways
- The anchored VWAP calculates the volume-weighted average price from any anchor point you choose, making it useful for swing trades, earnings setups, and multi-day trend analysis where a daily-reset VWAP falls short.
- The anchor point matters more than the indicator itself: anchor to swing highs, swing lows, earnings events, or major breakout candles to get a line the market actually reacts to.
- TradingView, thinkorswim, and TrendSpider all offer native anchored VWAP tools, and the core workflow is the same across all three.
Track Every AVWAP Setup You Take
The Financial Tech Wiz Trading Journal automatically imports your trades and shows you which setups (including VWAP-based entries) are actually working across sessions, weeks, and market conditions.
Try the Trading JournalWhat is the Anchored VWAP?
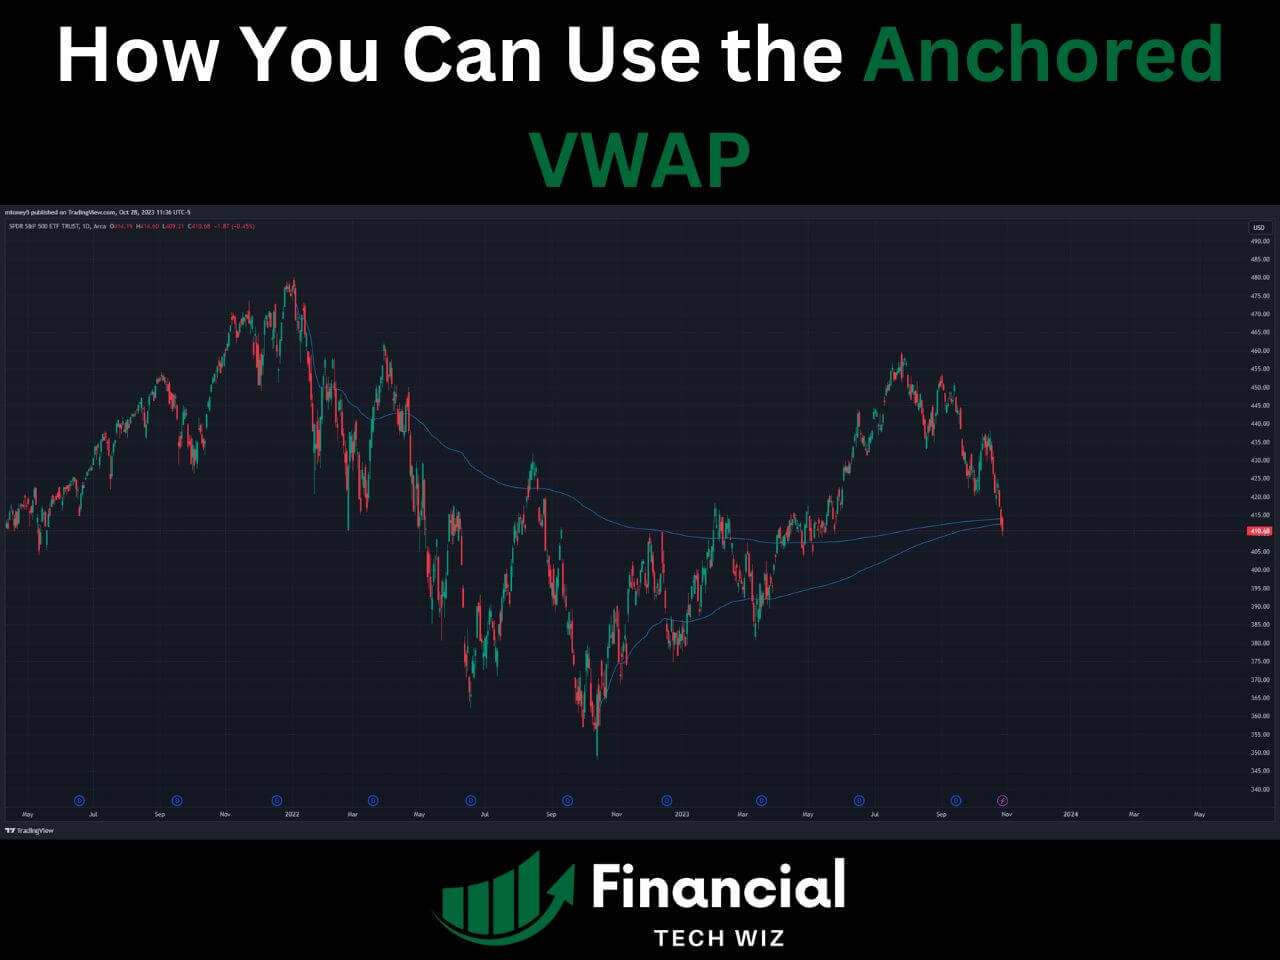
The anchored VWAP stands for anchored volume-weighted average price. It is a trading indicator that provides the average price of a security from a specific starting point (the “anchor”), factoring in price and volume. It is used to confirm trends and identify areas of support and resistance on the chart.
The main difference between the anchored VWAP and the traditional VWAP is the traditional VWAP resets daily. On the other hand, the anchored VWAP is always calculated based on where you set the anchor point.
Similar to the regular VWAP, the anchored VWAP takes price and volume into account to determine the average price at which the asset is bought and sold most frequently. This is useful to determine what is considered “fair value” for an asset based on a specific timeframe and anchor point.
Anchored VWAP Strategy: How to Use the Anchored VWAP
It is most common to use the anchored VWAP on longer timeframes like the daily chart. However, you can use it on any time frame, depending on your trading style and objectives.
How to Pick the Anchor Point
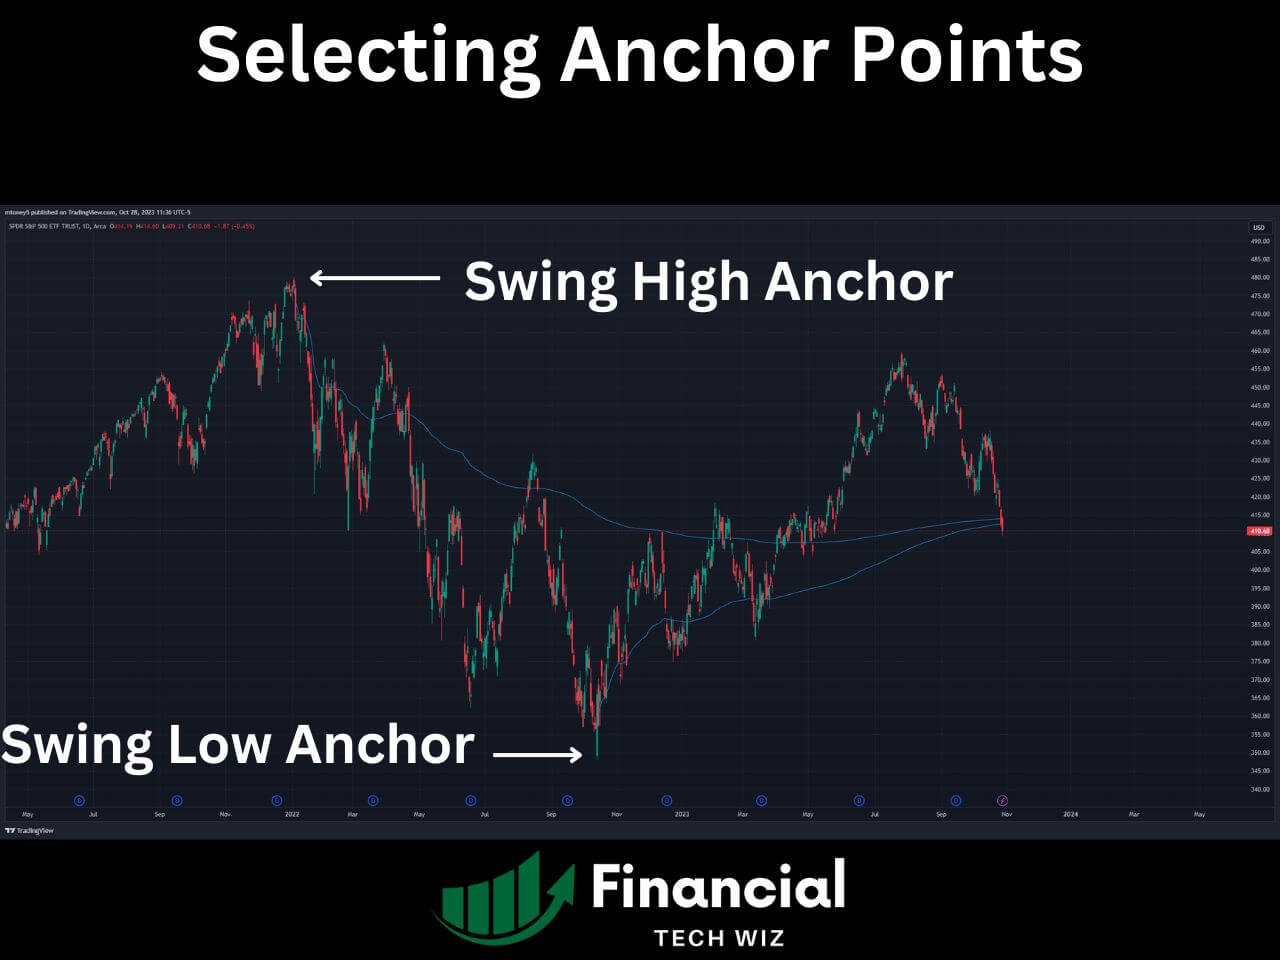
You should pick an anchor point at key areas on the chart, such as the highest or lowest point of the price action, a gap, a breakout, a reversal, or any other significant event. The anchor point should mark a change in market sentiment or behavior that you want to measure.
For example, if we look at a chart of SPY, we can see a bottom in October of 2022 and a peak in January 2022. We can set the anchor point at either the bottom or the top. As shown in the image below, when we plot both anchored VWAPs, they are at nearly the same price, making the level more significant in this case.
How to Determine Entry and Exits
Depending on each specific situation, the anchored VWAP can allow you to determine trading opportunities in a few ways.
For example, if you set the anchor point to a swing low, and the stock is trading above the anchored VWAP, you can wait for the price to drop back to the anchored VWAP and buy it using the anchored VWAP as a support level.
However, if the price continues lower below the anchored VWAP, this may signal a trend change, and you may want to use a stop loss.
You can also trade continuations with the anchored VWAP. For example, if a stock recently broke above its anchored VWAP, this may signal a trend shift to a new uptrend.
The anchored VWAP will change from resistance to support, and you can buy the stock and set a stop loss below the anchored VWAP.
Anchored VWAP Trading Strategies
Trend Continuation Strategy
Wait for price to pull back to the anchored VWAP after an established uptrend. A rejection candle at the AVWAP (a hammer, bullish engulfing, or simply a close back above the line) is the entry signal. Set a stop below the AVWAP (one standard deviation band works well) and target the prior high or the upper band. This setup only works cleanly when the AVWAP is sloping upward, confirming the trend has not reversed.
Trend Reversal Strategy
A clean break below the anchored VWAP on above-average volume, followed by a retest from below that fails to reclaim the line, is one of the stronger reversal signals the indicator offers. The retest is the entry: short the failed reclaim with a stop above the AVWAP and target the lower standard deviation band or the next structural support level. This setup works in both directions.
Event-Based Strategy
Anchor the VWAP to an earnings date or major news event. The AVWAP then shows you the average price all participants paid since that event, which is meaningful context for whether the post-earnings move has been accepted or is likely to revert. If price is trading well below the post-earnings AVWAP weeks later, the initial pop was not accepted by the market. If price is consistently above it, the market has validated the move.
Anchored VWAP Examples
Stocks Example
Set the anchor to a major swing low such as an October 2023 trough on SPY. As price climbed through the following months, the AVWAP from that anchor became the first pullback target. In trending markets, SPY repeatedly pulled back to and bounced from that anchored VWAP line before continuing higher, making each touch a potential trend-continuation entry.
Swing Trading Example
A stock breaks out of a multi-week consolidation on heavy volume. Anchor the VWAP to the first candle of the breakout. Over the following sessions, any pullback to the anchored VWAP is the swing entry: the stock is returning to the volume-weighted cost basis of everyone who participated in the breakout. If that level holds, the breakout is still valid. If it fails, the breakout is likely to be faded.
Pros and Cons of Anchored VWAP
The anchored VWAP’s main strength is that it is volume-weighted, which means it reflects actual market participation rather than just price movement. A price level that aligns with a high-volume AVWAP carries more weight than a level drawn from simple price action alone. It is also flexible: you can run multiple anchored VWAPs from different points simultaneously to identify confluence zones.
The main limitation is subjectivity. There is no universally correct anchor point, which means two traders can draw the same indicator and get different levels. It also performs poorly on low-volume instruments where the volume weighting produces unreliable averages. Like all indicators, it is descriptive, not predictive: it tells you where fair value has been, not where it is going.
What Charting Platforms Offer the Anchored VWAP?
The best charting tools that offer the anchored VWAP include TradingView, thinkorswim, and TrendSpider. You can use it with a free account on TradingView, free as a Schwab or TD Ameritrade customer with thinkorswim, or with TrendSpider.
TradingView is a web-based platform that offers advanced charting tools, technical indicators, drawing tools, and social features. You can access thousands of markets and instruments across stocks, forex, crypto, futures, and more. TradingView offers the anchored VWAP on its free plan.
thinkorswim is a desktop-based platform that offers powerful trading tools, analytics, and education for active traders. You can trade stocks, options, futures, forex, ETFs, and more with thinkorswim.
TrendSpider is an automated technical analysis platform that uses artificial intelligence to scan charts for patterns, trends, indicators, and candlestick formations. You can also backtest your strategies, set alerts, and monitor multiple time frames with TrendSpider. TrendSpider offers a free trial; use coupon code FTW25 for 25% off.
How to Use the Anchored VWAP on TradingView
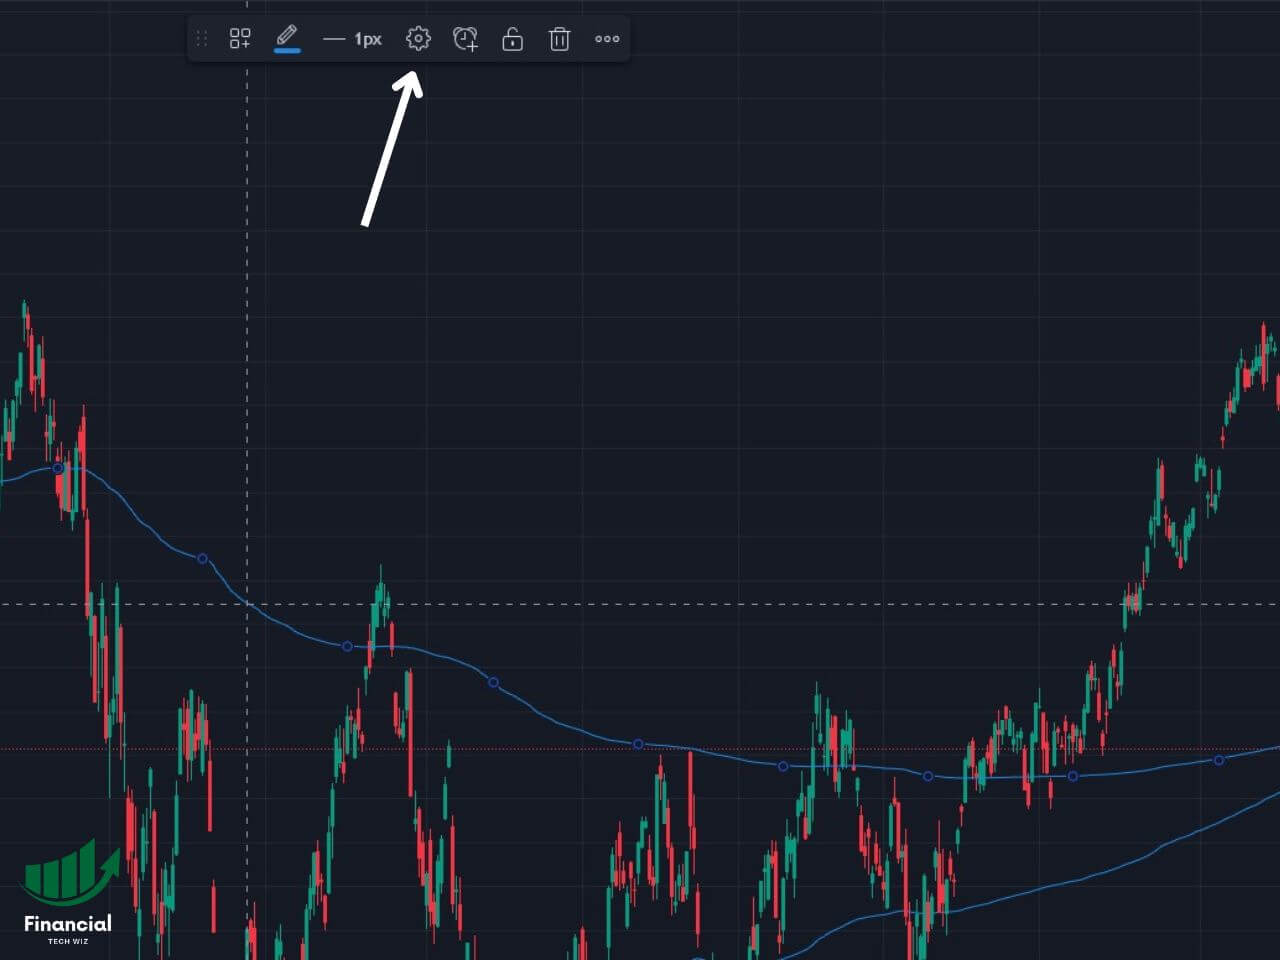
The anchored VWAP on TradingView is a drawing tool that you can access from the left toolbar. It is the fifth tool from the top on the left part of the chart. Once you click on it, you will see the anchored VWAP tool under the volume-based section.
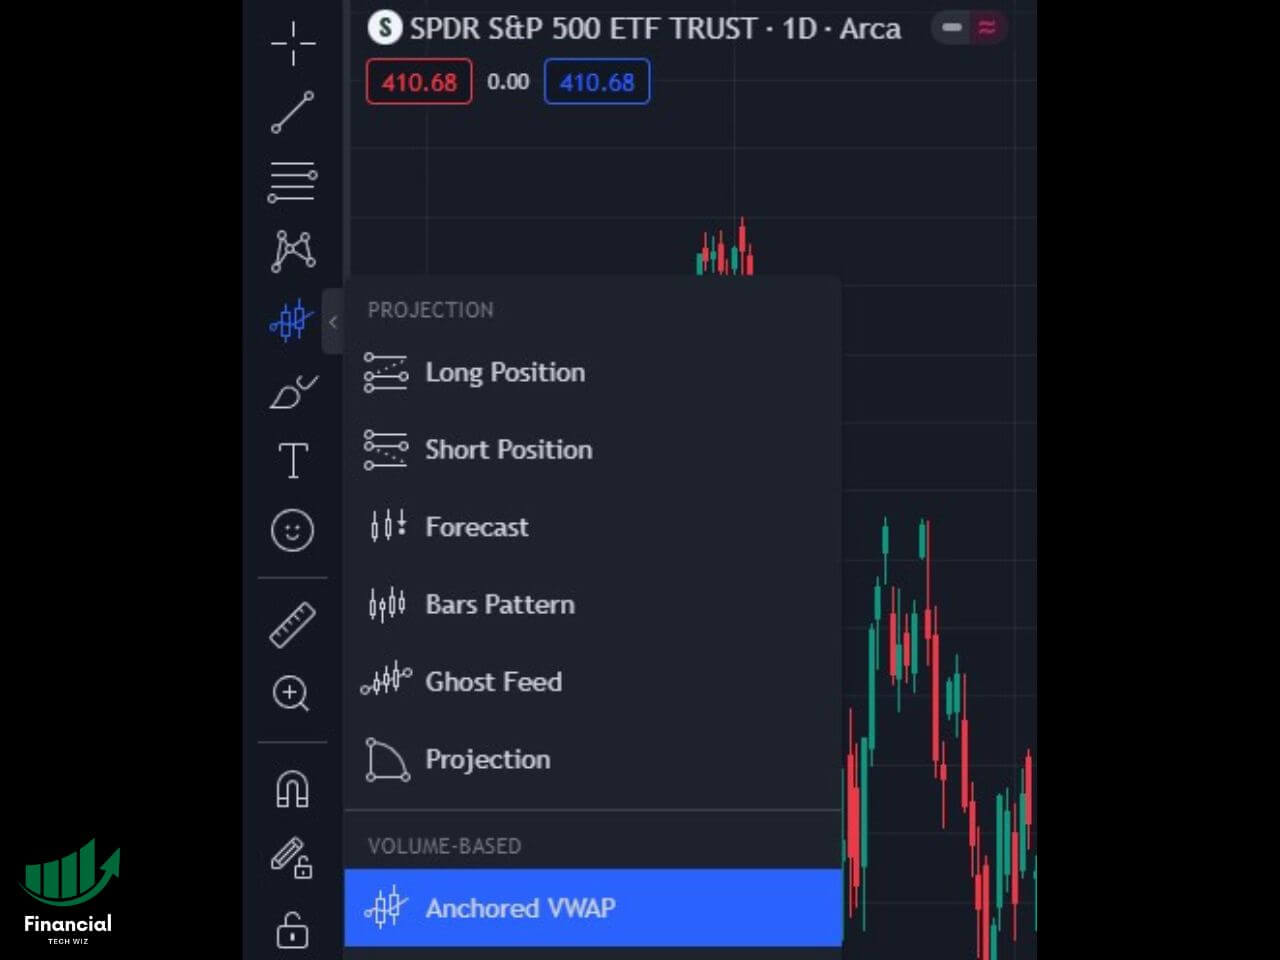
To use it, you simply click on the candlestick that you want to use as the anchor point. This will plot the anchored VWAP and two additional band multipliers.
These band multipliers are customizable and signify 1, 2, or 3 standard deviations above and below the anchored VWAP.
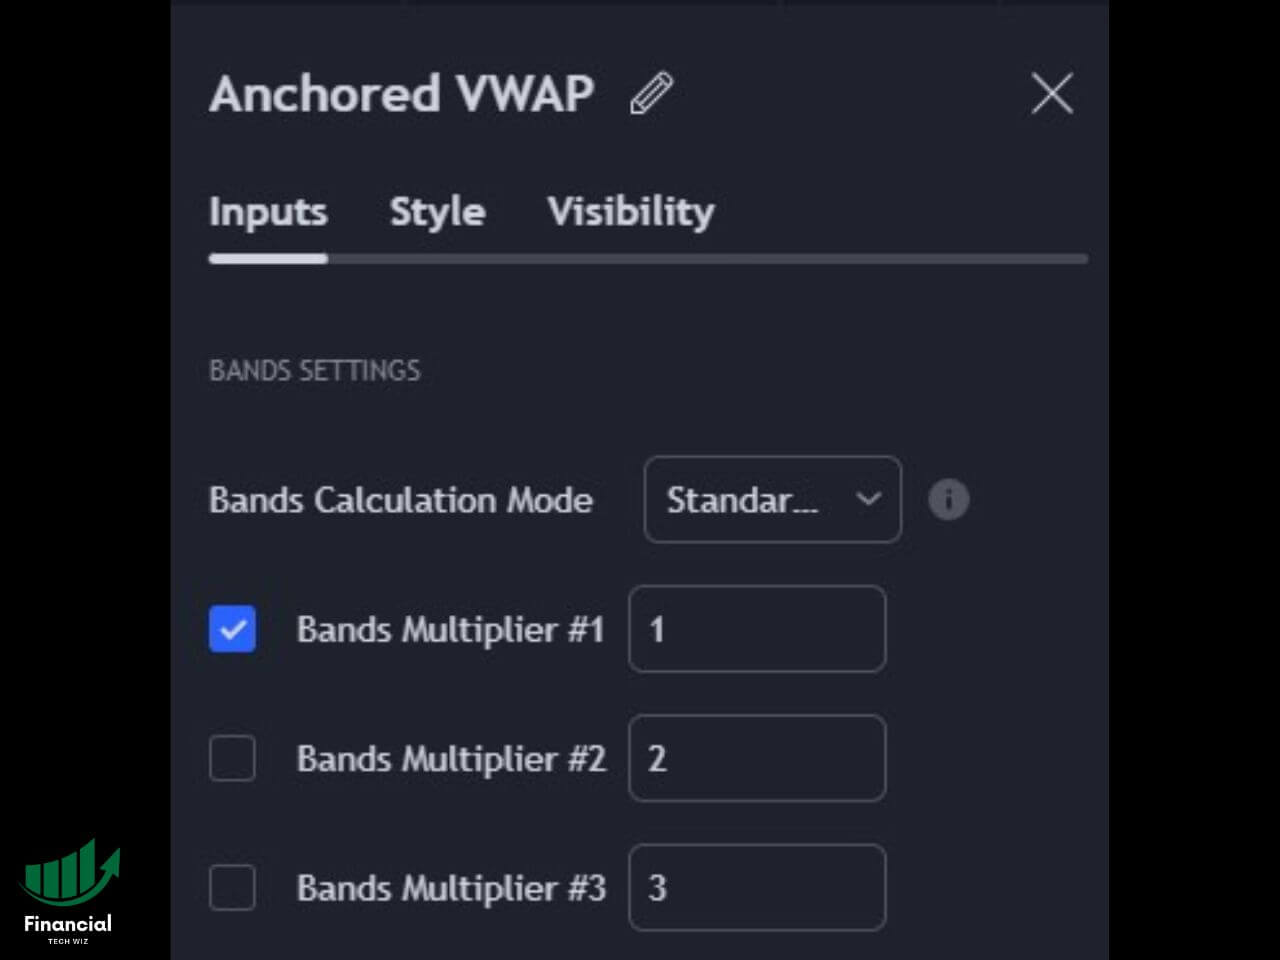
You can remove these by clicking on the anchored VWAP, clicking the settings icon, and unchecking the band multiplier boxes.
You can also watch my video about using the anchored VWAP on TradingView below:

For a full overview of TradingView’s drawing tools and indicators, see the best TradingView indicators guide.
How to Use the Anchored VWAP on TrendSpider
To use the anchored VWAP on TrendSpider, you must first pull up a chart of your desired instrument and time frame.
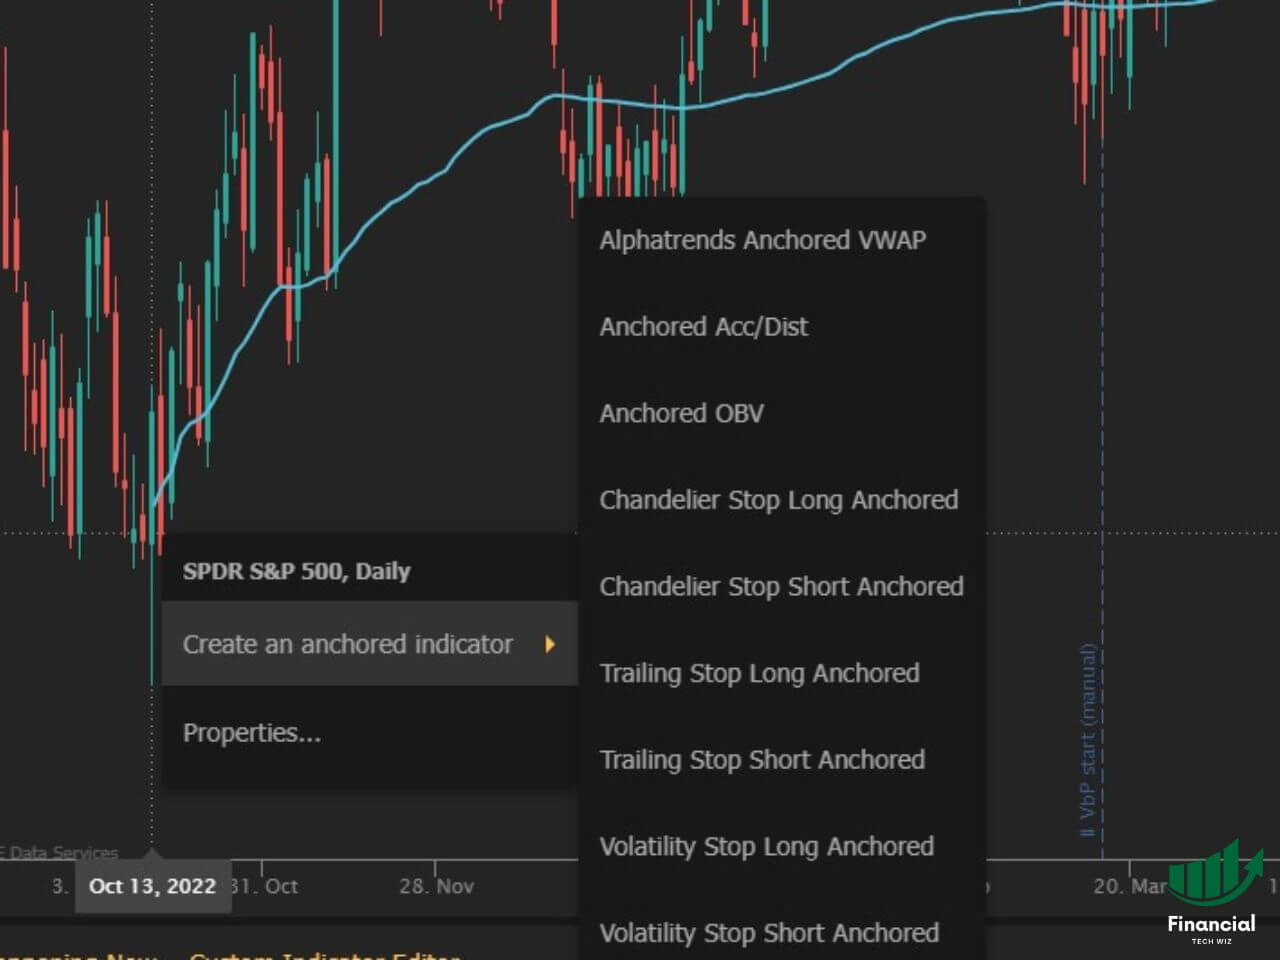
Then, you can right-click on the candlestick that you want to use as the anchor point and select “create an anchored indicator,” then select anchored VWAP.
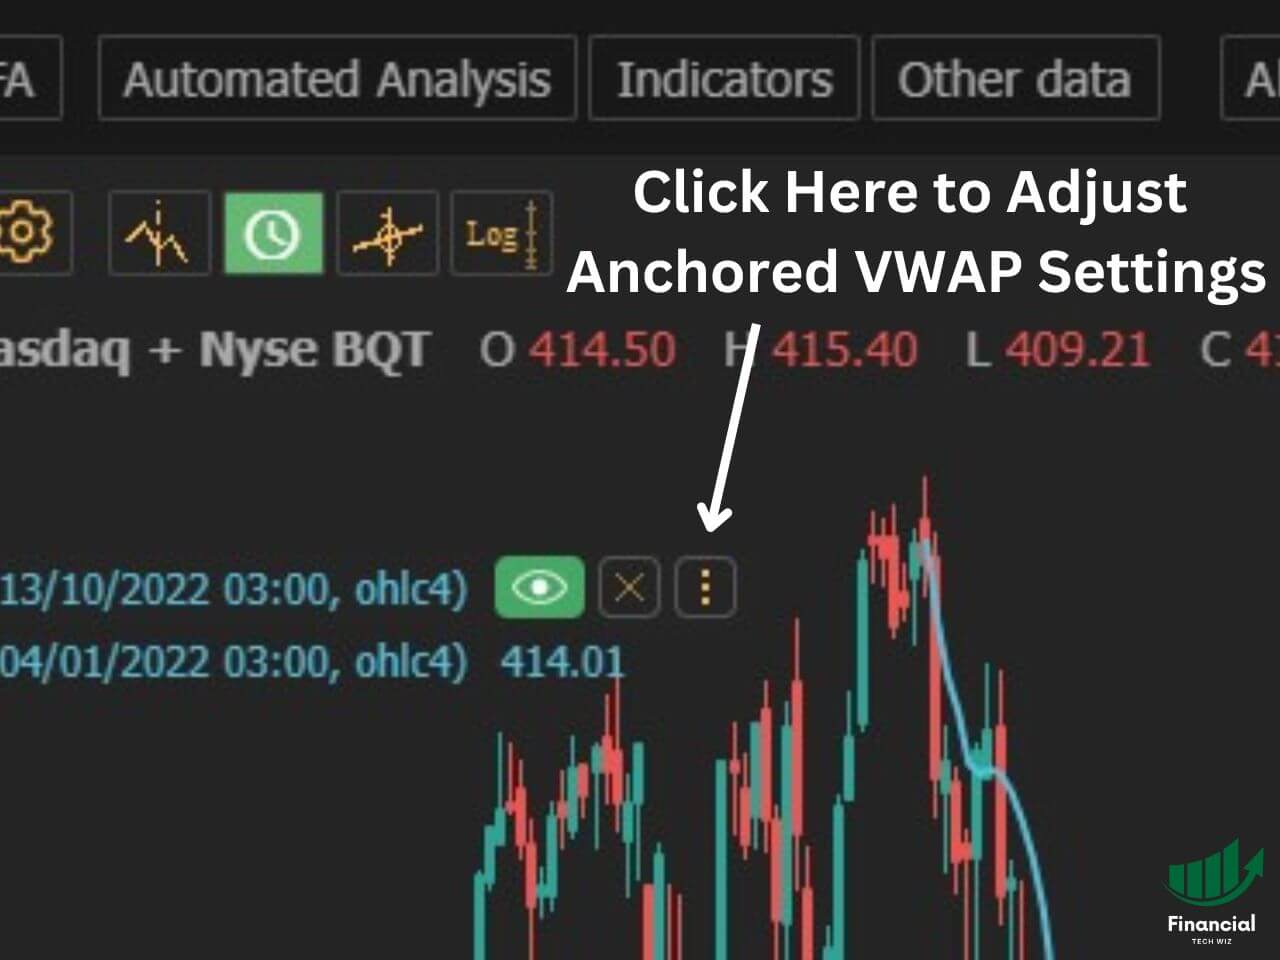
You can also adjust the color, style, and thickness of the line by clicking on the three dots that appear when you hover over the anchored VWAP in the indicator list at the top left of your chart.
You can also add multiple anchored VWAPs from different anchor points to compare them.
How to Use the Anchored VWAP on thinkorswim
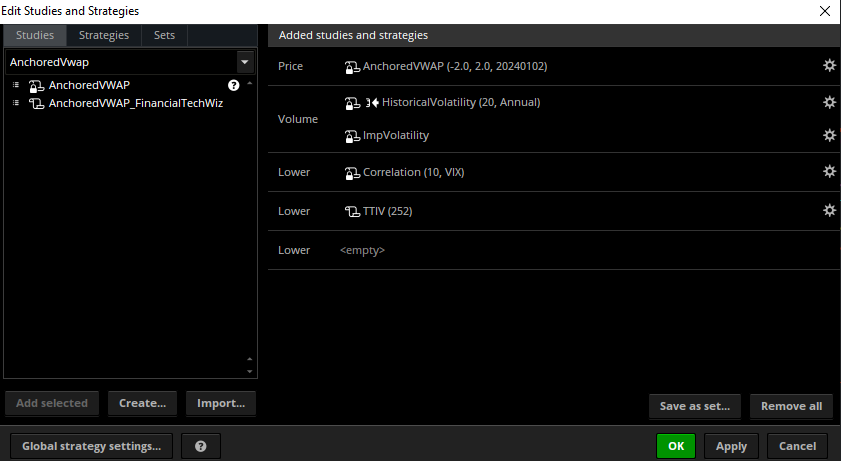
To use the anchored VWAP on thinkorswim, navigate to a chart, then click the beaker icon to open studies. Search for “AnchoredVWAP” and then click add selected. Click apply, and the study will be added to your chart.
You can also adjust the anchor date, color, style, and other settings by clicking on the gear icon in the studies tab.
Best Practices for Anchored VWAP
Use multiple anchors simultaneously to identify confluence. A level where the AVWAP from a major swing low and the AVWAP from an earnings date converge is more likely to hold than a level supported by only one anchor.
Combine with volume. A break of the AVWAP on below-average volume is less reliable than the same break on a volume spike. The indicator is volume-weighted in its calculation but does not automatically tell you whether the current move is backed by volume: check the volume bars separately.
Do not over-anchor. Two or three AVWAP lines on a single chart is useful; any more creates noise. Reserve anchors for the most structurally significant events on that particular instrument.
Get Your Free Trading Resources
Grab the free trading journal template plus the same tools we use to stay organized, consistent, and objective.
- Free trading journal template
- Custom indicators, watchlists, and scanners
- Access our free trading community
Enter your email below to get instant access.
No spam. Unsubscribe anytime.
Anchored VWAP vs. VWAP Compared
The traditional VWAP is only used intraday, primarily for day traders, while the anchored VWAP allows you to determine the volume-weighted average for a longer time period than just one day.
The traditional VWAP can help you gauge whether you are getting a good deal on your trades based on the average price of that day. The anchored VWAP can help you gauge whether you are getting a good deal on your trades based on the average price since a certain event or date.
For example, if you want to know whether you are buying or selling at a fair price relative to the market sentiment since the last earnings report, you can use the anchored VWAP with the anchor point set at the earnings date.
If you want to know whether you are buying or selling at a fair price relative to the market sentiment since the beginning of the year, you can use the anchored VWAP with the anchor point set on January 1st.
The traditional VWAP can also be used as a dynamic support and resistance level within a trading day, as prices tend to bounce off or break through it. The anchored VWAP can be used as a dynamic support and resistance level over a longer time frame, as prices tend to bounce off or break through it as well.
For most swing traders, the anchored VWAP is the better tool because it reflects volume-weighted fair value across the holding period of a trade rather than just the current session. For intraday scalpers and institutional order-flow traders, the standard VWAP remains the primary reference. See also the VWAP on TradingView guide for a full walkthrough of the standard VWAP indicator setup.
FAQ
What is an anchored VWAP?
The anchored VWAP is a volume-weighted average price indicator that starts calculating from a specific point you choose on the chart rather than resetting each day like the standard VWAP. You anchor it to a meaningful event: a swing high, swing low, earnings date, or breakout candle. From that point forward, it shows the average price weighted by volume, giving you a dynamic level that reflects what the market as a whole paid since that event.
Which is more accurate, VWAP or anchored VWAP?
For intraday trading, the standard VWAP is more appropriate because it measures the session’s volume-weighted fair value, which is the benchmark institutional traders use for same-day execution. For swing trading or any analysis that spans multiple days or events, the anchored VWAP is more useful because it does not reset and can be tied to the specific market structure event you care about. They serve different purposes: neither is more accurate in absolute terms.
What is the best setting for anchored VWAP?
The indicator itself has no adjustable settings beyond the standard deviation band multipliers, which most traders leave at 1 and 2. The meaningful “setting” is the anchor point. Anchor to the most significant structural event for the instrument and time frame you are trading: the most recent swing low for a long setup, the earnings date for a post-earnings play, or the first candle of a breakout for a momentum entry. The anchor point is where the indicator’s edge either exists or does not.
Do professional traders use VWAP?
Yes. Institutional traders use the standard VWAP as an execution benchmark: a buy order that fills at or below VWAP is considered efficient; one that fills above VWAP is not. The anchored VWAP is used by active traders and some institutions to contextualize multi-day price action and identify where large-volume participants have their cost basis. Trader and author Brian Shannon, who popularized the anchored VWAP approach, documented its use extensively among professional tape readers.
Anchored VWAP: Bottom Line
The anchored VWAP is a useful trading indicator that helps you identify support and resistance levels based on volume-weighted fair value from any anchor point you choose. You can use it to confirm trends, spot reversals, gauge market sentiment, and enter or exit trades with more context than price action alone provides.
TradingView offers it free on all plans. thinkorswim includes it natively through Schwab. TrendSpider automates it with AI-assisted anchoring; use coupon code FTW25 for 25% off your first subscription.
Get Your Free Trading Resources
Grab the free trading journal template plus the same tools we use to stay organized, consistent, and objective.
- Free trading journal template
- Custom indicators, watchlists, and scanners
- Access our free trading community
Enter your email below to get instant access.
No spam. Unsubscribe anytime.


