
Fair Value Gap (FVG): The ICT Trader’s Complete Guide

Fair value gaps are one of the most searched ICT concepts right now, and for good reason: they show you exactly where institutional money moved so fast that the market left a hole. That hole acts like a magnet, drawing price back before the next directional move. Once you understand what a fair value gap is and what makes one worth trading, you will see them on every chart you open.
Key Takeaways
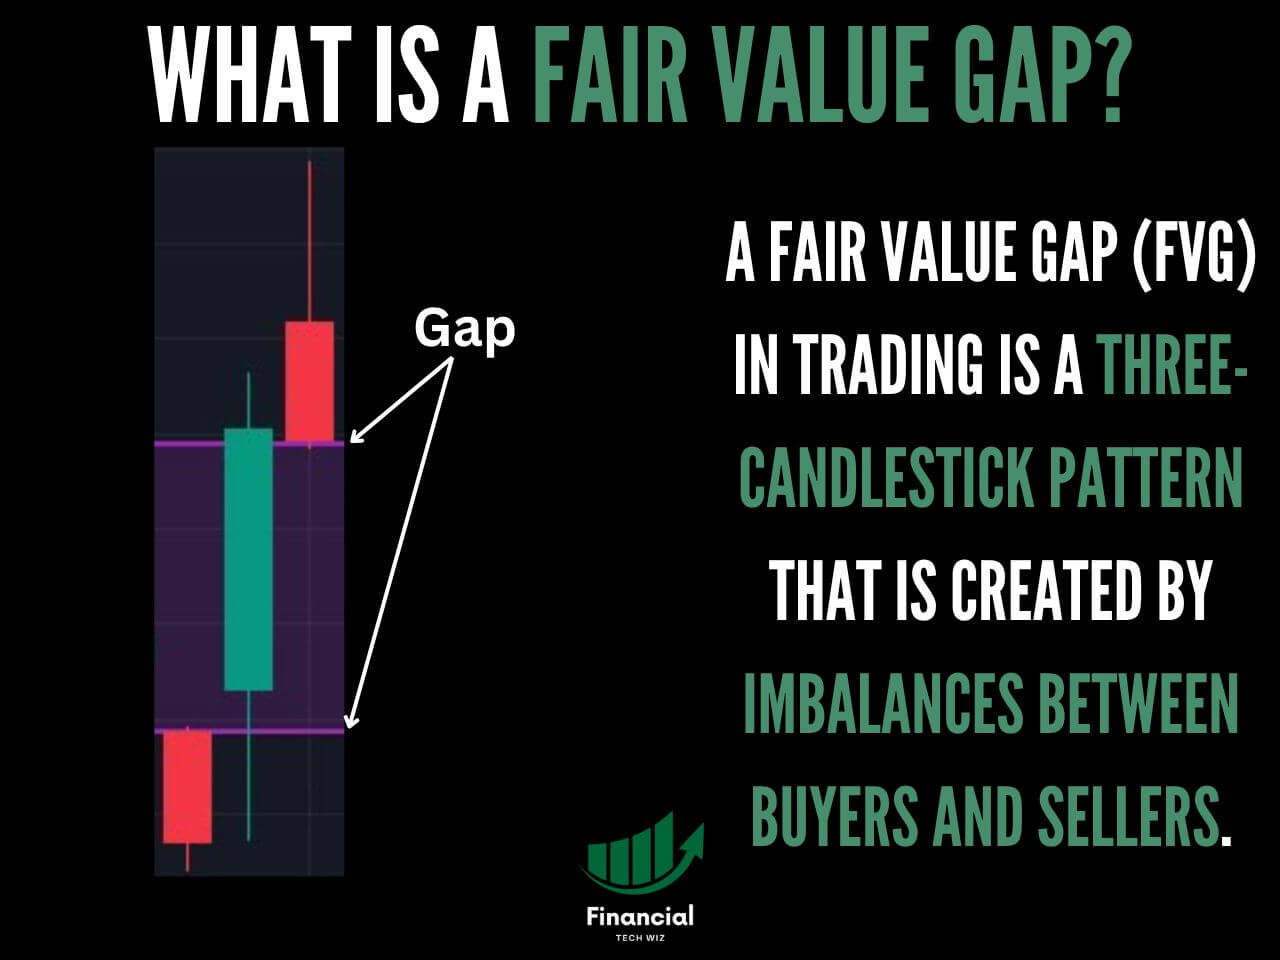
- A fair value gap (FVG) is a three-candle imbalance created when price moves so aggressively that a gap forms between the first and third candle’s wicks.
- Bullish FVGs act as potential support (price reload zones); bearish FVGs act as potential resistance. Not every FVG fills, and not every filled FVG is worth trading.
- High-probability FVG trades require four conditions: alignment with the higher-timeframe trend, strong displacement, correct premium/discount zone positioning, and a fresh (unmitigated) gap.
Financial Tech Wiz Trading Journal
Track Your FVG Setups Automatically
Log every fair value gap trade, track your win rate and P&L across your full trade history, and build a data-backed picture of which FVG setups hold up over time.
Start Free TrialFair Value Gaps Meaning Explained for Traders
A fair value gap (FVG) in trading is a three-candlestick pattern that is created by imbalances between buyers and sellers.
Like a regular gap, the fair value gap acts as a magnet, drawing the asset’s price to eventually fill the gap and repair the imbalance in the market.
An FVG can occur on any timeframe, from the 1-minute chart to the daily chart.
How to Identify a Fair Value Gap
Identifying fair value gaps can be a difficult task, so let’s break it down step by step:
1- Find a Large Imbalance Candle
The first step to identifying a fair value gap is to find an abnormally large candle that causes a clear imbalance between buyers and sellers. Large candles can be caused by news, economic events, or volatile price action. The large candle can be either red or green.
2- Identify the Fair Value Gap on the Chart
Once you identify the large candle, you must analyze the candles directly to the left and right. The highs and lows of these candles determine the fair value gap range, which we can draw on our TradingView charts with horizontal lines or a rectangle.
If the large candle is green, the fair value gap is defined as the area of the preceding candle’s high and the following candle’s low. Note that the neighboring candles should not significantly overlap the large candle, as in this case, there wouldn’t be much of a gap.
Fair Value Gap Indicator
One of the best fair value gap indicators around is the LuxAlgo HTF Fair Value Gap on TradingView.
If you want to try this indicator out for free, you can sign up with our TradingView affiliate link to receive a 30-day free trial and a discount on your subscription.
Exclusive Deal: 30-Day FREE Premium Access + Bonus Credit
Don’t Miss Out – Sign up for TradingView Now!
- Advanced Fair Value Gap Tools
- Real-Time Market Data
- Track All Market Trends
Bullish vs. Bearish Fair Value Gaps
Fair value gaps can either be bullish or bearish, depending on the overall trend and color of the candles.
Bullish Fair Value Gaps
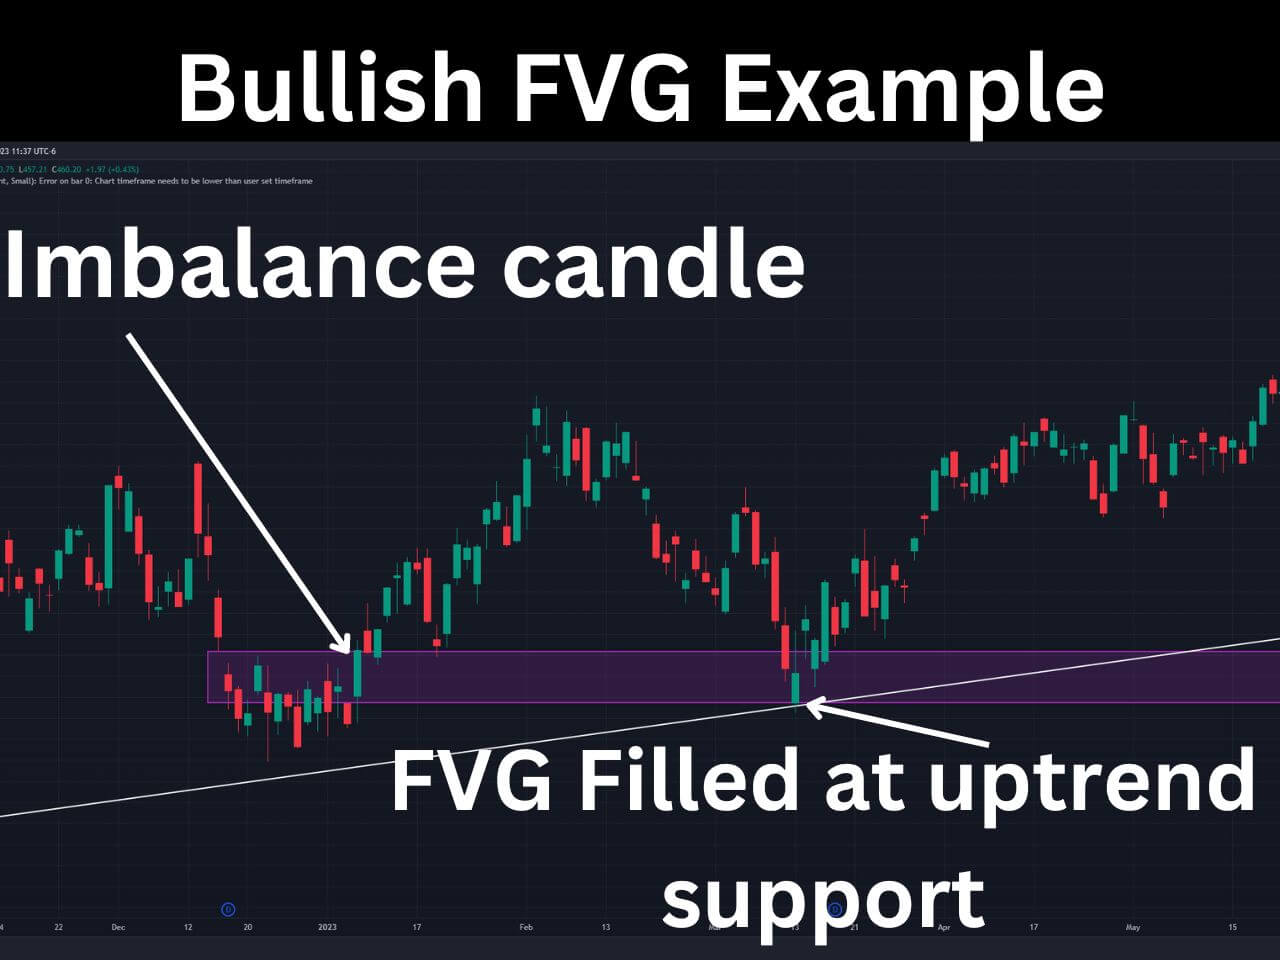
A bullish fair value gap is identified by a large green candle and states that an asset price recently increased too quickly and may be temporarily overvalued. Therefore, it is likely that the price will eventually come down and fill the fair value gap before continuing higher.
Bullish Fair Value Gap Example
An excellent example of a bullish FVG can be found on the SPY daily chart on 1/6/2023. Price was steadily consolidating, then a large green candlestick created an FVG, identified by the rectangle on the chart. The bullish FVG is determined by the preceding candles’ high and the following candles’ low.
Bearish Fair Value Gaps
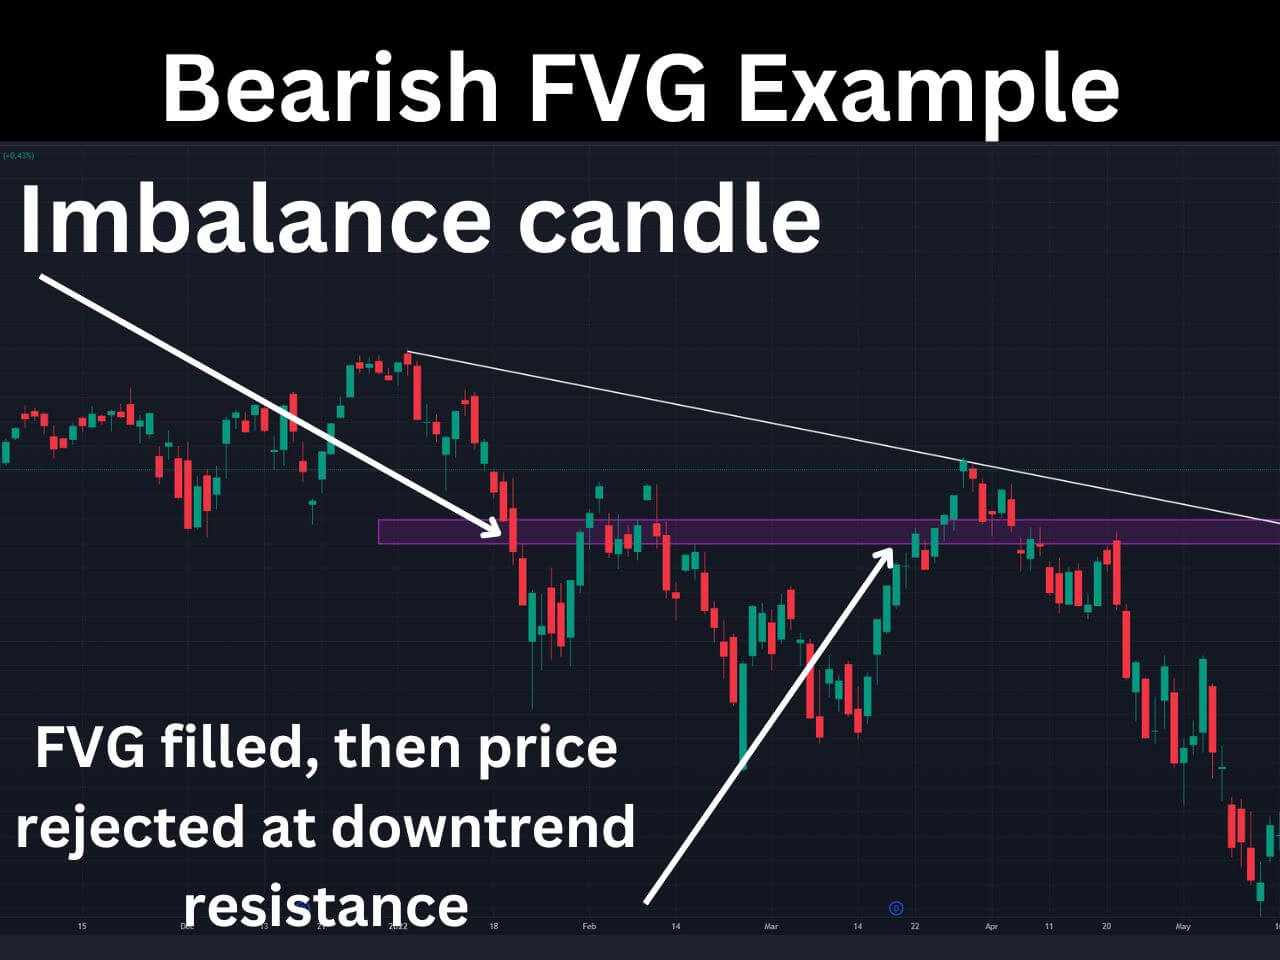
A bearish fair value gap is identified by a large red candle and means that the asset price is temporarily undervalued. Eventually, traders will likely see the price repair this imbalance by increasing and filling the fair value gap. The bearish FVG is determined by the preceding candles’ low and the following candles’ high.
Bearish Fair Value Gap Example
An example of a bearish fair value gap lies on the SPY daily chart on 1/20/2022. The FVG is marked by the purple rectangle, and we also determined the overall trend was down based on the trendline.
Identifying the Overall Trend
The overall trend of an asset is crucial when determining how you will trade the fair value gap. For example, if a stock is in an overall downtrend and you notice a bearish fair value gap, traders will consider shorting when the price fills the FVG. Ideally, the FVG is near a resistance level determined by another indicator or a bearish trendline.
FVG Types Beyond the Basics
Once you are comfortable identifying standard bullish and bearish FVGs, the next layer is understanding the variations you will encounter on live charts. These are not edge cases: every experienced ICT trader uses them regularly.
Inverse Fair Value Gap (IFVG)
An inverse fair value gap forms when a standard FVG gets completely filled. Once price trades all the way through a bullish FVG, that zone no longer acts as support. It flips and becomes resistance. The logic: the institutional buy orders that originally created the gap have been consumed. The zone now acts as a supply area from the opposite direction.
The same applies to bearish FVGs: once fully filled, they become support zones. When you see this flip, mark the zone as an IFVG and treat it accordingly. Trading a bullish FVG that has already flipped as if it were still support is one of the most common and costly mistakes newer ICT traders make.
Consequent Encroachment (CE)
The Consequent Encroachment is the exact midpoint of a fair value gap: the 50% level of the gap’s range. ICT methodology places significant weight on this level because price frequently targets the CE before reacting, rather than the full edge of the gap. Many traders use the CE as their entry level rather than waiting for price to reach the gap’s lower boundary. You get a slightly better price; the trade-off is that price sometimes reverses before reaching the midpoint.
Mitigated vs Unmitigated
An unmitigated FVG is one that price has never returned to. Unmitigated gaps carry the edge. A mitigated FVG has already been revisited and reacted from: the institutional orders resting there have been filled. Mitigated gaps should be greyed out on your chart and ignored. The edge is one-time use.
Tracking which gaps are fresh versus mitigated is essential for keeping your FVG map clean. This is one area where a trading journal pays immediate dividends: logging your FVG entries lets you review which zones held and which were run through, building an accurate personal record of fill rates across different market conditions.
HTF vs LTF FVGs
Higher-timeframe FVGs (daily, four-hour) act as macro zones that attract price across days or weeks. Lower-timeframe FVGs (fifteen-minute, five-minute) are execution-level zones for timing entries within those macro gaps. The highest-probability setups occur when a lower-timeframe FVG forms inside a higher-timeframe FVG: nested imbalances with layered institutional interest.
FVG Trading Strategies
Knowing what a fair value gap is gets you to the starting line. Trading it effectively requires a specific set of rules for each approach. The three strategies below cover beginner through intermediate setups.
Strategy 1: FVG Retracement (Baseline)
The most straightforward FVG trade. Wait for a displacement candle to create an FVG in the direction of the higher-timeframe trend. Then wait for price to retrace back into the gap. Enter at the Consequent Encroachment (midpoint) or when you see a rejection candle forming within the gap’s range. Place your stop just below the FVG low for a bullish FVG, or just above the FVG high for a bearish FVG. Target the next swing high or the next liquidity pool.
This strategy works because you are entering exactly where institutional reload orders are resting. The stop is tight relative to the target, and the direction is confirmed by the existing trend. Understanding the broader auction market theory behind price behavior helps contextualize why price returns to these zones.
Strategy 2: FVG and Order Block Confluence
When a fair value gap overlaps with an order block, you have two institutional footprints confirming the same zone. The FVG shows the imbalance. The order block shows where institutions placed orders. Together, they create a high-probability zone where price is significantly more likely to react than at a standalone gap.
Enter at the overlap zone. Stop goes beyond both the FVG edge and the order block boundary. Target the next higher-timeframe liquidity level. This is widely considered the highest-probability FVG setup in the ICT framework.
Strategy 3: FVG After a Liquidity Sweep
This intermediate approach combines FVGs with change-of-character and liquidity concepts. Wait for price to sweep a key liquidity level: equal highs, equal lows, or a session high or low. Then look for an FVG forming in the opposite direction immediately after the sweep. The FVG that appears right after a liquidity grab signals that institutions have collected their orders and are now repositioning. The setup produces large risk-to-reward ratios because you are entering early in the reversal.
For any of these strategies, the higher-timeframe supply and demand structure should confirm your directional bias before you execute.
The FVG Quality Filter
Not every FVG is worth trading. The ones that fail tend to share common traits: they are counter-trend, they formed from weak displacement, or they sit in the wrong zone relative to the broader structure. Applying four rules before every trade eliminates the majority of losing FVG setups.
Rule 1: Trade with the higher-timeframe trend. Only take bullish FVG entries when the daily or four-hour structure is bullish. Only take bearish FVG entries when the structure is bearish. A bullish FVG in a downtrend is likely to be run through, not respected.
Rule 2: Check the displacement candle. The middle candle in the three-candle pattern should be significantly larger than the candles around it, typically two to three times the average size. A small displacement creates a weak FVG. Strong displacement signals genuine institutional urgency.
Rule 3: Confirm premium or discount zone positioning. Use Fibonacci from the last significant swing to determine where the FVG sits. For long entries, you want bullish FVGs forming in the discount zone (below the 50% level). For short entries, bearish FVGs should sit in the premium zone (above 50%). FVGs in the wrong zone carry substantially lower win rates.
Rule 4: Only trade fresh, unmitigated gaps. If price has already returned to the gap and reacted, the institutional orders have been consumed. That gap is dead. Mark it and move on. Only trade unmitigated FVGs on their first retrace.
Free Resource
Track Your FVG Setups in a Free Trading Journal Template
A Google Sheets template used by 1,300+ traders. Log your fair value gap entries, track what fills and what does not, and start building a personal FVG fill-rate record.
Get the Free TemplateHow to Identify Fair Value Gaps on TradingView
TradingView does not have a native FVG indicator on the free plan, but you can identify and draw fair value gaps manually in under a minute once you know what to look for. Here is the process.
Open any chart on TradingView and select a timeframe relevant to your strategy. Most ICT traders start on the four-hour or daily chart to identify significant zones, then drop to the fifteen-minute chart for entries. Look for a sequence of three candles where the middle candle is significantly larger than the others.
For a bullish FVG: confirm that the low of the third candle is higher than the high of the first candle. The gap between those two levels is your fair value gap. Use the Rectangle tool (keyboard shortcut: R) to shade the zone from the first candle’s high to the third candle’s low.
For a bearish FVG: confirm that the high of the third candle is lower than the low of the first candle. Shade the zone from the first candle’s low to the third candle’s high.
Color-code your zones: green rectangles for bullish FVGs, red for bearish, grey for mitigated. Keep your chart organized by graying out zones once price has fully traded through them.
If you want automatic detection, search for “FVG” or “fair value gap” in the TradingView Public Library. Several community-built scripts flag gaps automatically. The best TradingView indicators guide covers how to evaluate and install third-party scripts safely.
FAQ
What is a fair value gap in trading?
A fair value gap (FVG) is a three-candle price pattern that forms when institutional buying or selling moves price so aggressively that a gap appears between the wick of the first candle and the wick of the third candle. That untraded zone represents an imbalance in the market. Price tends to return to the gap to rebalance before continuing in the original direction.
Do all fair value gaps get filled?
No. Research and observation across live markets suggest that roughly 60 to 70 percent of fair value gaps see at least a partial retracement. The remaining 30 to 40 percent are left unfilled, particularly during strong trending moves. This is why the quality filter: trend alignment, displacement strength, premium/discount zone, and fresh status, matters more than simply identifying the gap.
What is an inverse fair value gap?
An inverse fair value gap (IFVG) is a standard FVG that has been completely filled by price. Once price trades all the way through a bullish FVG, that zone flips from support to resistance. A filled bearish FVG becomes support. The institutional orders that originally created the gap have been consumed, so the zone now acts as a barrier from the opposite direction.
What timeframe works best for FVG trading?
Higher timeframes (daily, four-hour) produce more reliable FVGs with stronger institutional backing. Most experienced ICT traders use the higher timeframe to identify the significant gaps and define the trade direction, then drop to the lower timeframe (fifteen-minute, five-minute) to time precise entries within those zones. The most reliable setups occur when a lower-timeframe FVG forms inside a higher-timeframe FVG.
How do fair value gaps relate to order blocks?
Fair value gaps and order blocks are complementary institutional signals that often appear near the same price levels. An order block shows where institutions placed large directional orders. A fair value gap shows where those orders created an imbalance in the market. When a fair value gap overlaps with an order block, the two signals confirm each other, producing one of the highest-probability entry zones in the ICT/SMC framework.
Get Your Free Trading Resources
Grab the free trading journal template plus the same tools we use to stay organized, consistent, and objective.
- Free trading journal template
- Custom indicators, watchlists, and scanners
- Access our free trading community
Enter your email below to get instant access.
No spam. Unsubscribe anytime.







