Cup and Handle Pattern: How to Trade It (2026 Guide)
The cup and handle is a bullish continuation pattern that William O’Neil popularized and Mark Minervini used to win multiple U.S. Investing Championships. The setup looks simple on a chart, but the difference between a tradable cup and handle and a label-only one comes down to timeframe, volume, and the math behind the entry.
Key Takeaways
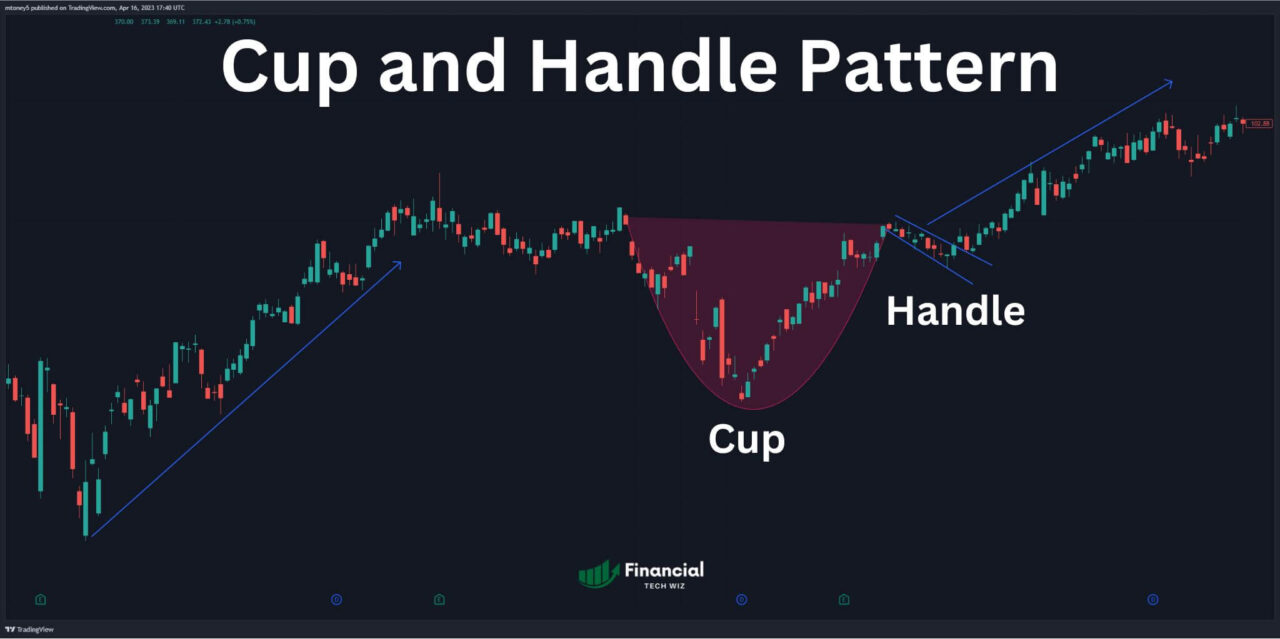
- The cup and handle is a bullish continuation pattern that forms after a prior uptrend, with a rounded U-shaped cup followed by a tight downward handle.
- Reliable cup and handles live on daily and weekly charts. Lower-timeframe versions fail more often because they lack the buyer base needed to push and hold above resistance.
- A valid breakout requires expanding volume on the breakout candle, not flat volume. Combine the volume filter with a fixed risk plan and the pattern becomes repeatable.
Recommended Tool
Financial Tech Wiz Trading Journal
Tag every cup and handle setup, log volume conditions and breakout outcomes, and see which pattern variations actually pay over time. Starting at $9.91/month billed annually.
Try It FreeThe Origins of the Cup and Handle: O’Neil’s Legacy and Minervini’s VCP
The cup and handle pattern gained widespread recognition thanks to William O’Neil, who introduced it in his book “How to Make Money in Stocks”. The pattern’s core idea (consolidation building toward a decisive breakout) resonates with the Volatility Contraction Pattern (VCP) introduced and popularized by Mark Minervini.
The VCP shares its core thesis with the cup and handle: consolidation followed by a breakout. Both patterns are staples in the toolkit of successful traders, and Mark Minervini’s trading strategy further complements the principles of the cup and handle.
Identifying the Cup and Handle Pattern
The best way to spot a cup and handle formation is to find a stock that was in an uptrend and is now consolidating. The pattern is most reliable on the daily or weekly chart, where the cup forms over weeks or months instead of hours.
Each component matters:
- The Cup: A soft “U” shape, not a sharp “V”. The U signals real consolidation as buyers and sellers find balance. The V signals a panic-and-snap-back move that lacks the institutional accumulation a real cup represents. If the cup looks more like a V, treat it as a different setup.
- The Handle: A small downward drift after the cup completes, sitting in the upper half of the cup’s range. The handle is much smaller than the cup and rarely retraces more than 15% from the cup’s high.
Spotting a cup and handle is much easier with extensive charting tools. TradingView’s auto chart pattern recognition can flag the formation for you, like this example on the Bitcoin chart:
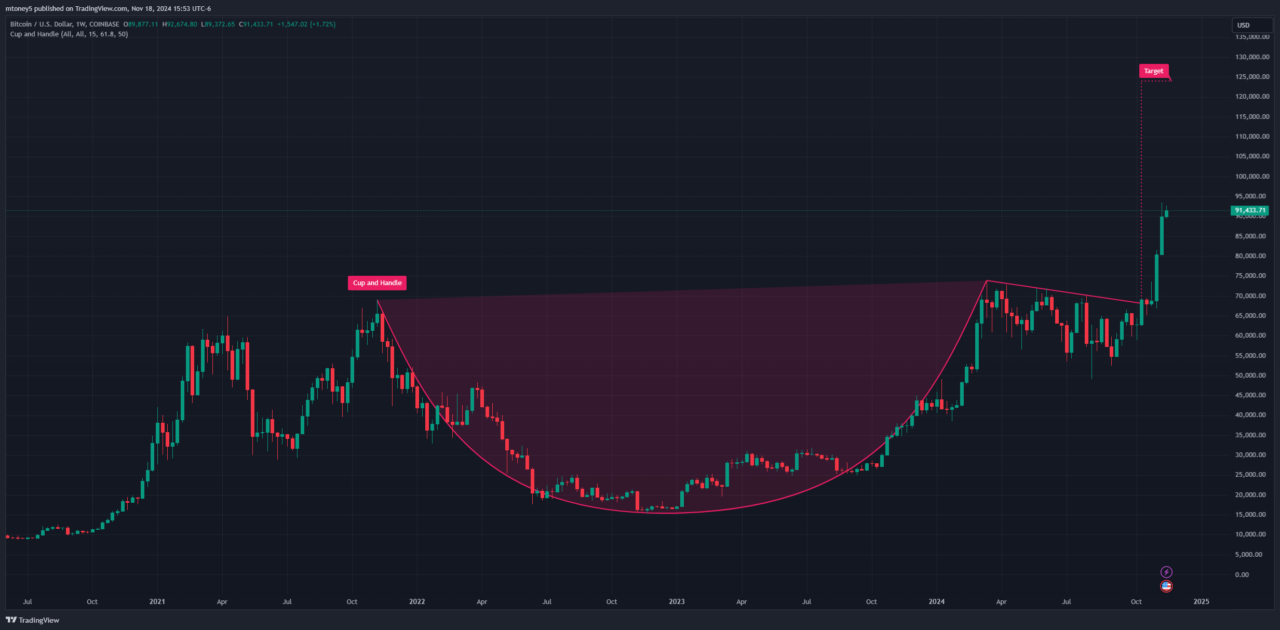
Spot cup and handle patterns with ease using TradingView’s automatic chart pattern recognition feature.
Start Charting with TradingView NOWIs the Cup and Handle Bullish or Bearish?
The cup and handle is a bullish continuation pattern. It signals the likelihood of an upward price move after a period of consolidation. Traders look for the formation as a setup to enter long positions ahead of the breakout. The standard pattern is bullish; the inverted version (covered below) is bearish.
Best Timeframes for the Cup and Handle
The cup and handle is a swing-trading and position-trading pattern, not an intraday setup. The strongest, most reliable formations show up on daily and weekly charts, where the cup forms over weeks or months and gives buyers and sellers enough time to drain conviction out of the move. O’Neil’s original definition specified a cup duration of 7 to 65 weeks, with handles running 4 days to 4 weeks. That weekly bias is not academic: it filters out the noise that breaks intraday patterns.
On a 5-minute or 15-minute chart, a “cup and handle” is usually just a rounded bottom in a sideways range, with no volume profile or institutional accumulation behind it. Breakouts on those timeframes fail more often because they lack the buyer base needed to push and hold above resistance. If you trade lower timeframes for entries, use the daily chart to identify the pattern and the lower chart to refine the trigger. The pattern itself lives on the higher timeframe.
How to Trade the Cup and Handle Pattern
The proper time to enter is when price breaks out above the handle. Once in the trade, the work is figuring out where to set stop-loss and take-profit orders.
When to Take Profit
The target for the cup and handle is the difference between the bottom of the cup and the breakout level. For example, if the distance between those two levels is $20, set a limit order to take profit when the stock advances 20 points above the handle.
Where to Set Your Stop
Depending on your risk tolerance, set a stop below the handle low or below the cup low. The pattern is no longer valid if price closes below either reference level.
Volume Confirmation: How to Tell a Real Breakout from a Trap
Volume separates a real cup and handle breakout from a trap. The healthy volume profile through the pattern looks like this: heavy volume on the initial drop into the cup, declining volume across the bottom and right side of the cup as sellers exhaust, even lower volume on the handle pullback (drying up to a near-floor), then a sharp expansion in volume on the breakout candle.
If price breaks above the handle on weak or average volume, treat it as suspect. False breakouts often print on flat volume because there is no fresh buyer base committing capital, just stop-runs and short-cover noise. Price comes back into the handle within one to three sessions and the pattern is dead.
A useful filter: require breakout volume of at least 40% to 50% above the 50-day average volume on the daily chart. Some traders set the bar higher at 100%. The exact threshold matters less than the principle: low-volume breakouts are not breakouts. Track every cup and handle attempt in the Financial Tech Wiz Trading Journal so you can see which volume conditions actually pay over time.
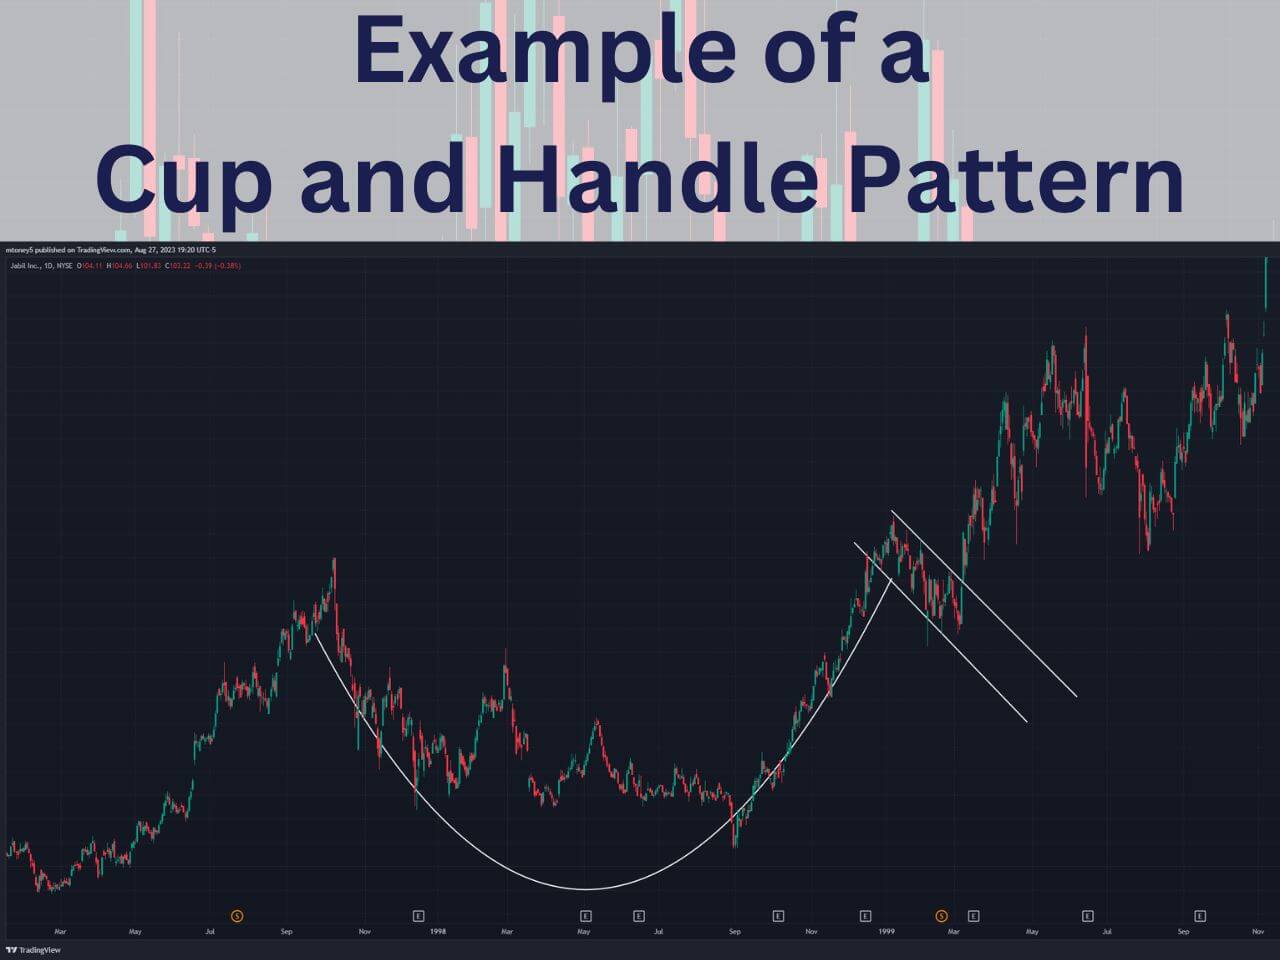
Cup and Handle Trade Example: Entry, Stop, Target
Walk through a clean setup. A stock runs up to a high of $50, pulls back to $40 over six weeks, rounds back to $50, then prints a tight handle with a low of $48 over four trading sessions.
Pattern math:
- Cup depth: $50 minus $40 equals $10
- Breakout level: $50 (top of the handle and prior high)
- Entry: limit buy at $50.10, just above the breakout
- Stop loss: $47.90, below the handle low (risk: $2.20 per share)
- Profit target: $50 plus the $10 cup depth equals $60
- Reward: $9.90 per share
- Risk to reward: 1 to 4.5
Position size off the dollar risk per share, not off the share price. If your account allows $400 of risk on this setup, you size for 181 shares ($400 divided by $2.20). Run the entry, stop, and target through the risk/reward calculator to size the position before you take the trade. If volume confirms on breakout, take the entry; if volume is flat, skip.
This is the discipline that turns the pattern from a label on a chart into a repeatable trade. If you are not yet ready for a paid journal, the free trading journal template for Google Sheets is a solid starting point.
Get Your Free Trading Resources
Grab the free trading journal template plus the same tools we use to stay organized, consistent, and objective.
- Free trading journal template
- Custom indicators, watchlists, and scanners
- Access our free trading community
Enter your email below to get instant access.
No spam. Unsubscribe anytime.
Common Mistakes and False Breakout Checklist
Trading is never perfect, and the cup and handle is one of the most over-labeled patterns on retail charts. The setups that fail tend to fail for the same handful of reasons:
- V-shaped cup: A sharp drop and snap-back is not a cup. Real cups round out as conviction drains.
- Handle too deep: A handle that retraces more than 15% from the cup high signals continued selling, not a final shake-out.
- No prior uptrend: The pattern requires a prior advance to consolidate. Without it, the rounded base is a different pattern (potential reversal, not continuation).
- Flat-volume breakout: The single most common reason a breakout fails. If volume does not expand above the 50-day average, the breakout has no buyer base.
- Drifting handle: If the handle drifts sideways for weeks, the formation may be transitioning into a triangle chart pattern instead, which trades differently.
You can check out my detailed video explaining the cup and handle pattern below:

Cup and Handle vs. Inverse Cup and Handle
The Inverse Cup and Handle is the bearish counterpart to the classic cup and handle. While the standard pattern signals a bullish continuation, the inverse points to a potential bearish reversal.
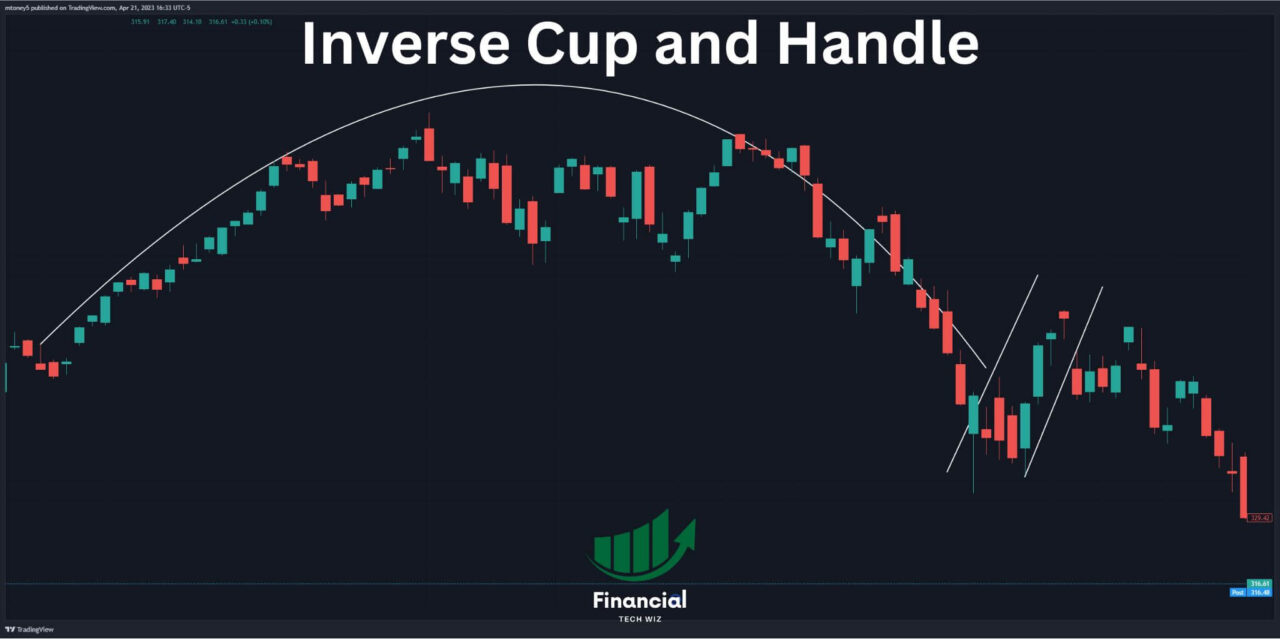
The key distinction is the anatomy: the cup and handle resembles a tea cup with a rounded bottom and a small upward handle, while the inverse appears as an upside-down cup with a rounded top and a small downward handle. Both patterns offer valuable insight into potential breakouts; their implications for market direction are inversely related.
Similarities with the Volatility Contraction Pattern
Both the cup and handle and the VCP indicate periods of consolidation followed by a breakout. The VCP emphasizes the contraction of volatility and decreasing trading ranges, leading to a decisive price move.
Continuation setups like the rectangle pattern measure the breakout target the same way the cup and handle does: project the height of the consolidation upward from the breakout point. The rectangle is the simpler cousin, with two flat parallel lines instead of a rounded base, but the trade math is identical.
The Cup and Handle Pattern: Bottom Line
The cup and handle has a high probability of playing out when the structure is clean and volume confirms. The pattern is trusted by professional traders and helped Mark Minervini win multiple U.S. Investing Championships.
To trade it consistently, you need a reliable charting platform to spot the formation and a structured journal to track which versions of the setup actually work for your style. TradingView is one of the strongest charting platforms available, and it is free to use at the base tier. For the volume profile and other advanced indicators, check TradingView’s pricing if you are serious about taking your trading to the next level.
The cup and handle tracks bullish continuation. When price shows signs of exhaustion at the top of a trend rather than consolidation, the head and shoulders pattern identifies the bearish reversal signal with comparable structural clarity.
Cup and Handle Pattern FAQ
Is cup and handle a bullish pattern?
Yes. Cup and handle is a bullish continuation pattern that signals a likely breakout to the upside after a period of consolidation. The standard version is bullish; the inverted version is bearish.
Can a cup and handle form in a downtrend?
No. The pattern requires a prior uptrend. Without an existing advance to consolidate, there is no cup, no handle, and no setup to trade. A rounded bottom in a downtrend is a different pattern (potential reversal, not continuation).
What are the requirements for a cup and handle pattern?
William O’Neil’s original definition specifies cup length of 7 to 65 weeks with a soft U-shape, handle of 4 days to 4 weeks, cup depth no more than 33% of the prior advance, and handle depth in the upper half of the cup (no more than 15% retracement from the cup high).
What timeframe works best for the cup and handle pattern?
Daily and weekly charts. The pattern needs weeks to months of consolidation to be reliable, which means lower timeframes (5-minute, 15-minute, hourly) usually do not produce tradable cup and handles. Use the daily for pattern identification and a lower timeframe only to refine the breakout entry.
How do you confirm a cup and handle breakout?
Volume. A valid breakout prints with expanding volume on the breakout candle, ideally 40% or more above the 50-day average. Volume should be drying up through the handle and surge on the move above resistance. A breakout on flat or below-average volume usually fails inside one to three sessions.
What is the success rate of the cup and handle pattern?
Backtests on bullish-market conditions show high success rates when the pattern is identified strictly (weekly chart, valid cup proportions, volume confirmation, prior uptrend). Real-world results vary because most cup and handles traders spot are loose interpretations. The pattern works; sloppy pattern recognition does not.
Get Your Free Trading Resources
Grab the free trading journal template plus the same tools we use to stay organized, consistent, and objective.
- Free trading journal template
- Custom indicators, watchlists, and scanners
- Access our free trading community
Enter your email below to get instant access.
No spam. Unsubscribe anytime.


