The 6 Best Indicators for Day Trading
Day trading is a style of trading that involves opening and closing positions within the same day, taking advantage of small price movements in the market.
In this article, we will discuss some of the best indicators for day trading, how they work, and how to use them on the best charting platform available.
The Best Charting Platform With Integrated Indicators
One of the most important tools for day trading is a reliable and powerful charting platform that allows you to access real-time data, customize your charts, and apply various indicators to analyze the market. There are many charting platforms available online, but one of the best ones is TradingView.
TradingView is a web-based platform that supports all markets, including stocks, forex, futures, cryptocurrencies, and more. It offers advanced features such as multiple chart types, drawing tools, alerts, backtesting, and more. You can read my article on the best TradingView indicators for day trading to learn more.
TradingView is free to use, but you can also upgrade to a premium plan to access more features and indicators. If you use our link to sign up, you will get a discount and a free trial of TradingView’s premium features and indicators.
The Best Indicators for Day Trading
There are hundreds of indicators that you can use for day trading, but not all of them are equally useful or effective. Some of the best indicators for day trading include the volume profile, auto fib retracements, simple moving averages, exponential moving averages, the Ichimoku clouds, and the VWAP.
Auto Fibonacci Retracements
Fibonacci retracements are a popular tool among traders that use the Fibonacci sequence to identify potential support and resistance levels in the market. The Fibonacci sequence is a series of numbers that starts with 0 and 1, and each subsequent number is the sum of the previous two numbers (e.g., 0, 1, 1, 2, 3, 5, 8…).
The Fibonacci ratios are derived from dividing one number in the sequence by another number that is one or more places to the right (e.g., 1/2 = 0.50, 3/8 = 0.38, 5/13 = 0.38…). The most common Fibonacci ratios used by traders are 23.6%, 38.2%, 50%, 61.8%, and 78.6%.
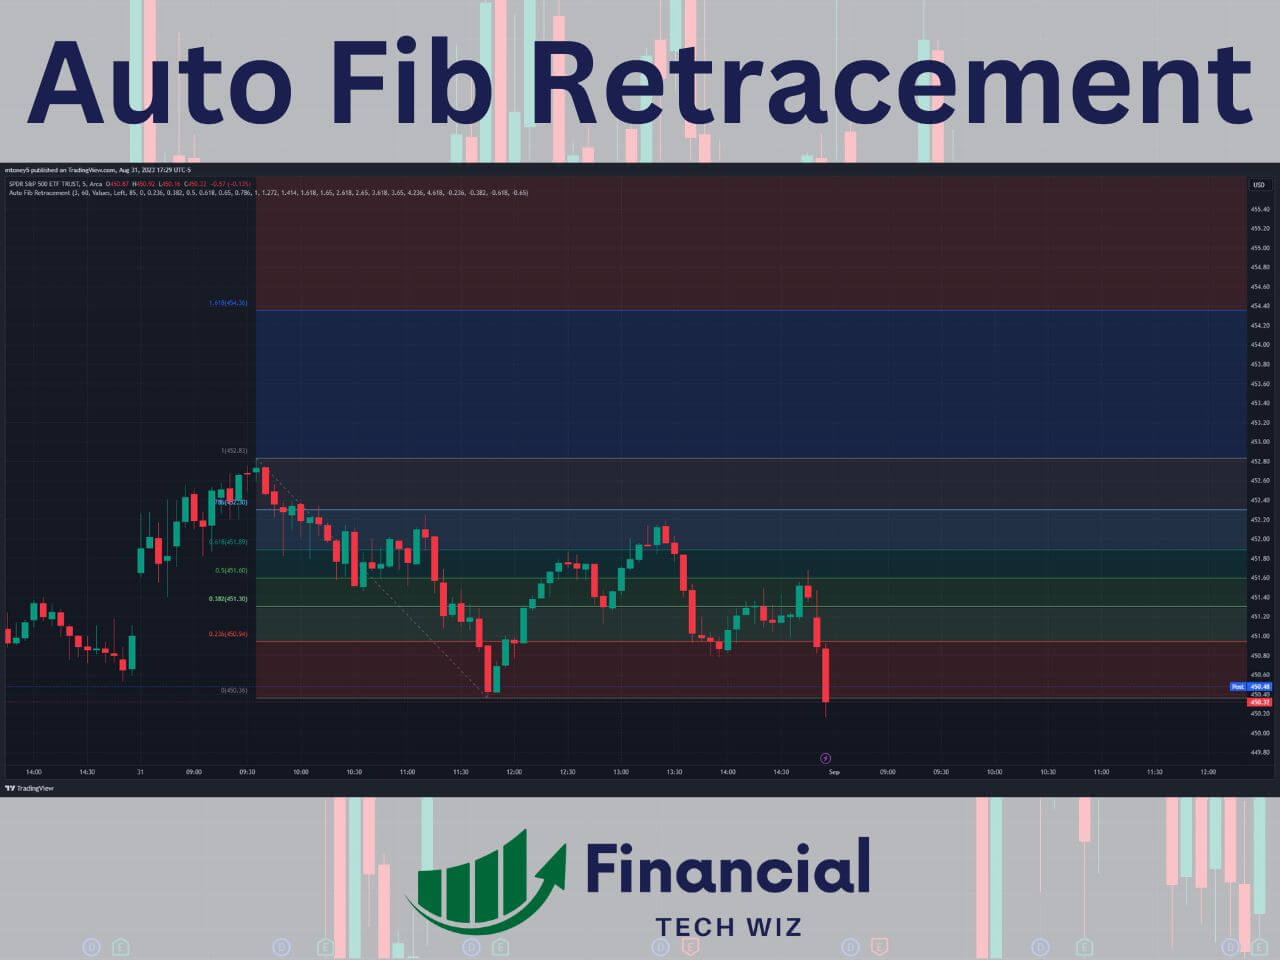
The normal way to draw Fibonacci retracements is to identify a significant high and low point in the price movement (also known as swing points) and connect them with the Fibonacci drawing tool.
However, drawing Fibonacci retracements manually can be tedious and time-consuming, especially for day traders who need to constantly update them as the market changes. That’s why using an auto Fibonacci retracement indicator is extremely useful for day traders. Check out our complete article on Fibonacci retracements for more information.
Volume Profile
Volume profile is another useful indicator for day trading that shows you how much volume was traded at each price level over a given period of time. It helps you understand where supply and demand zones are in the market and how they affect the price movement.
The main parts of the volume profile indicator are the volume point of control (VPOC), the high volume node (HVN), and the low volume node (LVN). The VPOC is the price level where the most volume was traded, indicating a balance between buyers and sellers.
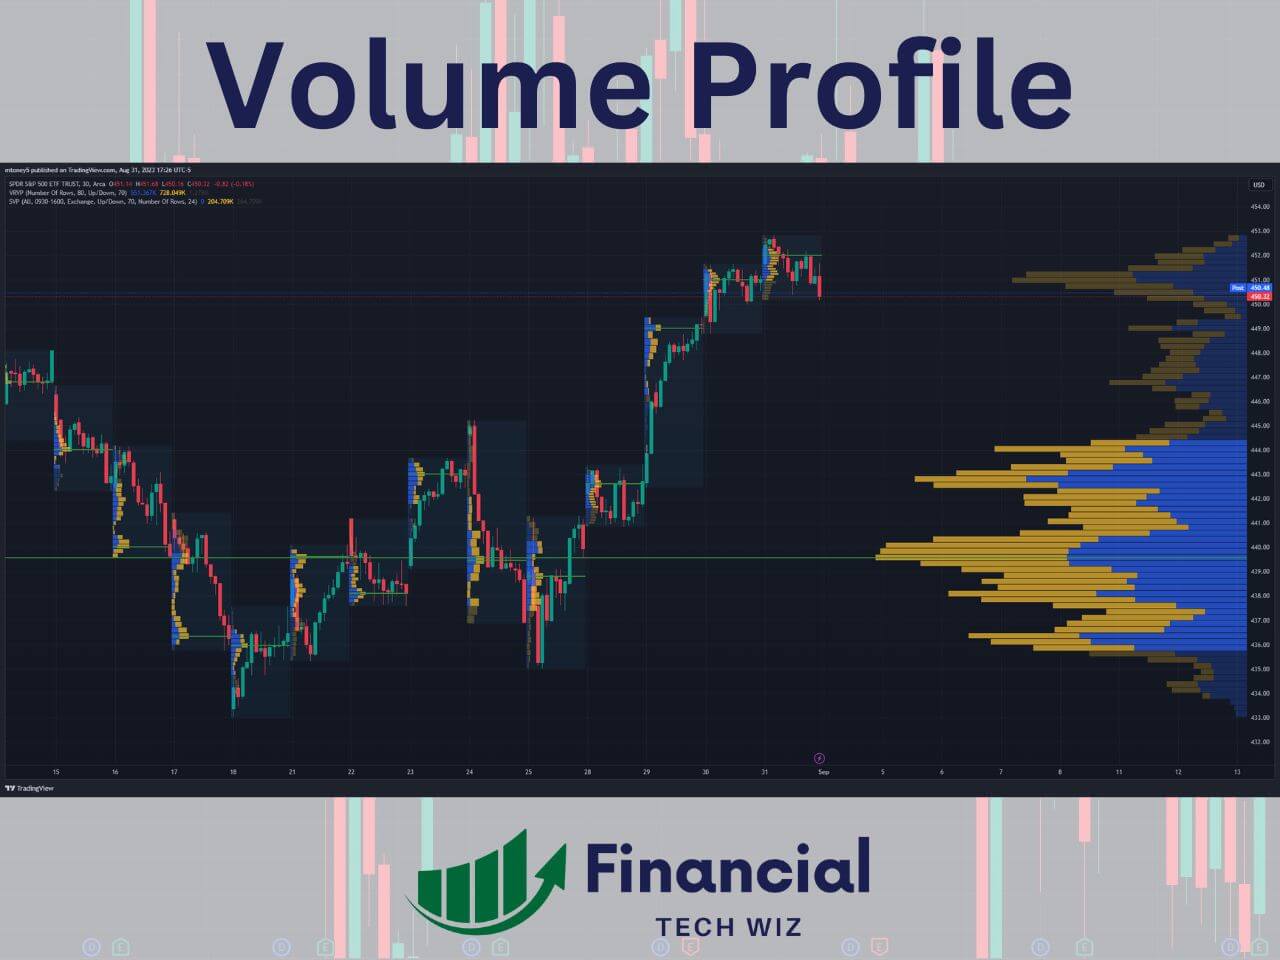
The HVN is a price level where a lot of volume was traded, indicating a strong interest or activity in the market. The LVN is a price level where little volume was traded, indicating a lack of interest or activity in the market.
The volume profile indicator can help you identify potential support and resistance levels based on the volume distribution. For example, when the price is above an HVN, it acts as support. When the price is below an HVN, it acts as resistance. When the price moves from an LVN to an HVN or vice versa, it indicates a breakout or a reversal.
There are different types of volume profiles that you can use for day trading, depending on your time frame and preference. The most common ones are the session volume profile and the visible range volume profile.
The session volume profile shows you the volume profile for each trading day, while the visible range volume profile shows you the volume profile for everything visible on the chart.
The best way to use the volume profile indicator for day trading is with TradingView, as it offers a built-in volume profile tool that you can easily customize and apply to any market.
For more information on how to use the volume profile indicator on TradingView, you can check out our article on TradingView Volume Profile.
Ichimoku Cloud
The Ichimoku cloud is an all-in-one indicator that provides entry and exit signals, support and resistance levels, and trend identification. It consists of five lines that form a cloud-like shape on the chart:
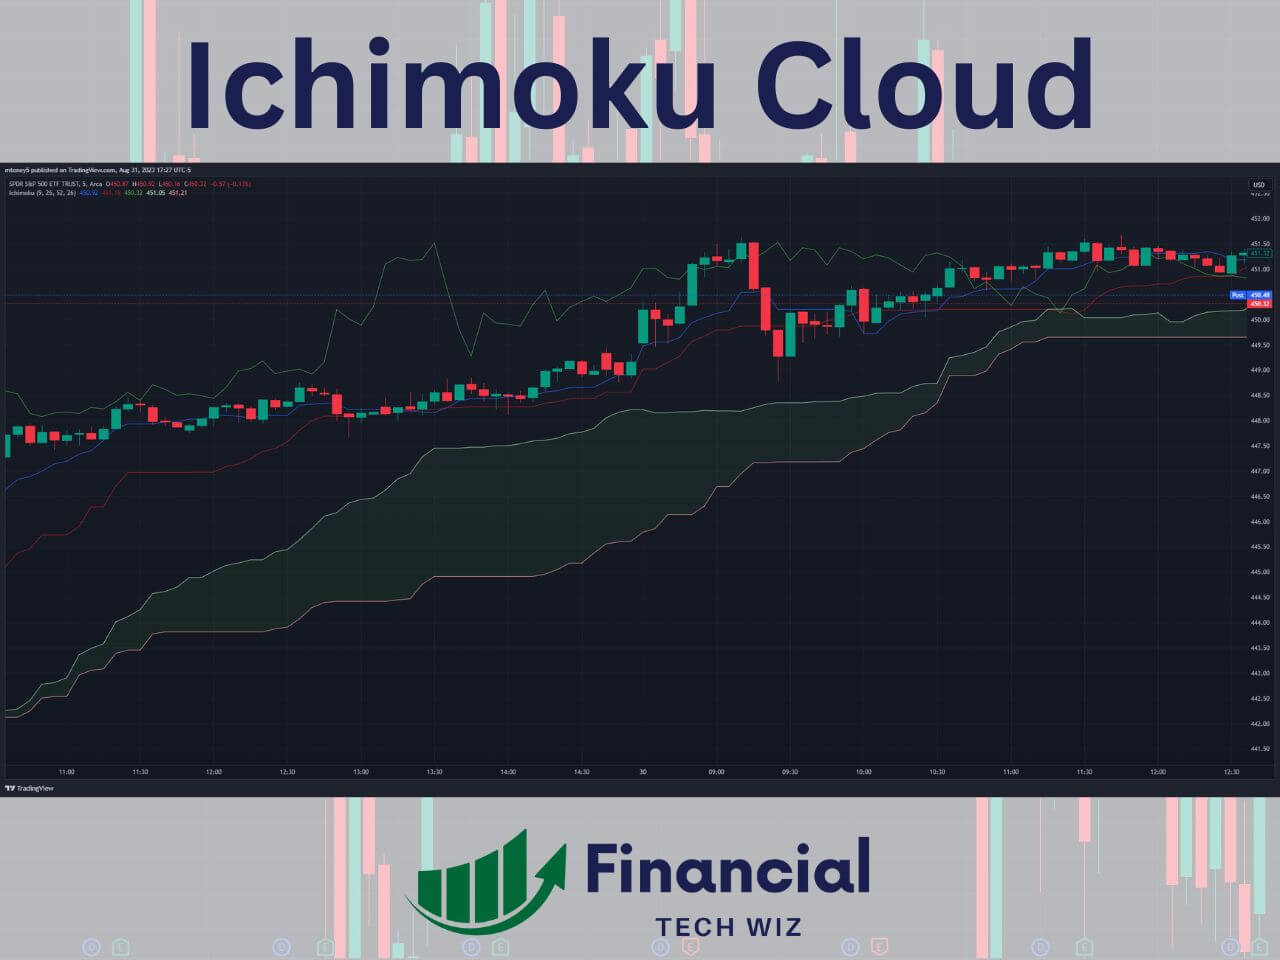
- The conversion line (Tenkan-sen) is the average of the highest high and the lowest low in the last nine periods.
- The base line (Kijun-sen) is the average of the highest high and the lowest low in the last 26 periods.
- The leading span A (Senkou span A) is the average of the conversion line and the base line, plotted 26 periods ahead.
- The leading span B (Senkou span B) is the average of the highest high and the lowest low in the last 52 periods, plotted 26 periods ahead.
- The lagging span (Chikou span) is the current closing price, plotted 26 periods behind.
The Ichimoku cloud indicator can help you identify trading opportunities based on various signals and rules. For example:
- When the conversion line crosses over the base line, it is a buy signal. When it crosses under the base line, it is a sell signal.
- When the price is above the cloud, it indicates an uptrend. When it is below the cloud, it indicates a downtrend. When it is inside the cloud, it indicates a consolidation or a transition.
- When the cloud changes color from red to green or vice versa, it indicates a potential trend reversal or continuation.
The Ichimoku cloud indicator works well for day trading because it adapts to different time frames and market conditions. You can use it to scalp, swing, or trend trade, depending on your preference and strategy.
The most common time frames for day trading with Ichimoku are the 1-minute chart for scalping and the 5-minute chart for day trades.
To learn more about how to use Ichimoku cloud for day trading, you can check out this Ichimoku Cloud Thinkorswim Guide.
Volume Weighted Average Price – VWAP
The volume weighted average price (VWAP) is an indicator that shows where “fair value” is for a stock on a particular day. It is calculated by multiplying each trade price by its volume and then dividing by the total volume traded on that day. It creates a single line that moves along with the price action.
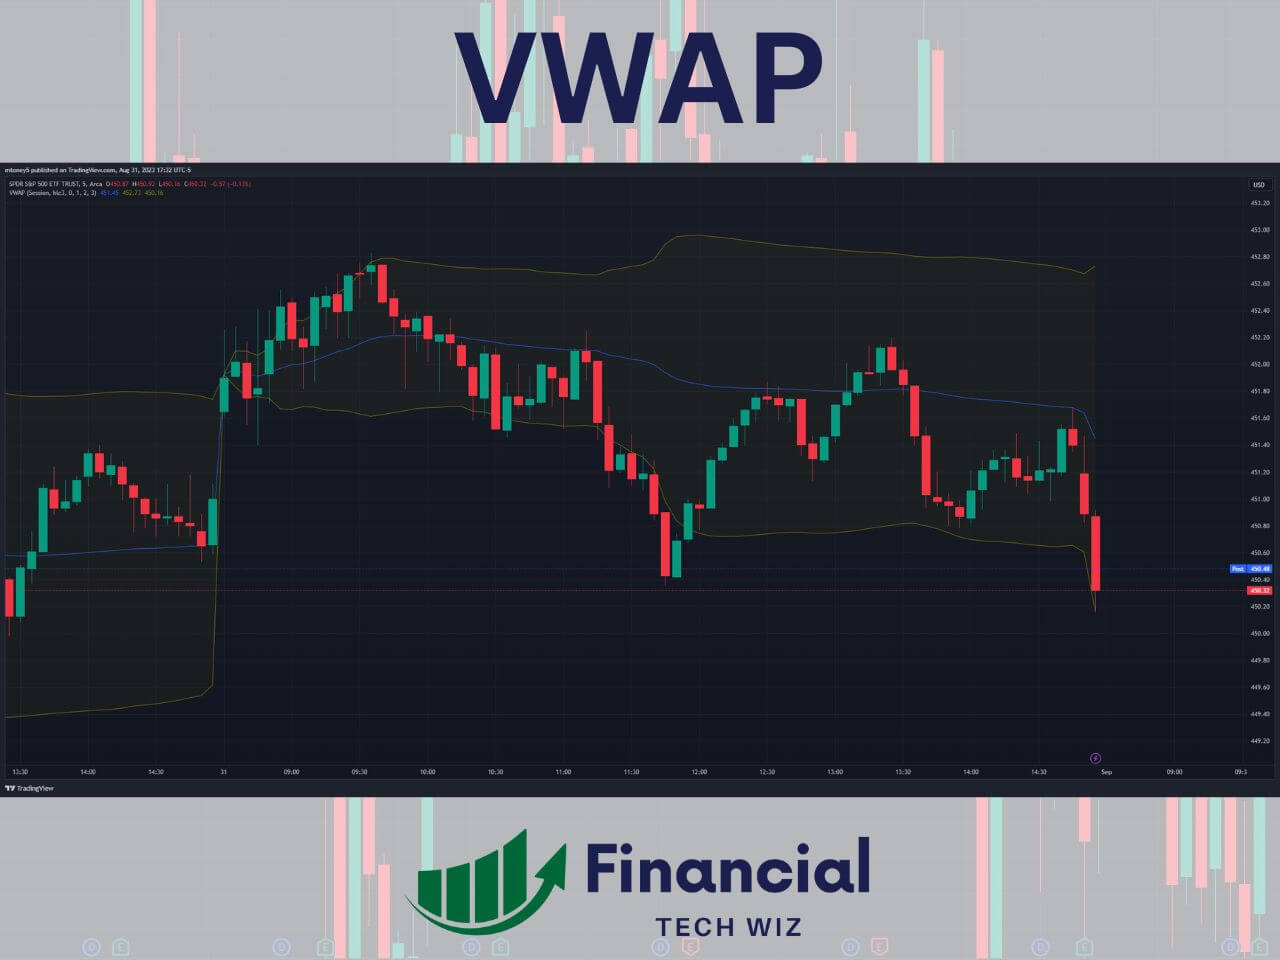
The VWAP indicator can help you identify potential support and resistance levels based on where the price is relative to the VWAP line. For example:
- When the price is above the VWAP line, it indicates that buyers are in control and that sellers may be willing to sell at lower prices.
- When the price is below the VWAP line, it indicates that sellers are in control and that buyers may be willing to buy at higher prices.
- When the price crosses over or under the VWAP line, it indicates a change in momentum or sentiment.
The VWAP indicator is especially useful for day trading because it reflects how much value was traded at each price level on that day. It helps you avoid buying too high or selling too low by showing you where most traders are trading. There is also the anchored VWAP indicator, which is similar but can be used on all timeframes.
Simple Moving Averages – SMA
Simple moving averages (SMA) are indicators that show the average price of a stock over a certain period of time. They help you identify the direction and strength of the trend, as well as potential support and resistance levels.
The most common SMA lines are the 50 and 200-day moving averages (i.e., the 50 and 200 SMA lines on a daily timeframe chart). These lines indicate the long-term trend of the market and are often used by investors and traders to make trading decisions
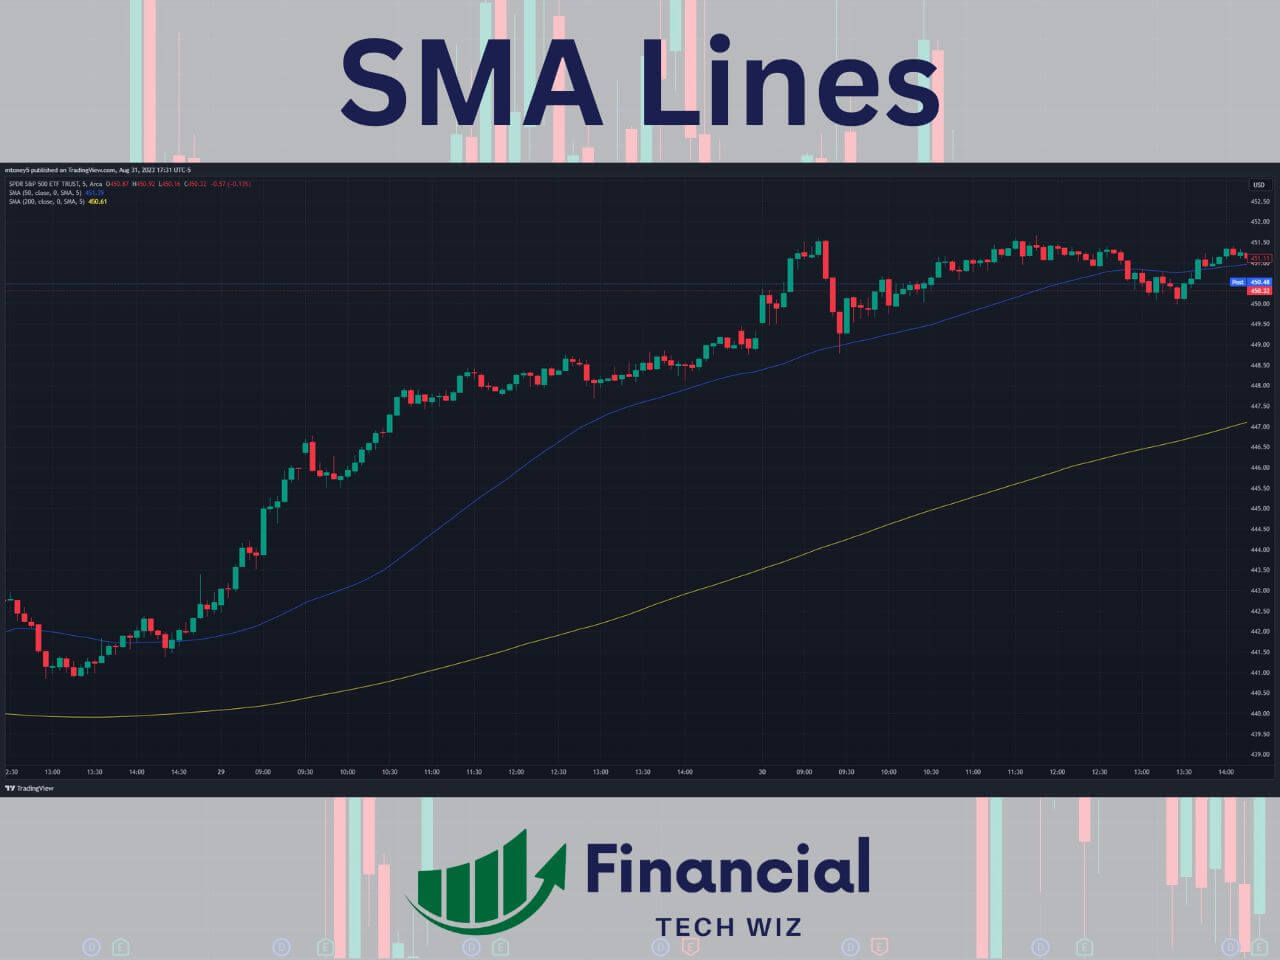
However, for day trading, you may want to use shorter time frames and periods for your SMA lines, as they will be more responsive to the price action and provide more signals.
For example, you can use the 1 or 5-minute time frame and apply the 50 and 200 SMA lines to your chart. These lines will act as support and resistance levels for day trading, as the price will tend to bounce or break from them.
To learn more about how to use simple moving averages for day trading, you can check out our article on TradingView moving averages.
Exponential Moving Averages – EMA
Exponential moving averages (EMA) are similar to simple moving averages, but they give more weight to the recent prices than the older ones. This makes them faster and more sensitive to the price action, which can be useful for day trading.
Exponential moving averages can also act as support and resistance levels for day trading, depending on where the price is relative to them.
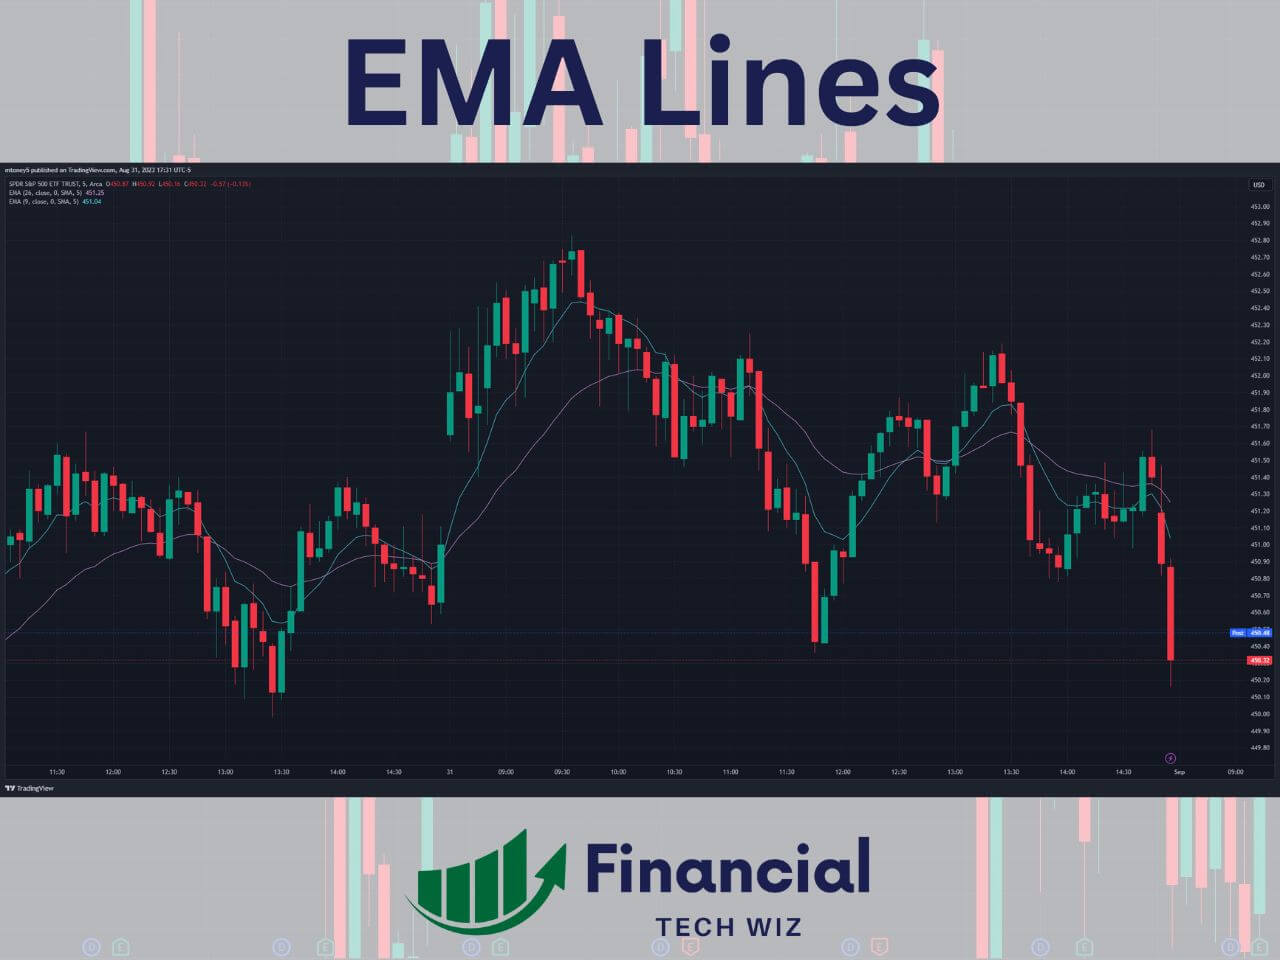
For example, you can use the 9 and 26-period EMAs, which are commonly used on the 1 and 5-minute time frame by day traders. These EMAs can help you identify entry and exit points based on their crossover or divergence.
For example:
- When the 9 EMA crosses over the 26 EMA, it indicates a bullish signal. You can buy when the price is above both EMAs and sell when it crosses below them.
- When the 9 EMA crosses under the 26 EMA, it indicates a bearish signal. You can sell when the price is below both EMAs and buy when it crosses above them.
- When the 9 EMA diverges from the 26 EMA, it indicates a strong trend. You can follow the trend until it converges again.
- When the 9 EMA converges with the 26 EMA, it indicates a weak trend or a consolidation. You can wait for a breakout or a reversal.
To learn more about how to use exponential moving averages for day trading, you can check out our article on TradingView moving averages.
The Best Charting Platform for Using Day Trading Indicators
As we have seen, there are many indicators that you can use for day trading, but not all of them are available or compatible with every charting platform. That’s why we recommend using TradingView as your main charting platform for day trading, as it offers many advantages over other platforms.
TradingView is a web-based platform that supports all markets and every indicator you can imagine with real-time data. It also allows you to customize your charts, create your own indicators, and backtest your strategies. It has a user-friendly interface and a responsive design that works on any device.
TradingView is free to use, but you can also upgrade to a premium plan to access more features and indicators. If you use our link to sign up, you will get a discount and a free trial of TradingView’s premium features and indicators.
We hope this article has helped you learn about some of the best day trading indicators and how to use them on TradingView. Remember that indicators are only tools that can help you analyze the market and make trading decisions, but they are not infallible or magic.
You still need to have a solid trading plan, risk management, discipline, and patience to succeed in day trading. You can also check out our article on the best TradingView indicators for more information.
– Free trading journal template & cheat sheet PDFs
– Custom scanners, watchlists, & market commentary
– Access our free trading course and community


