
Best Days in Stock Market History: SPY and QQQ Top 10

The biggest one-day rallies in stock market history almost never happen during calm bull markets. They happen during the worst drawdowns, when fear is stretched and a single catalyst (a rate cut, a stimulus bill, a tariff pause) snaps sentiment. This article ranks the top 10 best days in stock market history for the S&P 500 ETF (SPY) and the Nasdaq 100 ETF (QQQ), explains the catalyst behind each, and shows what happened to both ETFs one month and one year later.
Key Takeaways
- Nine of the top 10 single-day rallies for SPY and QQQ erupted during bear-market crises (the dot-com bust of 2000-2001, the 2008 credit crisis, the 2020 COVID crash, and the April 2025 tariff scare), not bull-market melt-ups.
- Forward returns after these explosive sessions are mixed: many were bear-market bounces that did not mark the final low, while a few (March 2020, April 2025) preceded sustained recoveries; one-year forward returns ranged from sharply negative to better than +30%.
- Missing the 10 best days in any given 20-year window has historically wiped out the majority of a buy-and-hold investor’s total return, which is why traders who panic-sell during sell-offs frequently underperform a journaled, rules-based approach.
Free Tool
Track every trade you take during a rally like this
Days like October 13, 2008 and April 9, 2025 reshape portfolios. A simple journal lets you see exactly how you played them, what worked, and what to do next time. Grab the free Google Sheets trading journal template to get started.
Get the free templateSummary of the Best Days in Stock Market History for SPY and QQQ
| Date | SPY | QQQ | Catalyst |
|---|---|---|---|
| 1/3/2001 | 4.80% | 16.84% | Fed emergency rate cut (50 bps surprise) |
| 4/9/2025 | 9.41% | 12.00% | 90-day tariff pause announced |
| 10/13/2008 | 14.52% | 12.17% | G7 coordinated bank recapitalization plan |
| 10/28/2008 | 11.69% | 11.05% | Treasury credit-market interventions |
| 12/5/2000 | 3.28% | 10.99% | Bargain-hunting amid dot-com selloff |
| 3/24/2020 | 8.68% | 7.74% | $2T Congressional stimulus bill advance |
| 3/13/2020 | 8.99% | 8.48% | COVID national emergency; Fed liquidity action |
| 4/5/2001 | 3.80% | 9.57% | Continued Fed rate-cut cycle |
| 4/18/2001 | 3.98% | 10.42% | Surprise Fed 50 bps emergency cut |
| 5/30/2000 | 3.42% | 10.06% | Post-peak bargain-hunting after dot-com slide |
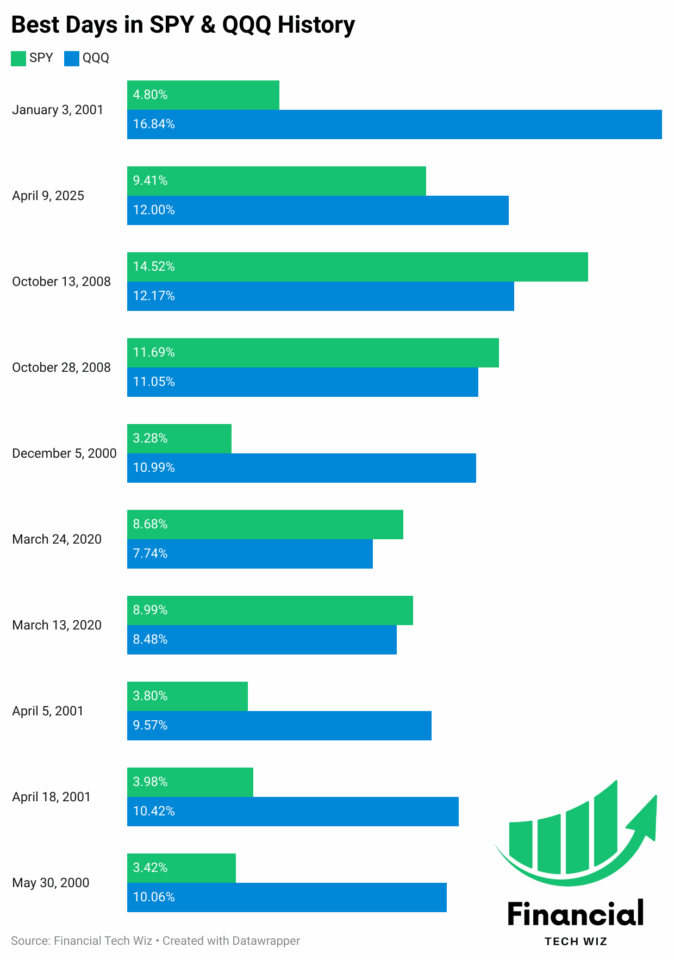
Top 10 Best Single-Day Gains for SPY and QQQ
1. January 3, 2001
- SPY: +4.80%
- QQQ: +16.84%
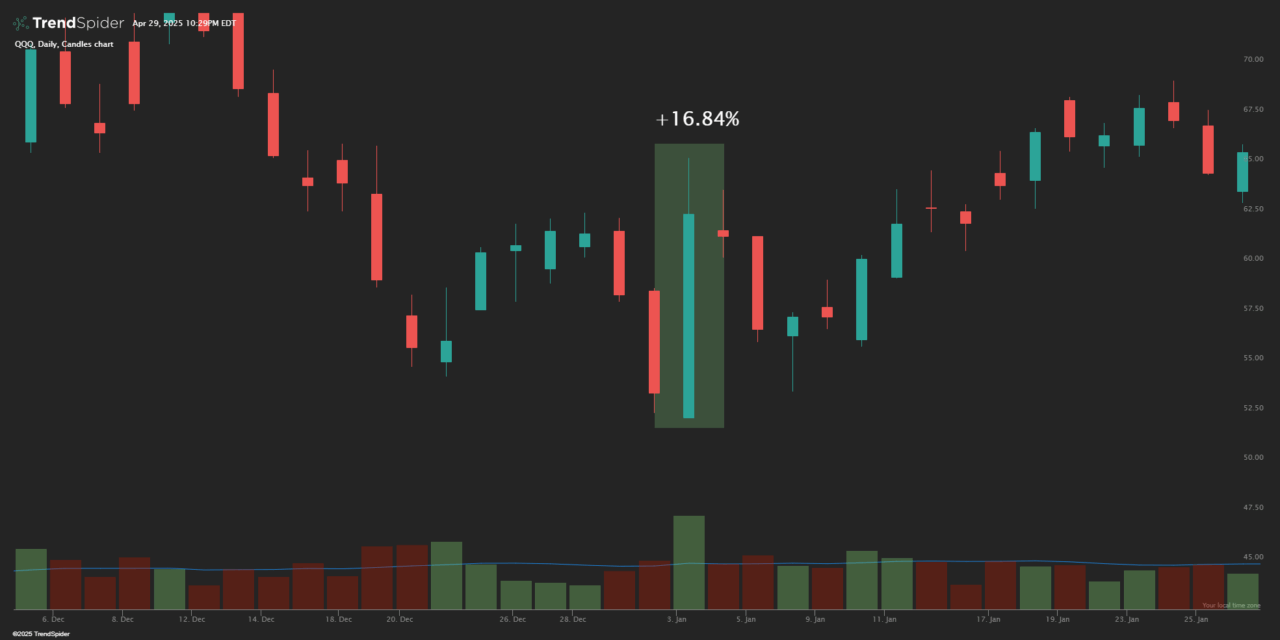
Amid the bursting of the dot-com bubble, the Federal Reserve surprised markets with an emergency 50-basis-point rate cut between scheduled meetings. The tech-heavy Nasdaq 100 exploded upward, with QQQ surging 16.84% in a single session: the largest one-day gain in QQQ’s history. The Nasdaq 100 sat roughly 45% below its March 2000 peak at that point, deep inside a bear market. The surprise cut restarted institutional buying after months of relentless selling in growth stocks. SPY gained a comparatively modest 4.80%, reflecting the broader market’s less extreme positioning. One year later, QQQ had given back 22.4% as the dot-com unwinding continued.
2. April 9, 2025
- SPY: +9.41%
- QQQ: +12.00%
When the Trump administration announced a 90-day pause on most reciprocal tariffs, markets responded with one of the most violent single-session rallies since World War II. SPY gained 9.41%, the third-largest one-day percentage gain in S&P 500 history, and QQQ surged 12.00%, its second-best session on record behind only the January 2001 Fed cut. The indexes had fallen roughly 19% from their February 2025 highs during the tariff escalation period, bringing sentiment to an extreme. Unlike many of the crisis-era rallies on this list, the April 9, 2025 move preceded a sustained recovery: one year later, SPY was up 36.9% from that close.
3. October 13, 2008
- SPY: +14.52%
- QQQ: +12.17%
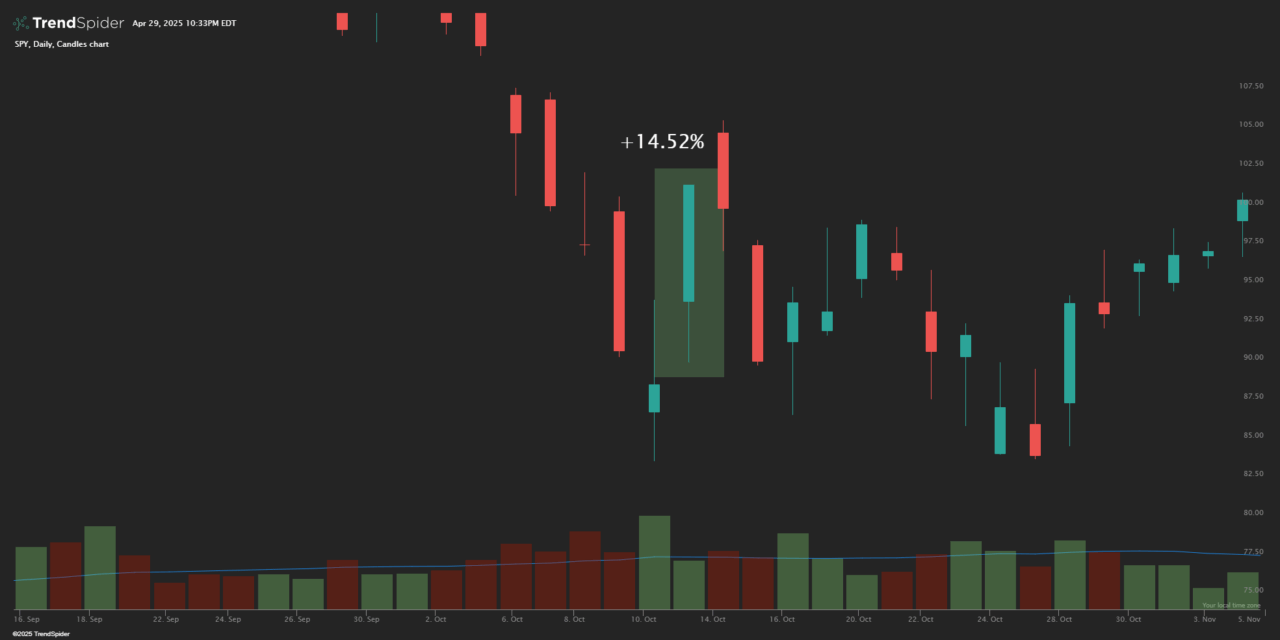
In the depths of the 2008 financial crisis, G7 governments unveiled coordinated bank recapitalization plans, triggering a historic relief rally. SPY gained 14.52%, its largest single-day percentage gain on record, with QQQ adding 12.17%. At that point the S&P 500 was down roughly 43% from its October 2007 peak, and short-selling pressure had been intense. The catalyst addressed the structural problem (bank solvency) rather than just providing liquidity, which distinguished it from earlier bounce attempts. Despite the scale of the move, it was a bear-market rally: one month later SPY had given back 11.4%, though a full year later the market had recovered 6.0%.
4. October 28, 2008
- SPY: +11.69%
- QQQ: +11.05%
Just two weeks after the October 13 session, another massive rally hit on October 28, 2008. SPY spiked +11.69% (its second-biggest gain on record) and QQQ jumped +11.05%. The catalyst was a continuation of Treasury and Federal Reserve credit-market interventions, combined with a wave of short-covering after SPY had declined an additional 17% from the October 13 close. Importantly, the indexes were still inside a bear market: the S&P 500 would not bottom until March 2009. One month after this session SPY was up only 2.0%, but one year later it had recovered 26.8%, reflecting the eventual bear-market trough that followed in Q1 2009.
5. December 5, 2000
- SPY: +3.28%
- QQQ: +10.99%
During the collapse of the dot-com bubble, tech stocks staged a fierce one-day comeback on December 5, 2000. QQQ rocketed +10.99%, one of its biggest sessions inside the 2000-2002 bear market, while SPY gained a more measured 3.28%. The Nasdaq 100 had already fallen more than 50% from its March 2000 peak, making absolute valuations attractive enough to draw institutional bargain-buying. There was no single policy catalyst; the move was primarily a technical bounce after an extended washout. The forward returns confirmed this: QQQ gave back 36.9% over the following year as the dot-com deflation continued. This rally was short-lived relief in a larger downtrend.
6. March 24, 2020
- SPY: +8.68%
- QQQ: +7.74%
On March 24, 2020, the S&P 500 surged +8.68% and QQQ jumped +7.74% as Congress neared passage of a $2 trillion stimulus package and the Federal Reserve announced broad liquidity programs. The S&P 500 had fallen 34% from its February 19 all-time high in just 33 days, the fastest bear-market descent on record. Unlike the October 2008 sessions, this date landed very close to the ultimate COVID bear-market low: SPY had bottomed on March 23, one day earlier. The forward returns reflect this: SPY gained 74.7% over the following year and QQQ gained 86.1%, both among the strongest 1-year returns in the dataset.
7. March 13, 2020
- SPY: +8.99%
- QQQ: +8.48%
On March 13, 2020 (Friday the 13th), the U.S. declared a national emergency over COVID-19, and President Trump’s announcement of emergency measures flipped mid-afternoon panic into a historic close-of-day surge. SPY gained +8.99% and QQQ +8.48%. However, this was a bear-market bounce rather than an inflection: the indexes made lower lows in the week that followed, with SPY falling an additional 8% before the March 23 ultimate low. One month after the March 13 session, SPY was up 11.1%, reflecting the V-shaped recovery that followed. The one-year return was +58.8% for SPY, capturing the full COVID-era recovery.
8. April 5, 2001
- SPY: +3.80%
- QQQ: +9.57%
The spring of 2001 produced two separate entries in the top 10 as the Federal Reserve continued aggressively cutting rates. On April 5, 2001, the Nasdaq 100 surged +9.57% and SPY gained +3.80%, fueled by anticipation of further Fed easing. The Nasdaq 100 was roughly 60% below its March 2000 peak, deep inside the dot-com bear market, and rate-cut momentum was creating periodic violent bounces. The one-month forward return for QQQ was an extraordinary +41.6%, partly because April 18 produced another massive rally (see the next entry). The one-year forward, however, showed QQQ down 3.1%, as the bear market had not yet found its floor.
9. April 18, 2001
- SPY: +3.98%
- QQQ: +10.42%
Just two weeks after the April 5 rally, the Fed executed a second surprise 50-basis-point emergency rate cut between meetings, igniting another massive session. QQQ surged +10.42% and SPY gained +3.98%. This was the Fed’s second inter-meeting cut that year (following January 3), underscoring how aggressively it was responding to the tech-sector collapse. The Nasdaq 100 had briefly bounced from its April lows after the previous rate-cut news, and the surprise second cut amplified the move. Despite the back-to-back rallies, the Nasdaq 100 had not found its ultimate bear-market low; QQQ gave back 20.0% over the following year as the 2001-2002 cycle continued lower.
10. May 30, 2000
- SPY: +3.42%
- QQQ: +10.06%
Coming off the Memorial Day weekend in 2000, investors staged a massive tech rally. QQQ surged +10.06%, which at the time was the Nasdaq 100’s largest single-day percentage gain since its inception in 1971. The Nasdaq had declined roughly 37% from its March 2000 peak by late May, and bargain-buying after the long holiday weekend drove the move. There was no single policy catalyst; valuations and short-covering provided the fuel. SPY gained a more modest 3.42%. The forward returns underscore that this was firmly a bear-market bounce: QQQ fell 48.1% over the following year as the dot-com deflation entered its most severe phase.
1-Month and 1-Year Forward Returns After Each Best Day
The table below shows what SPY and QQQ did in the 30 trading days and 12 months after each of the best days in stock market history. All returns are computed from the closing price on the event date to the closing price approximately 21 trading days (1 month) and 252 trading days (1 year) later, sourced from Yahoo Finance historical data.
| Date | SPY 1-Month | SPY 1-Year | QQQ 1-Month | QQQ 1-Year |
|---|---|---|---|---|
| Jan 3, 2001 | +7.1% | -9.5% | +21.9% | -22.4% |
| Apr 9, 2025 | +13.8% | +36.9% | +17.4% | +46.9% |
| Oct 13, 2008 | -11.4% | +6.0% | -14.3% | +21.2% |
| Oct 28, 2008 | +2.0% | +26.8% | -1.8% | +47.6% |
| Dec 5, 2000 | +0.2% | -14.2% | -5.7% | -36.9% |
| Mar 24, 2020 | +25.2% | +74.7% | +23.8% | +86.1% |
| Mar 13, 2020 | +11.1% | +58.8% | +14.5% | +77.9% |
| Apr 5, 2001 | +14.9% | -0.2% | +41.6% | -3.1% |
| Apr 18, 2001 | +8.1% | -7.3% | +14.3% | -20.0% |
| May 30, 2000 | +2.1% | -12.1% | +9.9% | -48.1% |
The pattern in this data is clear. The worst 1-year forward returns clustered around the dot-com era sessions (2000-2001), where the bear market had not yet found its structural floor. The October 2008 sessions produced negative 1-month returns (the market made lower lows in November and March) but recovered strongly over 1 year once the financial crisis trough was reached. The strongest forward returns came from the two COVID sessions and the April 2025 tariff-pause day: all three landed close to fundamental inflection points where the underlying catalyst had been addressed. The implication for traders: the size of the rally on the event day tells you very little about whether it is a sustained bottom or just a bear-market bounce. The catalyst quality and the level of resolution it provides matters far more.
Bear-Market Bounce vs. Sustained Rally
A bear-market bounce is a sharp upward move inside a longer downtrend, often called a “dead-cat bounce” if it fades quickly. Distinguishing one from the start of a new uptrend is one of the hardest problems in active trading, and the history above illustrates why.
The October 13 and 28, 2008 sessions and the March 13, 2020 session were bear-market bounces: each was followed by lower lows before the ultimate trough. The March 24, 2020 session and the April 9, 2025 session were closer to inflection points: neither saw a meaningful retest of the prior low after the rally. The key distinguishing factor was whether the underlying problem had been structurally addressed. In March 2020, the $2 trillion CARES Act and Fed facilities directly backstopped the economy. In April 2025, the tariff pause removed the immediate escalation risk. In October 2008, the bank recapitalization plan helped, but the credit system was still unwinding, and more months of negative surprises remained.
A few signals help separate the two in real time: breadth (what percentage of stocks participated in the rally, not just the headline indices), volume (a breadth thrust on above-average volume is more convincing than a low-volume pop), follow-through in the sessions after the big day (5 to 10 sessions of net positive action), and whether the catalyst addressed the underlying structural problem rather than just providing short-term relief. Mark Minervini’s swing-trading playbook treats the breakout session itself as a momentum signal to monitor, with real confirmation coming from the constructive action in the days that follow rather than from the event-day gain alone.
For active traders
Log your real plays around volatility events
The Financial Tech Wiz Trading Journal connects to 25+ brokers, imports your trade history automatically, and shows your win rate and P&L by symbol and hold duration. Built for traders who want to know if their crisis-rally playbook actually works.
See the journalHow Traders Can Position for Outlier Up Days
Outlier up days tend to be gap-up sessions: price opens significantly higher than the prior close and then builds on the gain throughout the day. This creates a fundamental tension for active traders. Limit-buy orders set inside the prior day’s range often miss the entire move. Market-on-open orders catch the gap but accept the worst possible fill. Three practical approaches help navigate this:
First, scaling rules that allow adding exposure over the first 30 to 60 minutes rather than chasing the open. If the session is genuinely a trend inflection, the first 30 minutes of action will typically hold above the open price. If it fades quickly (common in bear-market bounces), scaling in over time limits the damage from a poor entry. Second, trailing stops rather than fixed-dollar stops: on a day when the market is moving 8-14%, a fixed $2 stop is meaningless. A trailing stop tied to a percentage of the session’s range or a moving intraday level keeps the trade alive if the move is real and gets you out quickly if it reverses. Third, options behavior: on high-volatility event days, implied volatility is elevated at the open. Call premiums often expand violently in the first 30 minutes and then suffer IV crush later in the session, making opening-print debit positions expensive. Selling into elevated premium or waiting for IV to normalize before entering long options positions is a more efficient approach on these days.
Mark Minervini’s volatility-contraction-pattern framework treats these breakout sessions as confirmation of a base, not an entry trigger. The VCP pattern requires a series of tighter consolidations before the breakout; a panic-day rally that has not built a constructive base first is often a false signal. Traders who journal these high-volatility entries and exits accumulate a personal data set over time that reveals which catalyst types and which market contexts produce follow-through, and which ones fade.
Why Missing the 10 Best Days Costs So Much
Studies of S&P 500 returns over rolling 20-year windows consistently show the same result: an investor who stays fully invested earns close to the index’s full annualized return, while an investor who misses just the 10 best sessions cuts long-term total return by more than half. Missing the 30 best sessions can turn a positive long-term return negative. Set against how many trading days there are in a year, roughly 251, ten sessions out of about five thousand across two decades is a rounding error that decides the whole outcome. Because those best days cluster near the worst drawdowns (as this top-10 list confirms), panic-selling during a crash often means exiting before the rebound and then sitting out the explosive up day that follows.
For buy-and-hold investors, the implication is straightforward: staying invested through volatility is mechanically superior to timing the market. For active traders, the equivalent insight is more nuanced. Active traders are not trying to catch every outlier day; they are trying to catch the right ones while managing downside on the wrong ones. The lever is not raw market exposure but a rules-based re-entry framework: a journal that records exit conditions and the corresponding re-entry trigger forces disciplined rebuilding rather than leaving re-entry timing to discretion and emotion.
Without a journal, traders tend to remember the bad exits and forget that the rule worked: the bias is toward staying out longer than intended after a panic exit. Over time this behavioral pattern erodes returns in exactly the way the “missing the 10 best days” data describes. Reviewing our review of the best trading journals is a good starting point for finding a tool that fits your workflow.
Why These Days Matter
The top 10 best days in stock market history share a common thread: they nearly all erupted at the point of maximum fear, inside bear markets where sentiment was most stretched and a single catalyst (a Fed cut, a government backstop, a tariff pause) flipped positioning all at once. Bull markets grind higher on small daily gains. The explosive +8% to +16% sessions cluster in the middle of the worst drawdowns. That clustering is the key insight for traders: the sessions where the largest gains are possible are also the sessions where uncertainty is highest and the instinct to avoid risk is strongest. Building a rules-based approach that allows for re-entry during crisis-level volatility, and journaling every decision around those re-entries, is what separates traders who participate in the recovery from those who sit out the best days. Small-cap stocks were disproportionately affected in several of these events; see Russell index performance across the 1000, 2000, and 3000 benchmarks.
FAQ
What is the biggest one-day gain in stock market history?
The biggest single-day percentage gain for SPY (S&P 500 ETF) on record is 14.52% on October 13, 2008, when global central banks and the U.S. Treasury announced coordinated bank recapitalization plans during the 2008 credit crisis. For QQQ (Nasdaq 100 ETF), the largest single-session gain is 16.84% on January 3, 2001, after the Federal Reserve made a surprise emergency rate cut. The S&P 500 itself (the underlying index, not the ETF) registered larger percentage gains during the 1930s, but those predate the modern ETF structure and tradeable products.
Do the best days in the stock market happen in bull or bear markets?
Almost all of them happen in bear markets. Nine of the top 10 single-day rallies for SPY and QQQ landed inside the dot-com bust, the 2008 credit crisis, the 2020 COVID crash, or the April 2025 tariff scare. Bull markets tend to grind higher on smaller daily gains; the explosive +5% to +15% sessions cluster in the middle of the worst drawdowns, when sentiment is most stretched and a single catalyst can flip positioning all at once.
What was the biggest stock market rally in 2025?
On April 9, 2025, SPY gained roughly 9.41% and QQQ gained 12.00% in a single session after the U.S. paused most reciprocal tariffs for 90 days. The S&P 500 move was the third-largest one-day percentage gain since World War II. The QQQ rally was its second-best day on record, behind only the dot-com era 2001 emergency-rate-cut spike.
How much do I lose if I miss the 10 best days in the stock market?
Studies of S&P 500 returns over rolling 20-year windows show that an investor who stays fully invested earns close to the index’s full annualized return. An investor who misses just the 10 best sessions cuts long-term total return by more than half, and missing the 30 best can turn a positive return negative. Because the best days cluster near the worst drawdowns, panic-selling during a crash usually means missing the rebound that follows.
What is a bear-market rally?
A bear-market rally is a sharp upward move inside a longer downtrend. Many of the rallies on this list (October 13 and 28, 2008; March 13, 2020) were bear-market rallies that did not mark the final low. Distinguishing a bear-market bounce from the start of a new uptrend usually requires confirmation from breadth, volume, and follow-through over the days that follow.
Get Your Free Trading Resources
Grab the free trading journal template plus the same tools we use to stay organized, consistent, and objective.
- Free trading journal template
- Custom indicators, watchlists, and scanners
- Access our free trading community
Enter your email below to get instant access.
No spam. Unsubscribe anytime.







