Russell 1000 vs 2000 vs 3000: Full Index Comparison
The Russell 1000, 2000, and 3000 are three of the most widely followed US equity indexes, and they split the market into clean slices: large caps, small caps, and everything combined. If you are deciding between IWB, IWM, or IWV, or trying to understand how the three indexes relate, this guide breaks down composition, performance, ETFs, and how to actually compare them on a chart.
Key Takeaways
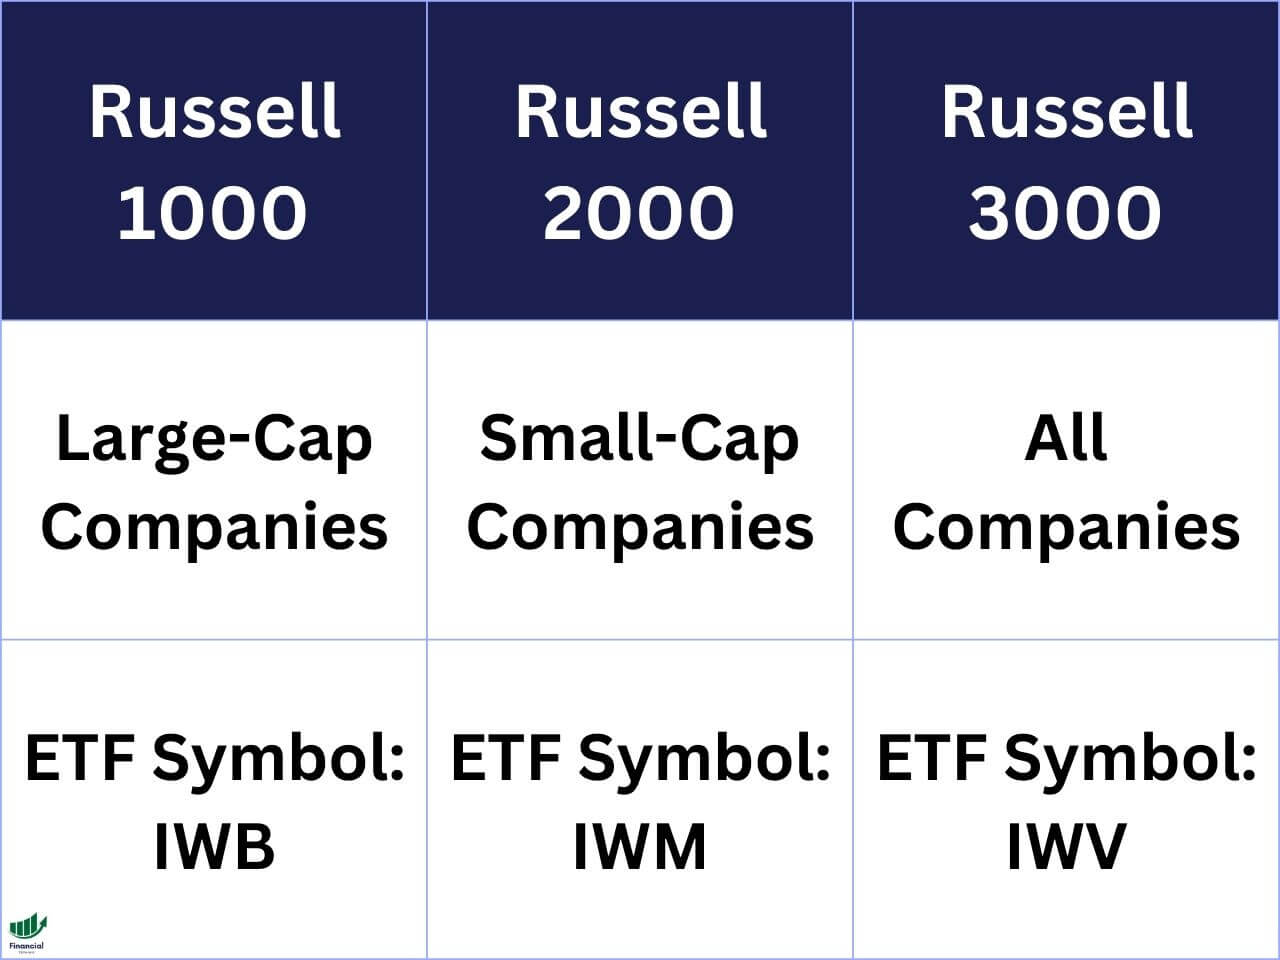
- Russell 1000 (IWB): Top 1000 US companies by market cap. Large-cap exposure, about 90% of total US market cap.
- Russell 2000 (IWM): The next 2000 companies ranked below the 1000. Pure small-cap exposure, higher volatility, higher growth potential.
- Russell 3000 (IWV): Russell 1000 + Russell 2000 combined. About 98% of the total US equity market in one index.
Recommended Tool
Financial Tech Wiz Trading Journal
Track every IWB, IWM, and IWV trade with equity curve, drawdown charts, and benchmark comparison against the S&P 500, Russell 1000, or Russell 2000. Built for investors who want to measure performance, not guess at it. Starting at $9.91/month billed annually.
Key Differences Between Russell 1000, 2000, and 3000
- Market Capitalization Differences: The primary difference lies in the market capitalization of the companies each index represents. Russell 1000 = large caps, Russell 2000 = small caps, Russell 3000 = both combined.
- Sector and Industry Representation: The Russell 1000 is skewed toward more stable, large-cap sectors like technology, financials, and healthcare. The Russell 2000 offers exposure to small-cap sectors including regional banks, biotech, and industrials. The Russell 3000 offers a blend of both.
- Performance Comparison: Historically, the Russell 1000 and 3000 track closely since large caps dominate the weighting. The Russell 2000 is more volatile and tends to outperform or underperform the other two during shifts in risk appetite.
Join for FREE: Access tons of free educational material!
Don’t miss out. Join now and start learning!
- Free Educational Material
- Community for Like-Minded Traders
- Personalized Trading Education
Visualizing the Returns of the Russell 1000, 2000, and 3000
In the TradingView chart below, all 3 of these indices are represented within the same chart, thanks to TradingView. TradingView allows you to compare multiple stocks, ETFs, cryptos, and more on a single chart.
As you can see, the Russell 1000 and 3000 are nearly identical, while the Russell 2000 is much more volatile. Note that this data is the total return and includes dividends when you click the “ADJ” button at the bottom right of the chart.
TradingView is a great way to compare assets on a single chart for free. Also, if you sign up for TradingView using our affiliate link, you can get a free trial and a discount on the premium subscriptions.
Exclusive Deal: 30-Day FREE Premium Access + Bonus Credit
Don’t Miss Out. Sign up for TradingView Now!
- Advanced Charts
- Real-Time Data
- Track all Markets
Russell 1000 vs. 2000 vs. 3000 ETF Symbols
- Russell 1000: IWB (iShares Russell 1000 ETF)
- Russell 2000: IWM (iShares Russell 2000 ETF)
- Russell 3000: IWV (iShares Russell 3000 ETF)
All three are managed by BlackRock’s iShares family. Expense ratios sit around 0.15 to 0.19%, low enough that the choice comes down to what slice of the market you want exposure to, not fee differences.
What is the Russell 1000 Index?
- Definition and Composition: The Russell 1000 Index represents the top 1000 US companies based on market capitalization. It is a subset of the Russell 3000 Index and accounts for about 90% of the market capitalization of the US stock market.
- Types of Companies Included: This index predominantly includes large-cap companies, showcasing the highest-valued corporations in the United States. Think Apple, Microsoft, Amazon, JPMorgan, and ExxonMobil.
- Performance Characteristics: The Russell 1000 is known for its stability and includes well-established companies. It is often used as a benchmark for large-cap investments and tracks closely with the S&P 500.
If you want to benchmark your portfolio against large-cap US equity, log your trades in the Financial Tech Wiz Trading Journal and compare your equity curve directly against IWB or the S&P 500.
What is the Russell 2000 Index?
- Definition and Composition: The Russell 2000 Index tracks the performance of 2000 smaller companies in the US stock market, making it the most widely followed small-cap index.
- Focus on Small-Cap Companies: This index provides a comprehensive view of the small-cap market, offering insights into lesser-known but potentially fast-growing companies. Holdings skew toward regional banks, biotech, industrials, and smaller consumer brands.
- Performance Trends: The Russell 2000 is known for its volatility and potential for high growth, making it an attractive option for risk-tolerant investors. It often leads the market in early-cycle recoveries and lags during risk-off periods.
What is the Russell 3000 Index?
- Definition and Composition: The Russell 3000 Index is a market-capitalization-weighted stock market index that includes the largest 3000 US stocks, covering about 98% of the US equity market.
- Overall Market Representation: It combines the characteristics of both the Russell 1000 and 2000, offering a comprehensive view of the broader US stock market. For most investors, the Russell 3000 is the simplest “total market” proxy in a single fund.
Investment Strategies Based on Russell Indices
Each index serves different investment needs:
- Russell 1000 (IWB): Suitable for investors seeking stability and lower risk. Heavy tech and financial weighting, similar profile to the S&P 500.
- Russell 2000 (IWM): Attracts those looking for growth potential in small-cap stocks. Often used as a barometer for domestic economic strength and risk appetite.
- Russell 3000 (IWV): Ideal for investors seeking a total stock market index with one ticker. Broadest diversification of the three.
A common portfolio approach: hold IWV as a core US equity position, or pair IWB and IWM in a ratio that reflects your preferred large-cap to small-cap tilt. Track the allocation and P&L in the Financial Tech Wiz Trading Journal so you can see what is actually driving returns across the two sleeves.
Comparing ETFs With TradingView
When comparing ETFs, it is crucial that you are comparing the total return to include dividend payments. TradingView allows you to compare several stocks and ETFs at once on a single chart adjusted for dividends.
You can simply sign up for a free TradingView account and type the stock ticker you want to compare. Next, click the plus sign next to the ticker at the top left of the chart to add symbols to compare.
Finally, ensure you click the ‘ADJ’ at the bottom to adjust the returns for dividends. For a deeper look at TradingView’s chart tools and cost, see our guide on how much TradingView costs.
Once you have compared the three indexes visually, the next step is tracking your own performance against them. Start with the free trading journal template for Google Sheets, or use the full Financial Tech Wiz Trading Journal for automated benchmark comparison and equity curve tracking.
Get Your Free Trading Resources
Grab the free trading journal template plus the same tools we use to stay organized, consistent, and objective.
- Free trading journal template
- Custom indicators, watchlists, and scanners
- Access our free trading community
Enter your email below to get instant access.
No spam. Unsubscribe anytime.
Frequently Asked Questions
What is the difference between the Russell 1000 and Russell 2000?
The Russell 1000 tracks the 1000 largest US companies by market cap and represents about 90% of total US market cap. The Russell 2000 tracks the 2000 smaller companies ranked below the 1000, making it a pure small-cap index. The 1000 is more stable, the 2000 is more volatile with higher growth potential in risk-on markets.
What is the difference between the Russell 2000 and Russell 3000?
The Russell 2000 covers only small-cap stocks (companies ranked 1001 to 3000 by market cap). The Russell 3000 combines both the Russell 1000 and Russell 2000 into one index, covering about 98% of the total US equity market. Russell 3000 is large cap plus small cap in a single fund.
What is the best Russell index ETF?
It depends on what exposure you want. IWB tracks the Russell 1000 for large-cap exposure. IWM tracks the Russell 2000 for small-cap exposure. IWV tracks the Russell 3000 for total US market exposure in one ticker. For broad diversification with a single fund, IWV is the simplest choice.
Does the Russell 3000 include the Russell 1000?
Yes. The Russell 3000 is built from the Russell 1000 (top 1000 companies) plus the Russell 2000 (next 2000 companies), so every Russell 1000 constituent is also held in the Russell 3000. The Russell 1000 represents roughly 90% of the weighting in the Russell 3000 because it is market-cap weighted.
How often are Russell indexes rebalanced?
Russell indexes are rebalanced annually in late June during what is called “Russell reconstitution.” Companies are reassigned between the Russell 1000, Russell 2000, and Russell 3000 based on updated market capitalization rankings, and the IWB, IWM, and IWV ETFs adjust their holdings accordingly. Quarterly IPO additions can also occur.
Get Your Free Trading Resources
Grab the free trading journal template plus the same tools we use to stay organized, consistent, and objective.
- Free trading journal template
- Custom indicators, watchlists, and scanners
- Access our free trading community
Enter your email below to get instant access.
No spam. Unsubscribe anytime.


