If you are looking for a simple and effective way to invest in the stock market, you might have come across two popular exchange-traded funds (ETFs) from Vanguard: VTI and VOO.
Both of these ETFs provide exposure to the overall stock market, but they have some key differences that you should be aware of before choosing one over the other.
Overview of VTI and VOO
VTI and VOO are both ETFs from Vanguard, one of the largest and most reputable investment companies in the world. ETFs are funds that track a basket of securities, such as stocks or bonds, and trade on an exchange like stocks.
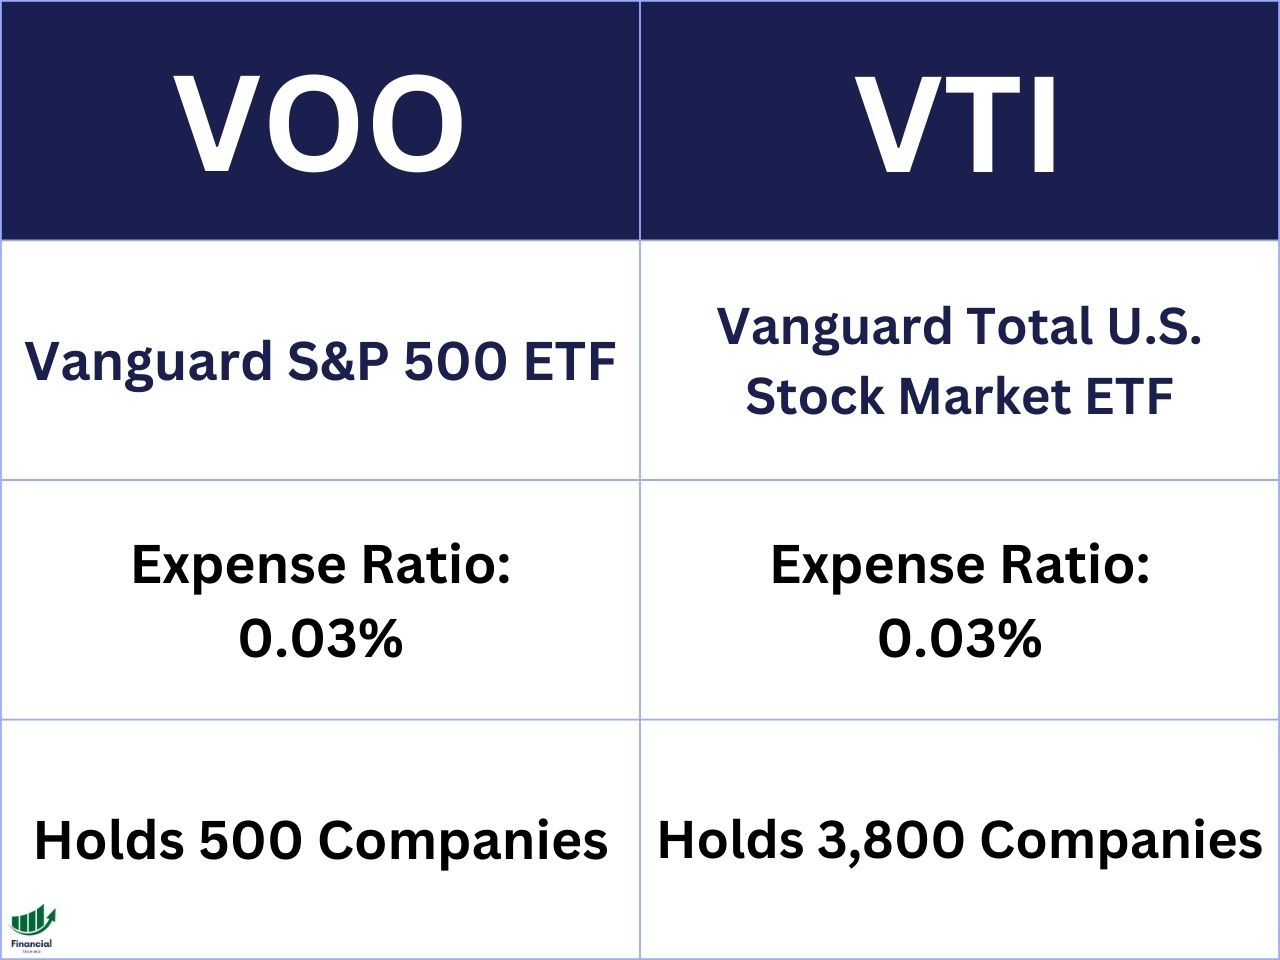
VTI stands for Vanguard Total Stock Market ETF, and it aims to track the performance of the CRSP US Total Market Index, which covers the entire US equity market. VTI holds over 3,800 stocks across all market capitalizations, sectors, and styles, making it one of the most diversified ETFs available.
VOO stands for Vanguard S&P 500 ETF, and it aims to track the performance of the S&P 500 Index, which is widely regarded as the best representation of the US large-cap stock market. VOO holds around 500 stocks that are selected by the S&P Dow Jones Indices based on their size, liquidity, profitability, and other factors.
VTI vs. VOO Dividend Yield
| ETF | Dividend Yield |
| VTI | 1.56% |
| VOO | 1.61% |
Dividends are payments that companies make to their shareholders as a way of distributing their profits. Dividend yield is a measure of how much a company pays in dividends relative to its share price.
Both VTI and VOO pay dividends quarterly to their investors. The dividend yield for VTI is around 1.56%, while the dividend yield for VOO is around 1.61%. This means that if you invested $10,000 in VTI or VOO at that date, you would receive about $156 or $161 in dividends per year, respectively.
The difference in dividend yield between VTI and VOO is not very significant and is not a huge deciding factor between these ETFs.
VTI vs. VOO Expense Ratio
| ETF | Expense Ratio |
| VTI | 0.03% |
| VOO | 0.03% |
VTI and VOO both have an expense ratio of 0.03%, which is among the lowest in the industry. This means that both ETFs are very cost-efficient and do not erode your returns significantly due to fees.
The expense ratio is a measure of how much an ETF charges its investors for managing the fund. It is expressed as a percentage of the fund’s assets per year. For example, an expense ratio of 0.03% means that the fund charges $3 per year for every $10,000 invested.
The expense ratio is one of the most important factors to consider when choosing an ETF because it directly affects your returns over time. The lower the expense ratio, the more money you get to keep from your investment.
VTI vs. VOO Total Return Performance
| ETF | 5-Year Return of $10,000 |
| VTI | $15,600 |
| VOO | $16,100 |
According to TradingView, which is a platform that allows you to compare several stocks and ETFs on a single chart with various indicators and tools, VTI has generated a total return of 56% over the past five years, while VOO has generated a total return of 61% in the same time period.
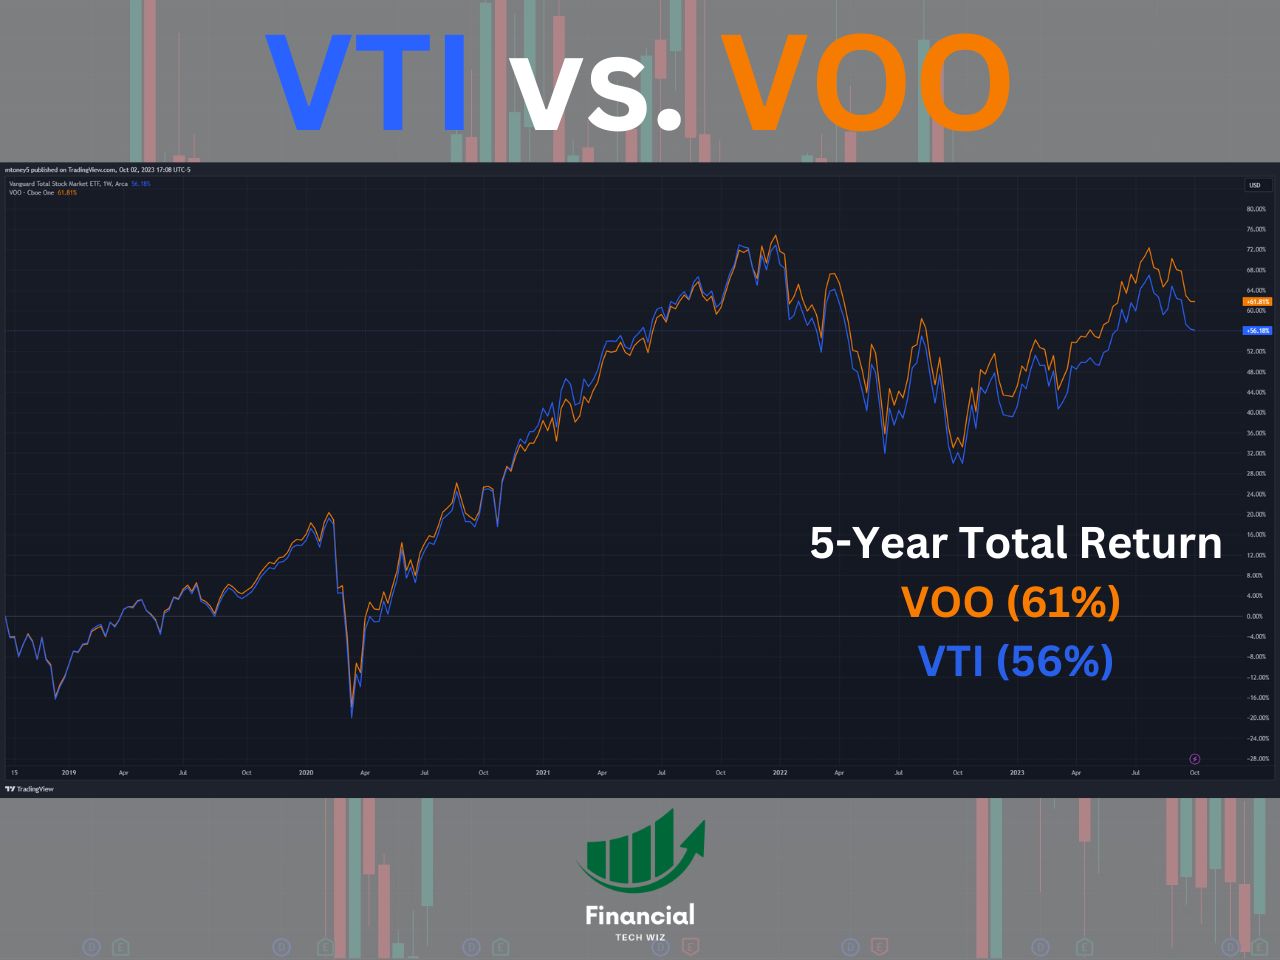
This means that if you invested $10,000 in VTI or VOO five years ago, you would have $15,600 or $16,100 today, respectively.
The difference in total return performance between VTI and VOO is mainly due to the fact that VOO holds fewer companies than VTI, and those companies have performed better than the average of the entire market.
VOO is more concentrated in the large-cap segment of the market, which has outperformed the small-cap and mid-cap segments in recent years. VOO also has a higher exposure to the technology sector, which has been one of the best-performing sectors in the past decade.
However, it is important to note that past performance is not a guarantee of future results and that the difference in total return performance between VTI and VOO may change over time depending on market conditions and trends.
Comparing ETFs With TradingView
When comparing ETFs, it is crucial that you are comparing the total return to include dividend payments. TradingView allows you to compare several stocks and ETFs at once on a single chart adjusted for dividends.
You can simply sign up for a free TradingView account and type the stock ticker you want to compare. Next, click the plus sign next to the ticker at the top left of the chart to add symbols to compare.
Finally, ensure you click the ‘ADJ’ at the bottom to adjust the returns for dividends!
As you can see in the TradingView chart below, you can compare multiple funds and ETFs on a single chart, making your research much easier. Feel free to compare any ETFs you’d like using the widget.

VTI vs. VOO Holdings
VTI is more diversified than VOO since it is a total stock market ETF, while VOO is an S&P 500 ETF. VOO holds around 500 companies, while VTI holds over 3,800 stocks. This means that VTI covers more of the market than VOO and has a lower exposure to any single company or sector.
Another important note is that VOO is heavily allocated to the tech sector, which some investors may consider too risky. Therefore, if you are more risk-averse, VTI is likely the better option.
An ETF’s holdings are the individual securities that an ETF owns and tracks. Understanding the companies the ETF owns is one of the most important factors to consider when choosing an ETF because it determines the risk and return profile of the fund.
If you are interested in comparing other ETFs besides VTI and VOO, you can check out our other articles that cover various aspects of different ETFs, such as:
- VOO vs. SPY: A comparison of two S&P 500 ETFs from Vanguard and SPDR.
- VUG vs. QQQ: A comparison of two growth-oriented ETFs from Vanguard and Invesco.
- VOO vs. QQQ: A comparison of two large-cap ETFs from Vanguard and Invesco that have different sector exposures.
- FXAIX vs. VOO: A comparison of an S&P 500 index fund from Fidelity and an S&P 500 ETF from Vanguard.
- VOO vs. SCHD: A comparison of two dividend-focused ETFs from Vanguard and Schwab.
- QQQ vs. SPY: Which is the best ETF for your portfolio?
- VFIAX vs. VOO: Which is best for you?
- VTSAX vs. VFIAX
The Financial Tech Wiz ETF Comparison Tool
You can use the ETF comparison tool below to compare over 2,000 ETFs and mutual funds with data I manually collected:
VTI vs. VOO | Bottom Line
VTI and VOO are both excellent ETFs from Vanguard that provide exposure to the overall stock market, but they have some key differences that you should be aware of before choosing one over the other.
VTI is a total stock market ETF that holds over 3,800 stocks across all market capitalizations, sectors, and styles, making it one of the most diversified ETFs available. VTI has a lower dividend yield, a lower exposure to large-cap growth stocks, and a higher exposure to small-cap and mid-cap stocks than VOO.
VOO is an S&P 500 ETF that holds around 500 stocks that are selected by the S&P Dow Jones Indices based on their size, liquidity, profitability, and other factors. VOO has a higher dividend yield, a higher exposure to large-cap growth stocks, and a lower exposure to small-cap and mid-cap stocks than VTI.
Both ETFs have the same expense ratio of 0.03%, which is among the lowest in the industry and have performed very well over the past five years, generating impressive total returns for their investors.
The choice between VTI and VOO depends on your personal preference, risk tolerance, investment horizon, and portfolio allocation. You may also consider holding both ETFs in your portfolio to get the best of both worlds.