If you are looking for a way to invest in the U.S. stock market, you might have come across two of the most popular and liquid exchange-traded funds (ETFs): QQQ and SPY.
These ETFs offer the best liquidity for active traders, as they have high trading volumes and low bid-ask spreads.
But what are the differences between them, and which one is best for you?
Overview of QQQ and SPY
QQQ and SPY are both index funds, which means they track the performance of a specific group of stocks. However, they track different indexes, which have different compositions and characteristics.
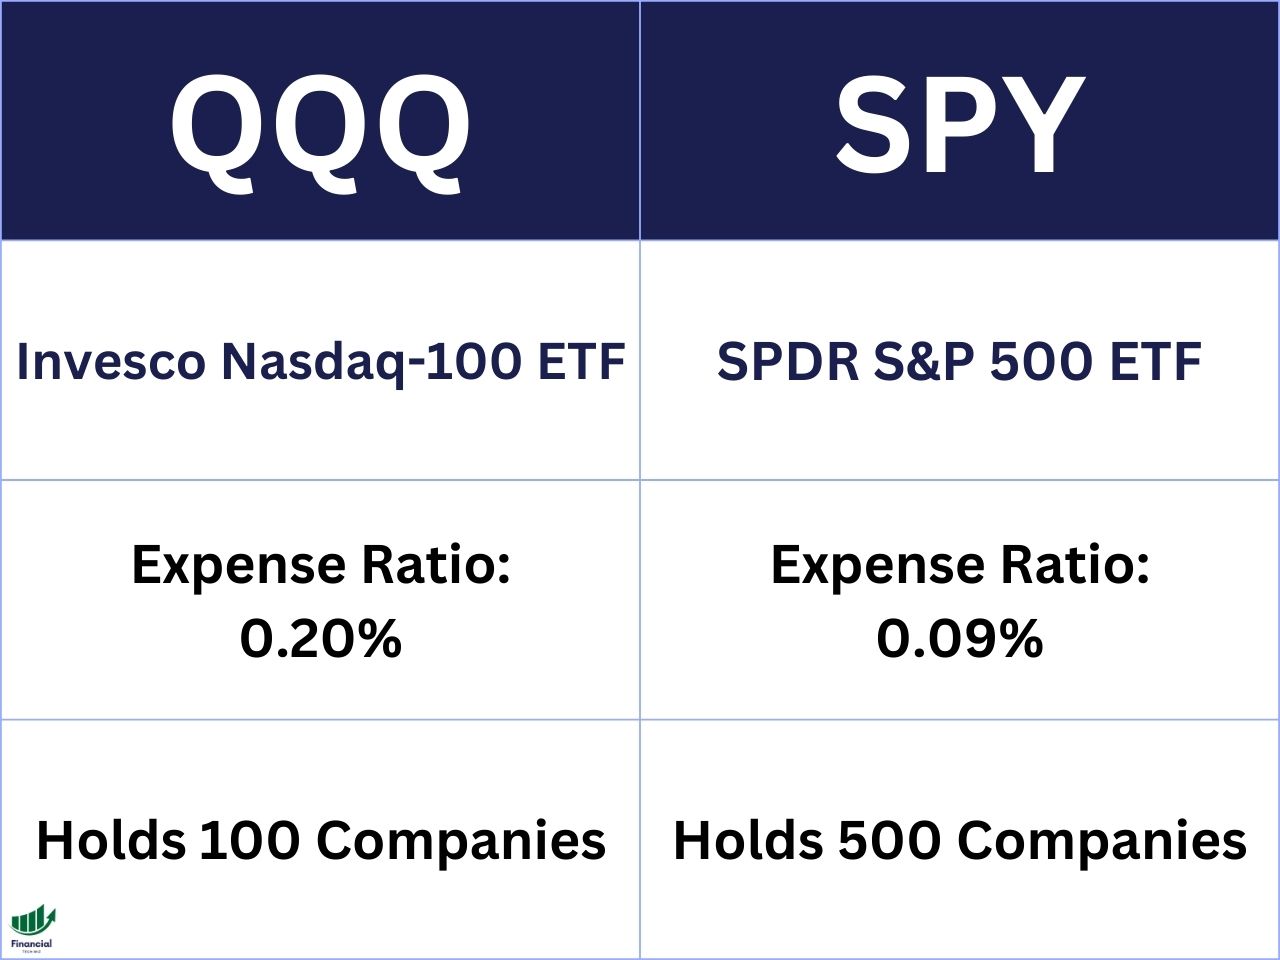
SPY tracks the S&P 500 index, which is the most common benchmark of the U.S. stock market. The S&P 500 index consists of 500 large-cap companies from various sectors, such as technology, health care, consumer discretionary, financials, and more.
The S&P 500 index is weighted by market capitalization, which means that larger companies have a bigger impact on the index performance.
QQQ tracks the Nasdaq 100 index, which holds only 100 stocks. The Nasdaq 100 index is also weighted by market capitalization, but it has a different sector allocation than the S&P 500 index.
The Nasdaq 100 index is heavily skewed towards technology companies, which make up about 50% of the index. The Nasdaq 100 index also excludes financial companies, which are more prevalent in the S&P 500 index.
QQQ vs. SPY Dividend Yield
| ETF | Dividend Yield |
| SPY | 1.53% |
| QQQ | 0.59% |
One of the factors that investors consider when choosing an ETF is the dividend yield, which is the annual dividend payment divided by the share price. Dividends are a way for companies to distribute their profits to shareholders, and they can provide a steady income stream for investors.
The QQQ dividend yield is 0.59%, while the SPY dividend yield is 1.53%. This means that SPY pays more dividends than QQQ on average.
This is partly because SPY has more mature and stable companies that tend to pay higher dividends, while QQQ has more growth-oriented and innovative companies that tend to reinvest their earnings.
QQQ vs. SPY Expense Ratio
| ETF | Expense Ratio |
| SPY | 0.09% |
| QQQ | 0.20% |
Another factor that investors consider when choosing an ETF is the expense ratio, which is the annual fee that the fund charges to cover its operating costs. The expense ratio reduces the net return of the fund, so lower expense ratios are preferable.
The QQQ expense ratio is 0.20%, while the SPY expense ratio is 0.09%. This means that SPY charges less fees than QQQ on average. This is partly because SPY has a simpler structure and lower management costs than QQQ, which has more complex holdings and higher turnover rates.
However, both QQQ and SPY have relatively low expense ratios compared to other ETFs in the market. For example, some Vanguard ETFs have even lower expense ratios, such as VOO (0.03%), VTI (0.03%), and VUG (0.04%).
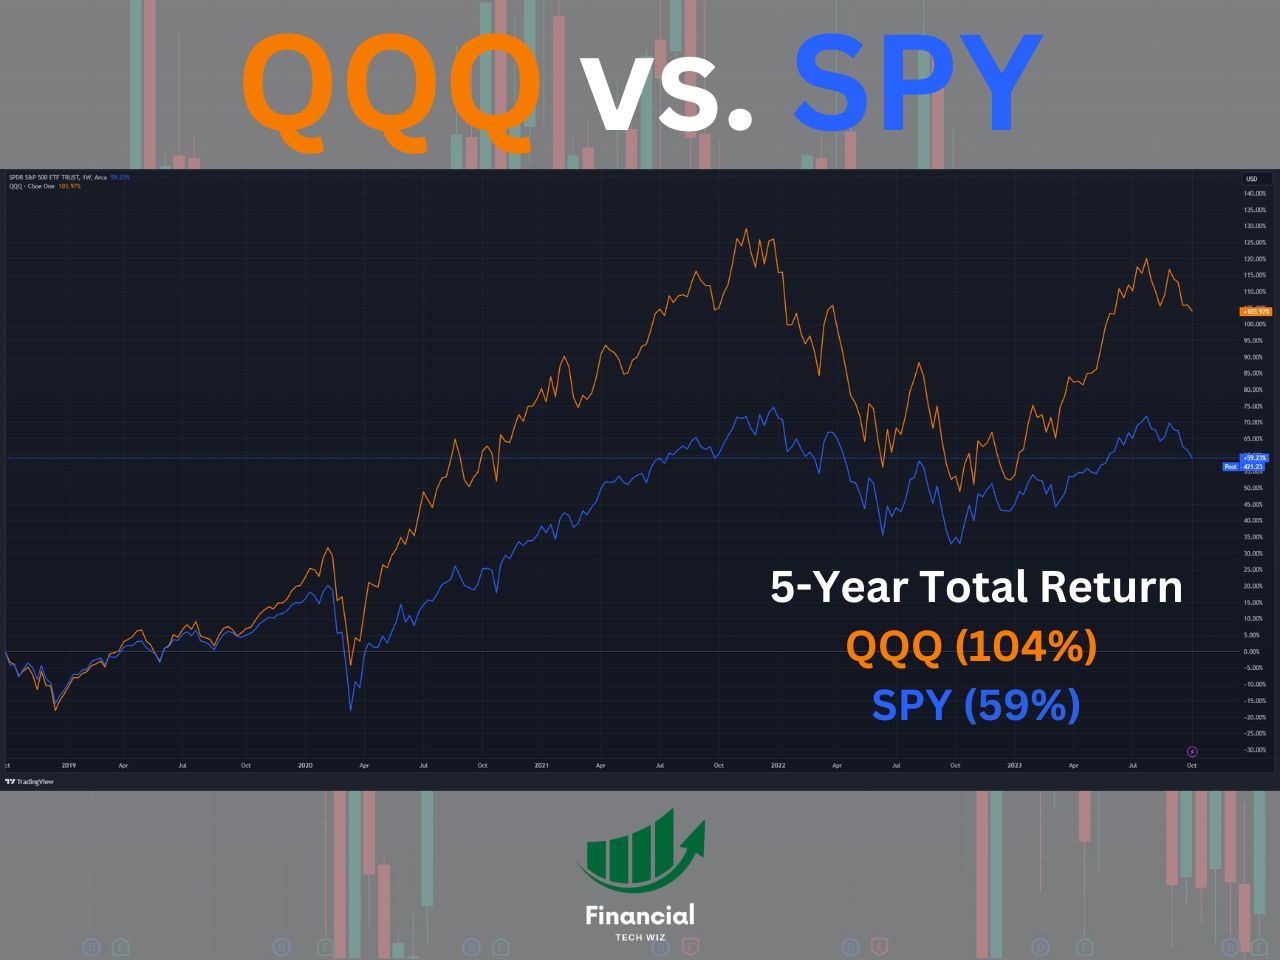
QQQ vs. SPY Total Return Performance
| ETF | 5-Year Total Return |
| SPY | 59% |
| QQQ | 104% |
One of the most important factors that investors consider when choosing an ETF is the total return performance, which is the change in share price plus the dividends received over a period of time. The total return performance reflects how well the fund has performed in terms of capital appreciation and income generation.
The QQQ 5-year total return is 104%, while SPY is 59%. This means that QQQ has outperformed SPY by a wide margin over the past five years. This is mainly because QQQ has benefited from the strong performance of its top holdings, such as Apple, Microsoft, Amazon, Tesla, and Google, which have been driving the technology sector to new heights due to their innovation and growth potential.
However, past performance does not guarantee future results, and QQQ may also face higher volatility and risk than SPY due to its concentration in a few sectors and companies.
Comparing ETFs With TradingView
When comparing ETFs, it is crucial that you are comparing the total return to include dividend payments. TradingView allows you to compare several stocks and ETFs at once on a single chart adjusted for dividends.
You can simply sign up for a free TradingView account and type the stock ticker you want to compare. Next, click the plus sign next to the ticker at the top left of the chart to add symbols to compare.
Finally, ensure you click the ‘ADJ’ at the bottom to adjust the returns for dividends!
As you can see in the TradingView chart below, you can compare multiple funds and ETFs on a single chart, making your research much easier. Feel free to compare any ETFs you’d like using the widget.

QQQ vs. SPY Holdings Comparison
Another way to compare QQQ and SPY is to look at their holdings, which are the individual stocks that make up each fund. By looking at their holdings, you can get a better sense of their diversification, exposure, and risk profile.
Here are some key facts about QQQ and SPY holdings:
- QQQ has 100 holdings, while SPY has 500 holdings on average.
- QQQ has no exposure to the financial sector, while SPY has significant exposure to the financial sector.
- SPY is considered the benchmark for the general U.S. stock market.
Other ETF Comparisons
If you are interested in comparing other ETFs, you can check out our other articles, such as:
- VOO vs. SPY
- VUG vs. QQQ
- VTI vs. VOO
- FXAIX vs. VOO
- VOO vs. SCHD
- VTSAX vs. VFIAX
- Russell 1000 vs. 2000 vs. 3000
The Financial Tech Wiz ETF Comparison Tool
You can use the ETF comparison tool below to compare over 2,000 ETFs and mutual funds with data I manually collected:
QQQ vs. SPY | Bottom Line
QQQ and SPY are both excellent ETFs that offer exposure to the U.S. stock market, but they have different characteristics and performance. QQQ is more suitable for investors who are looking for higher growth potential and are willing to accept higher risk and volatility. SPY is more suitable for investors who are looking for more stability and income and are more diversified across sectors and companies.
Ultimately, the best ETF for you depends on your personal goals, risk tolerance, time horizon, and investment strategy. You can also combine QQQ and SPY in your portfolio to achieve a balanced mix of growth and value.
To help you make informed decisions and track your investments, we recommend you to sign up for TradingView, which is a powerful platform that allows you to easily track all markets from a single platform. You can get a TradingView free trial when you use our affiliate link.