TradingView vs Investing.com (2026): Charts, Data and Pricing
Two of the most popular and comprehensive platforms for traders are TradingView and Investing.com.
In this article, we will compare and contrast TradingView and Investing.com across various criteria, such as user interface, charting tools, market coverage, pricing, and more.
TradingView
- Starting at $14.95/month
- Extensive charting tools
- Custom indicators
- Ideal for active traders
Investing.com
- Starting at $12.49/month
- Extensive fundamental analysis
- Uses TradingView for charting
- Best for swing traders and investors
Overview of TradingView vs. Investing.com
TradingView and Investing.com are both online platforms that provide traders with various tools and resources for trading and investing.
They both have some core features and functionalities that make them popular and comprehensive platforms for traders. However, they also have some differences that make them unique and distinct from each other.
TradingView
TradingView is an online platform that was founded in 2011 by a group of traders and software developers. It is mainly focused on providing traders with interactive charts, advanced technical analysis tools, and social trading features.
TradingView has tens of millions of monthly active users who use its platform to access real-time data from multiple sources, create custom indicators and strategies using pine script editor, backtest and optimize their trading systems using strategy tester, publish and share their trading ideas with other users, follow and copy other successful traders, and more.
TradingView Strengths
TradingView’s main strengths are its simplicity, elegance, and efficiency. It has a user-friendly interface that allows traders to easily navigate and customize their charts and tools. It also has a large and active community of traders who share their insights and feedback on various markets and instruments.
TradingView Weaknesses
TradingView’s main weaknesses are its limited data coverage and market insights. It does not cover some markets, such as options and futures, and it does not provide much news or fundamental analysis features.
Investing.com
Investing.com is an online platform that was founded in 2007 by a group of economists and entrepreneurs. It is mainly focused on providing traders with comprehensive data coverage, market insights, and portfolio management tools.
Investing.com has tens of millions of monthly active users who use its platform to access real-time data from over 250 exchanges, historical data up to 20 years, global market coverage across 100+ countries, live news and analysis from various sources, and more.
Investing.com Strengths
Investing.com’s main strengths are its economic data and economic news. It has a user interface that allows traders to access a wide range of data and information from different markets and instruments.
Investing.com Weaknesses
Investing.com’s main weaknesses are its appearance and performance. It has a user interface that can be overwhelming and confusing for some users, especially beginners. It also has some issues with speed and reliability, especially on mobile devices.
| Platform | Charting Tools | Data Coverage | Pricing |
|---|---|---|---|
| TradingView Free Trial | Offers advanced indicators, real-time data, backtesting, and custom indicators with Pine Script | Real-time data offered for free whenever possible and fundamental screeners | Plans start at just $12.95 per month |
| Investing.com Visit Site | Minimal indicators, but the charts work fine and are real-time | Extensive market research and recent market news is great | Plans start at $12.49 per month |
Charting and Technical Analysis Tools
TradingView and Investing.com have different charting and technical analysis tools that provide traders with different options and capabilities for charting and analysis. They both have some pros and cons that can make them more or less suitable for certain trading needs and preferences.
TradingView’s Charting and Technical Analysis Tools
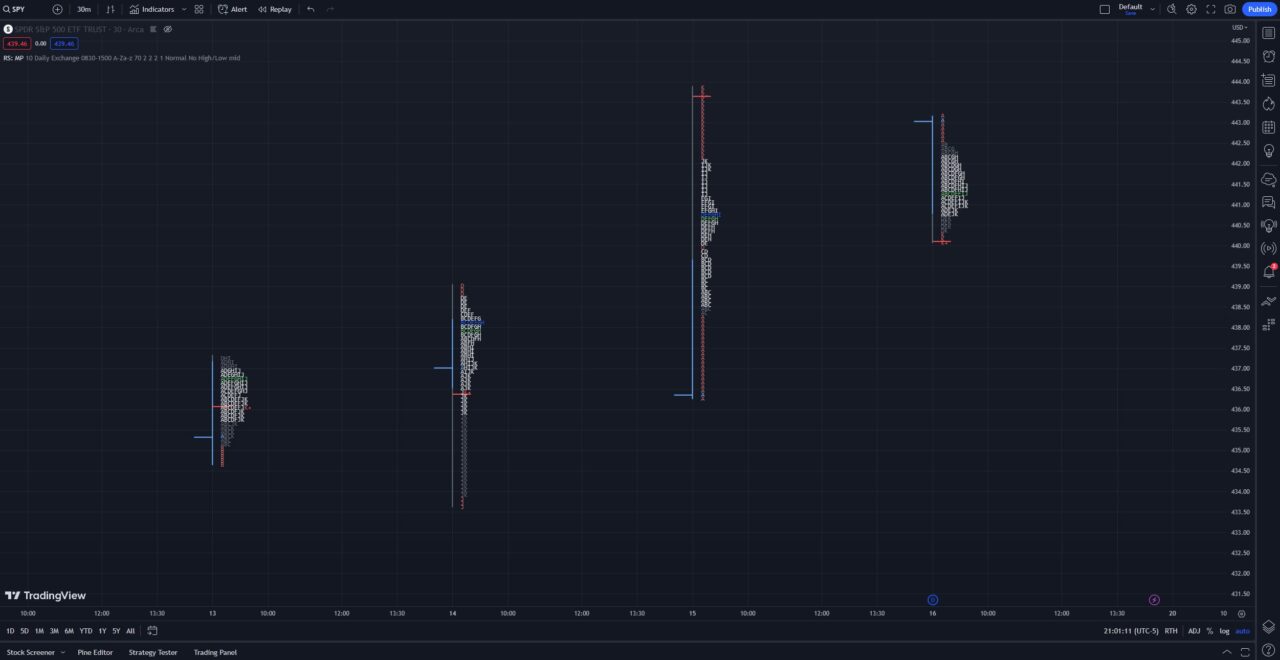
TradingView’s charting and technical analysis tools have the following features:
- Interactive charts: TradingView allows users to create and manipulate interactive charts for their markets and instruments. Users can choose from various chart types such as line, candlestick, bar, area, etc. Users can also adjust the time frames from tick charts to 1 month.
- Advanced indicators: TradingView allows users to apply and modify over 100 built-in technical indicators to their charts. Users can choose from indicators such as moving averages, oscillators, volume profile, Fibonacci retracements, etc. TradingView also offers several paid indicators.
- Pine Script editor: TradingView allows users to create and edit their own custom indicators and strategies using the Pine Script editor. Pine Script is a programming language that is designed for trading purposes. Users can use pine script to code their own logic, formulas, conditions, and rules for their indicators and strategies.
- Backtesting: TradingView allows users to backtest their custom indicators and strategies using historical data. Users can use TradingView’s backtesting tools to evaluate the performance and profitability of their indicators and strategies over time.
- Strategy tester: TradingView allows users to test their custom indicators and strategies using real-time data. Users can use strategy tester to simulate the execution and outcome of their indicators and strategies in live market conditions. Users can also monitor the results and statistics of their indicators and strategies.
Investing.com’s Charting and Technical Analysis Tools
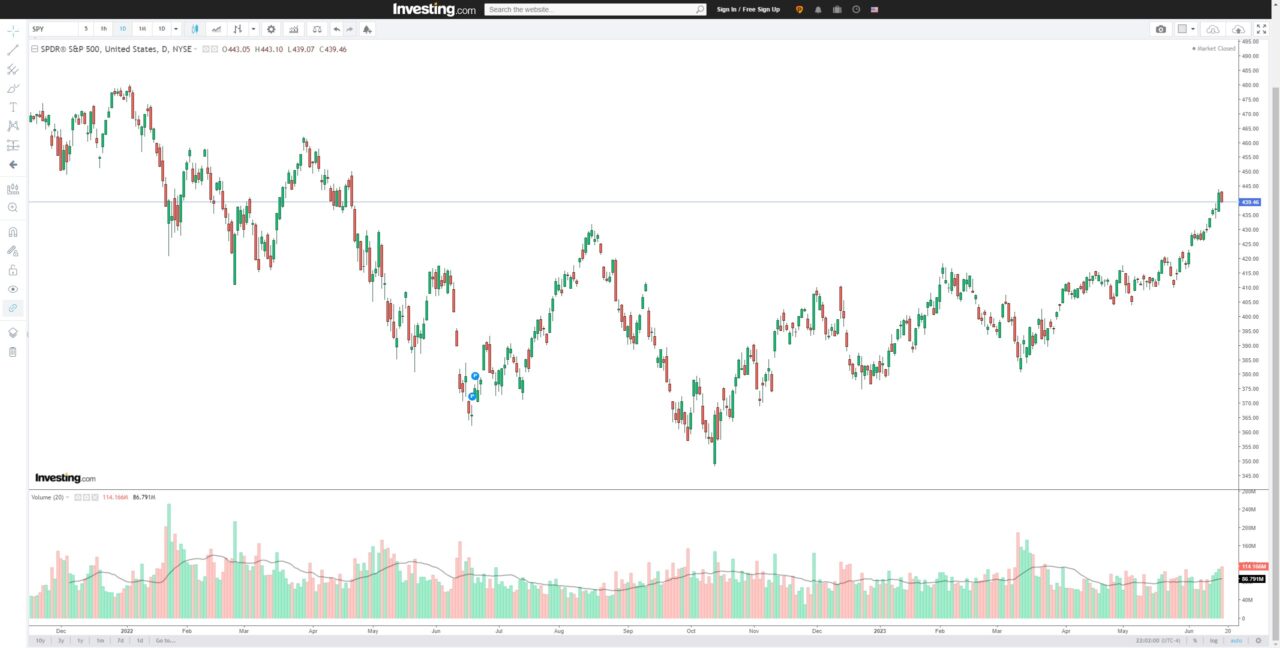
Investing.com’s charting and technical analysis tools have the following features:
- Live charts: Investing.com allows users to access live charts for their markets and instruments. Users can choose from various chart types such as line, candlestick, bar, area, etc. Users can also adjust the time frames from 1 minute to 1 month. Users can also zoom in and out, pan, scroll, and crosshair their charts.
- Basic indicators: Investing.com allows users to apply and modify over 30 built-in technical indicators to their charts. Users can choose from indicators such as moving averages, oscillators, trend lines, Bollinger bands, etc. Users can also customize the parameters, colors, styles, and scales of their indicators.
- Technical summaries: Investing.com provides users with technical summaries for their markets and instruments. Technical summaries are concise overviews of the technical analysis of the markets and instruments based on various indicators and time frames. Technical summaries also provide users with buy/sell signals based on the technical analysis.
- Pattern recognition: Investing.com provides users with pattern recognition tools for their markets and instruments. Pattern recognition tools are automated tools that identify and highlight various chart patterns such as triangles, wedges, flags, etc. Pattern recognition tools also provide users with potential price targets based on the chart patterns.
Data Coverage and Market Insights
TradingView’s Data Coverage and Market Insights
TradingView’s data coverage and market insights have the following features:
- Real-time data from multiple sources: TradingView provides users with real-time data from multiple sources such as exchanges, brokers, data providers, etc. Users can access real-time data for various markets such as stocks, forex, crypto, commodities, indices, etc. Users can also choose the preferred data source for their markets and instruments.
- Historical data up to 40 years: TradingView provides users with historical data up to 40 years for their markets and instruments. Users can access historical data for various time frames such as daily, weekly, monthly, etc. Users can also use historical data for backtesting and analysis purposes.
- Global market coverage across 135+ exchanges: TradingView provides users with global market coverage across 135+ exchanges in over 65 countries. Users can access data and information from various markets such as US, UK, Japan, China, India, etc. Users can also compare and contrast different markets and instruments across different regions and countries.
- Unique features and indicators: TradingView provides users with unique features and indicators that enhance their data coverage and market insights. Some of these features and indicators are:
- Economic calendar: TradingView provides users with an economic calendar that shows the upcoming economic events and indicators that can affect the financial markets. Users can filter the economic calendar by country, category, importance, etc. Users can also see the expected, actual, and previous values of the economic indicators.
- Earnings calendar: TradingView provides users with an earnings calendar that shows the upcoming earnings reports of various companies. Users can filter the earnings calendar by market, sector, industry, etc. Users can also see the expected, actual, and previous values of the earnings per share (EPS) and revenue.
- Seasonality: TradingView provides users with a seasonality tool that shows the historical performance of various markets and instruments over different periods of time. Users can use the seasonality tool to identify patterns, trends, cycles, and anomalies in the markets and instruments.
- Crypto screener: TradingView provides users with a crypto screener that allows them to scan and filter various cryptocurrencies based on various criteria such as price, volume, market cap, change, etc. Users can also sort and rank the cryptocurrencies based on various metrics such as performance, volatility, liquidity, etc.
Investing.com’s Data Coverage and Market Insights
Investing.com’s data coverage and market insights have the following features:
- Real-time data from over 250 exchanges: Investing.com provides users with real-time data from over 250 exchanges around the world. Users can access real-time data for various markets such as stocks, forex, crypto, commodities, indices, futures, options, etc. Users can also see the bid/ask prices, spreads, volumes, etc. of their markets and instruments.
- Historical data up to 20 years: Investing.com provides users with historical data up to 20 years for their markets and instruments. Users can access historical data for various time frames such as daily, weekly, monthly, etc. Users can also use historical data for analysis and comparison purposes.
- Global market coverage across 100+ countries: Investing.com provides users with global market coverage across 100+ countries in over 30 languages. Users can access data and information from various markets such as US, UK, Japan, China, India, etc. Users can also switch between different languages and currencies according to their preferences.
- Additional market insights or news features: Investing.com provides users with additional market insights or news features that enhance their data coverage and market insights. Some of these features are:
- Live news and analysis: Investing.com provides users with live news and analysis from various sources such as Reuters, Bloomberg, CNBC, etc. Users can access live news and analysis for various markets and instruments. Users can also filter the news and analysis by category, importance, source, etc.
- Sentiment indicators: Investing.com provides users with sentiment indicators that show the mood and opinion of the trading community on various markets and instruments. Users can access sentiment indicators such as bullish/bearish percentage, buy/sell signals, investing.com technical summary, etc.
- Portfolio tools and alerts: Investing.com provides users with portfolio tools and alerts that allow them to manage their portfolio performance and get alerts on market movements and opportunities. Users can create and track multiple portfolios for their markets and instruments.
Real-Time Data: TradingView vs. Investing.com
Real-time data is the part of the comparison most users do not understand until they hit a delayed quote at the wrong moment. TradingView’s free plan shows free real-time data for the assets where the source exchange provides it free (most crypto, most forex, some indices) and 15-minute delayed data for US equities and most international stock exchanges. Live US equity data on TradingView is unlocked by adding a per-exchange data subscription on top of the platform plan, which is billed separately and varies by exchange. The mechanic is similar for futures and Indian equities: separate data fees stacked on top of the platform tier. The result is that even a TradingView Premium subscriber will see delayed equity quotes by default until they explicitly add the relevant exchange data feed.
Investing.com unlocks real-time data inside its Investing Pro tiers without per-exchange add-ons, but the depth of data per asset is shallower. You get a live last price and a tighter quote update cadence, but Level II and depth-of-market views are not part of the offering. For a buy-and-hold investor checking quotes a few times a day, Investing.com’s bundled real-time approach is simpler and probably cheaper than stacking TradingView data fees. For an active intraday trader who needs full DOM and per-exchange precision, TradingView with the appropriate exchange feed is the one that holds up at trade-execution speed. The full per-exchange fee structure is documented in our walkthrough of real-time TradingView data fees.
TradingView vs. Investing.com Pricing
TradingView and Investing.com have different pricing and subscription plans that provide traders with different options and capabilities for accessing their features and functionalities. They both have some pros and cons that can make them more or less suitable for certain trading needs and preferences.
TradingView’s Pricing and Subscription Plans
TradingView’s pricing and subscription plans break down as follows. For a full plan-by-plan walkthrough of the current paid tiers, see our TradingView pricing breakdown.
- Free plan: TradingView offers a free plan that allows users to access some of its features and functionalities for free. Users can use the free plan to access interactive charts, basic indicators, data coverage, market insights, social trading features, etc. However, the free plan has some limitations, such as ads, fewer indicators, fewer alerts, fewer data sources, etc.
- Free Trial: New users can usually try out any of TradingView’s premium plans for free when they use our affiliate link.
- Paid plans: TradingView offers paid plans that allow users to access more of its features and functionalities for a monthly or annual fee. Users can choose from the following paid plans:
- Essential plan: The Essential plan costs $14.95 per month or $155.40 per year. Users can use the Essential plan to access an ad-free experience, more indicators, multiple charts, more alerts, more data sources, etc.
- Plus plan: The plus plan costs $29.95 per month or $299.40 per year. Users can use the plus plan to access all the features of the Essential plan plus more layouts, more devices, intraday renko charts, custom intervals, etc.
- Premium plan: The Premium plan costs $59.95 per month or $599.40 per year. Users can use the premium plan to access all the features of the Plus plan plus more indicators per chart, more alerts per chart, priority customer support, etc.
- Discounts: TradingView offers discounts for users who choose to pay annually instead of monthly. Users can save up to 16% by paying annually instead of monthly.
Investing.com’s Pricing and Subscription Plans
Investing.com’s pricing and subscription plans have the following features:
- Free plan: Investing.com offers a free plan that allows users to access most of its features and functionalities for free. Users can use the free plan to access data coverage, market insights, charting tools, portfolio tools, alerts, social trading features, etc. However, the free plan has some limitations, such as ads, fewer portfolio tools, fewer analysis tools, fewer data sources, etc.
- Paid plans: Investing.com offers Investing Pro plans that allow users to access more of its features and functionalities for a monthly or annual fee. Users can choose from the following paid plans:
- Investing Pro: The Investing Pro plan costs $34.99 per month or $299.99 per year, or $479 for two years. Users can use the premium plan to access ad-free experience, advanced portfolio tools, premium analysis tools, premium data access, etc.
- Discounts: Investing.com offers discounts for users who choose to pay annually instead of monthly. Users can save up to 42% by paying annually instead of monthly.
Investing.com’s paid layer is split into two tiers: Investing Pro and Investing Pro+. The Pro tier is the entry paid plan and unlocks pre-built fundamental screeners, fair-value estimates, financial health scores, and the bulk of the company-deep-dive tools that the free site previews but does not let you act on. The Pro+ tier adds a wider set of valuation models, deeper screeners with more filter combinations, and idea lists curated by the Investing.com analyst team. Both plans run on annual billing and discount aggressively during seasonal sales (Black Friday, mid-year promotion windows), so the sticker price you see at checkout is rarely the price most subscribers pay. The practical comparison: TradingView’s paid plans buy you better charts, more indicators, and more concurrent layouts; Investing Pro buys you better fundamental research, valuation tooling, and screener depth. The two paid stacks barely overlap, which is why traders who use both end up paying for one of each rather than choosing between them.
Verdict: Which Platform Fits Which Trader
The right pick depends on how you actually use a market platform day to day. The matrix below condenses the comparison into the four user types this page tends to attract.
Active charting trader: TradingView wins decisively. The chart engine, indicator library, drawing tools, and replay mode are the deepest in the consumer space, and the per-exchange data add-on path lets you get to true real-time for the markets you actually trade. Active charting traders running TradingView for execution should pair it with a separate trade-tracking tool; the Financial Tech Wiz Trading Journal imports trades from 36 supported brokers and surfaces win rate and P&L by symbol, time of day, and hold duration.
Fundamental investor: Investing Pro wins. Fair-value estimates, financial-health scores, and the screener depth are built for someone reading earnings releases and 10-Ks, not someone reading 5-minute candles.
Crypto-only trader: TradingView wins, mostly because of how thoroughly the free plan already covers crypto data. The native crypto coverage on Investing.com is fine but light on chart depth.
Free-tier user who has not decided yet: start with TradingView’s free plan if you care about charts, start with Investing.com’s free site if you care about news flow and economic calendar. Most users who get serious end up paying for whichever side they leaned on first, and a meaningful subset pay for both. If you are still on a free plan and not ready to spend on either platform, our free trading journal template for Google Sheets gives you a no-cost way to start logging trades while you decide which paid stack you actually want.
Recommended Tool
Financial Tech Wiz Trading Journal
TradingView and Investing.com are great for deciding what to trade. The Financial Tech Wiz Trading Journal is what you use after the trade closes: import trades from 36 supported brokers, see win rate and P&L by symbol, time of day, and hold duration, and surface the patterns your charting platform cannot. Starts at $9.91/month billed annually.
Try It FreeFAQ
Is TradingView better than Investing.com for charting?
Yes for almost every user. TradingView’s chart engine has more indicators, more drawing tools, more chart types, replay mode, and a deeper customization surface. Investing.com’s charts are functional and good enough for casual reference, but they are a generation behind TradingView on capability and on community contribution (TradingView’s user-built indicator library has tens of thousands of free public scripts, Investing.com does not have an equivalent).
Which is better for beginners, TradingView or Investing.com?
Investing.com is the gentler entry point if you are still learning what a market is. It mixes news, an economic calendar, watchlists, and basic charts in one home screen, which feels less intimidating than landing on TradingView for the first time. TradingView is the better long-term home for a beginner who already knows they want to trade actively, because the platform you grow into matters more than the platform that feels easier on day one.
Is Investing Pro worth it compared to TradingView Premium?
They solve different problems. Investing Pro is built for fundamental research: valuation models, fair-value estimates, financial-health scores, and pre-built screeners. TradingView Premium is built for chart-driven trading: more indicators, more layouts, better data depth, and unlock of platform features around alerts and intraday scanning. If you are deciding between them, decide on the workflow you actually use most. If you read 10-Ks more than you read candles, Investing Pro. If you live on charts, TradingView.
Should I use both TradingView and Investing.com?
Plenty of traders do, and the two stacks barely overlap. Most active charting traders pay for TradingView and use Investing.com’s free site for the economic calendar, earnings calendar, and news headlines. Fundamental investors often run Investing Pro for research and TradingView’s free plan for the occasional chart. The combined cost of a paid TradingView plan plus a paid Investing Pro plan is in the range of typical broker data fees, so the question is whether the workflow value justifies it.
Does Investing.com have an alternative to TradingView’s free plan?
The free side of Investing.com is mainly news, calendar, watchlists, and basic charts. It is not a charting platform in the way TradingView’s free plan is. If you want a free, browser-based, full-featured chart with indicators and drawings, TradingView is the answer. If you want a free dashboard for fundamentals, news, and macro context, Investing.com is the answer. The two free experiences are not really competing; they are aimed at different parts of a trader’s day.
Before you go
If you want to keep educating yourself about trading, you must check out these posts as well:
What is the Most Successful Options Strategy
Options Trading for Income: The Complete Guide
Mark Minervini’s Trading Strategy: 8 Key Takeaways
The Best Options Trading Books
The Best Laptops and Computers for Trading
How to Get a TradingView Free Trial
The Best TradingView Indicators
Get Your Free Trading Resources
Grab the free trading journal template plus the same tools we use to stay organized, consistent, and objective.
- Free trading journal template
- Custom indicators, watchlists, and scanners
- Access our free trading community
Enter your email below to get instant access.
No spam. Unsubscribe anytime.


