TradingView Moving Averages: A Comprehensive Guide for Traders
Moving averages are among the most popular and widely-used technical indicators in the world of trading. These versatile tools help traders identify trends, generate signals, and make informed decisions.
In this guide, we’ll explore the fundamentals of moving averages in TradingView, discuss various moving averages, and provide step-by-step instructions on setting them up in your charts.
Understanding Simple and Exponential Moving Averages
Before we dive into the setup process, let’s start with the basics and define two key types of moving averages: Simple Moving Average (SMA) and Exponential Moving Average (EMA).
Simple Moving Average (SMA)
- What is SMA? A Simple Moving Average (SMA) calculates the average price of a financial instrument over a specified period. It’s called “simple” because it gives equal weight to all price data points within the period.
- How is SMA used? SMA is used to identify trends and potential areas of support and resistance. When the price is above the SMA, it indicates a bullish trend; when it’s below, it suggests a bearish trend.
Exponential Moving Average (EMA)
- What is EMA? An Exponential Moving Average (EMA) is similar to SMA but gives more weight to recent price data, making it more responsive to price changes.
- How is EMA used? EMA is commonly used to identify short-term trends and price reversals. It can provide earlier signals compared to SMA due to its sensitivity to recent data.
Differences Between SMA and EMA
- SMA is a straightforward average that treats all data points equally, while EMA prioritizes recent data and reacts faster to price changes.
- SMA provides a smoother line that may be useful for identifying long-term trends, while EMA is more suitable for capturing short-term price movements.
Setting Up Moving Averages in TradingView
Now that we’ve covered the basics, let’s explore how to set up moving averages in TradingView.
Step-by-Step Guide
- Open a chart in TradingView and select the financial instrument you want to analyze.
- Click on the “Indicators” button at the top of the chart.
- Search for “Moving Average” in the search bar, and you’ll see various moving average options.
- Choose the desired moving average type (e.g., “Simple Moving Average” for SMA or “Moving Average Exponential” for EMA).
- Customize the settings, such as the period and color, by clicking the gear icon next to the indicator.
- Repeat the process to add multiple moving averages to your chart if desired.
- If the indicator comes with too many lines by default, you can remove them by clicking on the settings icon on the chart and unchecking them in style.

Tips for Using Multiple Moving Averages
- Consider using moving average crossovers as trading signals. For example, when a short-term EMA crosses above a long-term EMA (9 and 26 periods, for example), it may signal a bullish trend.
- Experiment with moving average ribbons, which consist of multiple moving averages plotted together to analyze the strength and direction of a trend.
Exploring the Best Moving Average Indicators on TradingView
With various moving average indicators available in TradingView, how do you choose the best one for your trading style?
Best Moving Averages for Different Time Frames
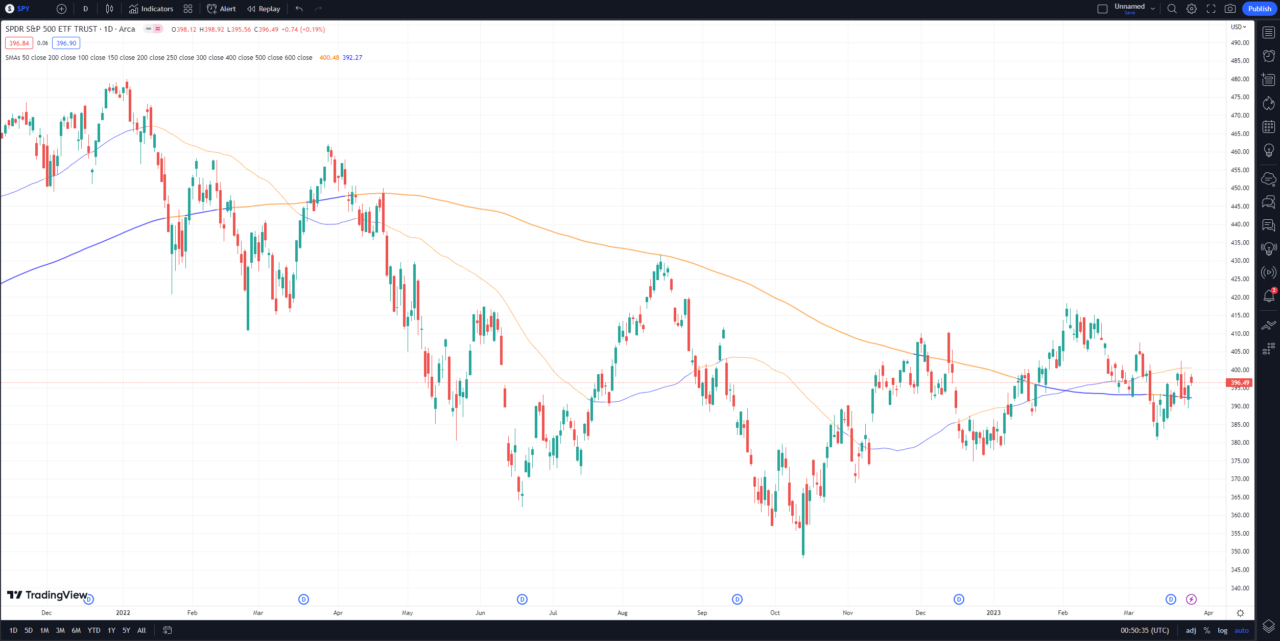
- The best moving average for a daily chart depends on your trading objectives. Common choices include the 50-day SMA and 200-day SMA, often used to identify medium to long-term trends.
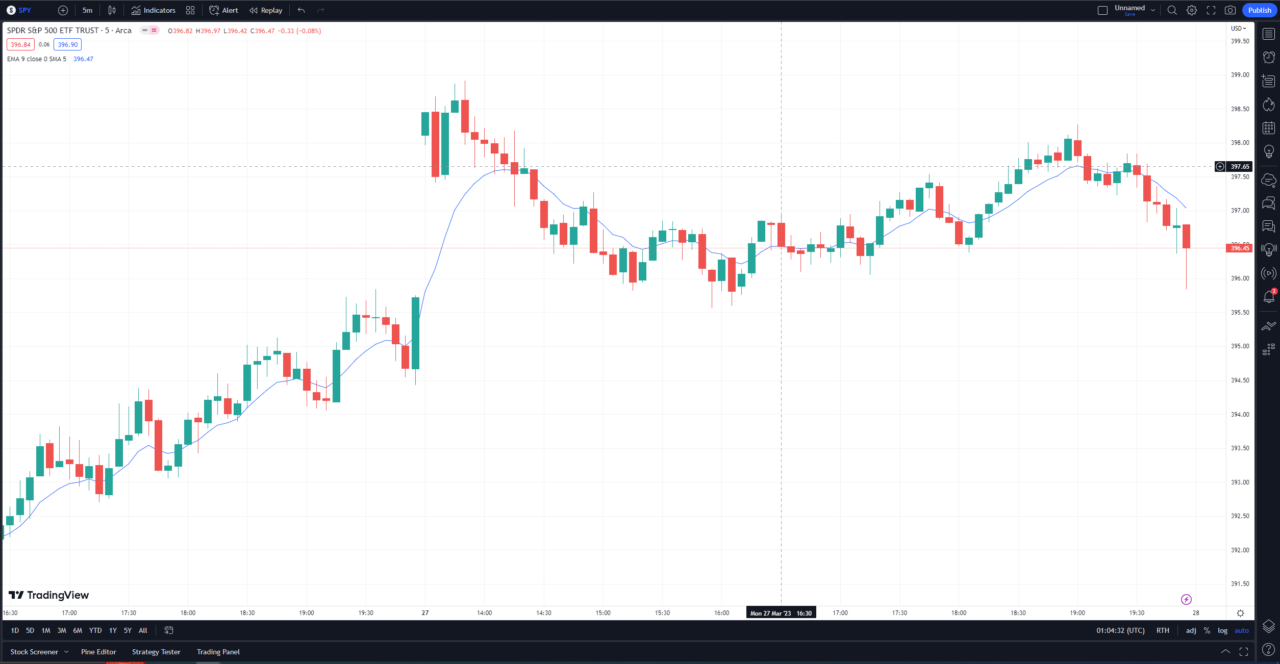
- For intraday trading, consider shorter periods such as the 9-day EMA or 26-day EMA to capture short-term price movements.
Factors to Consider
- Evaluate your trading style and objectives. Are you a short-term trader or a long-term investor?
- Consider market volatility and timeframe. Different moving averages may work better in different market conditions and time frames.
Additional Moving Average Indicators in TradingView
- Weighted Moving Average (WMA): Assigns different weights to each data point, with greater emphasis on recent data. Useful for capturing short-term trends.
- Hull Moving Average (HMA): Combines multiple weighted moving averages for a smoother and more responsive indicator. Often used to reduce lag and identify trend reversals.
TradingView Moving Averages | Bottom Line
Moving averages are essential for traders seeking to analyze trends and make informed decisions. TradingView offers a wide variety of moving averages, each with its unique characteristics and applications.
Whether you’re a novice trader or an experienced investor, understanding and utilizing moving averages can significantly enhance your trading strategy. You can also check out our article comparing MA vs. EMA vs. SMA for more information.
Other TradingView Indicators
As you embark on your trading journey, we encourage you to explore the diverse world of indicators on TradingView, with others, including the volume profile and the Ichimoku clouds.

Get a TradingView Discount
For traders seeking to elevate their trading experience, TradingView usually offers a fantastic opportunity for new users to explore its premium features with a 30-day trial.
This trial period grants you access to various advanced tools and indicators, including the coveted Volume Profile indicator. When you use my referral link, you will also get a discount on your subscription.
This article contains affiliate links I may be compensated for if you click them and make a purchase.
Get Your Free Trading Resources
Grab the free trading journal template plus the same tools we use to stay organized, consistent, and objective.
- Free trading journal template
- Custom indicators, watchlists, and scanners
- Access our free trading community
Enter your email below to get instant access.
No spam. Unsubscribe anytime.


