TradingView Volume Profile: A Comprehensive Guide for Traders
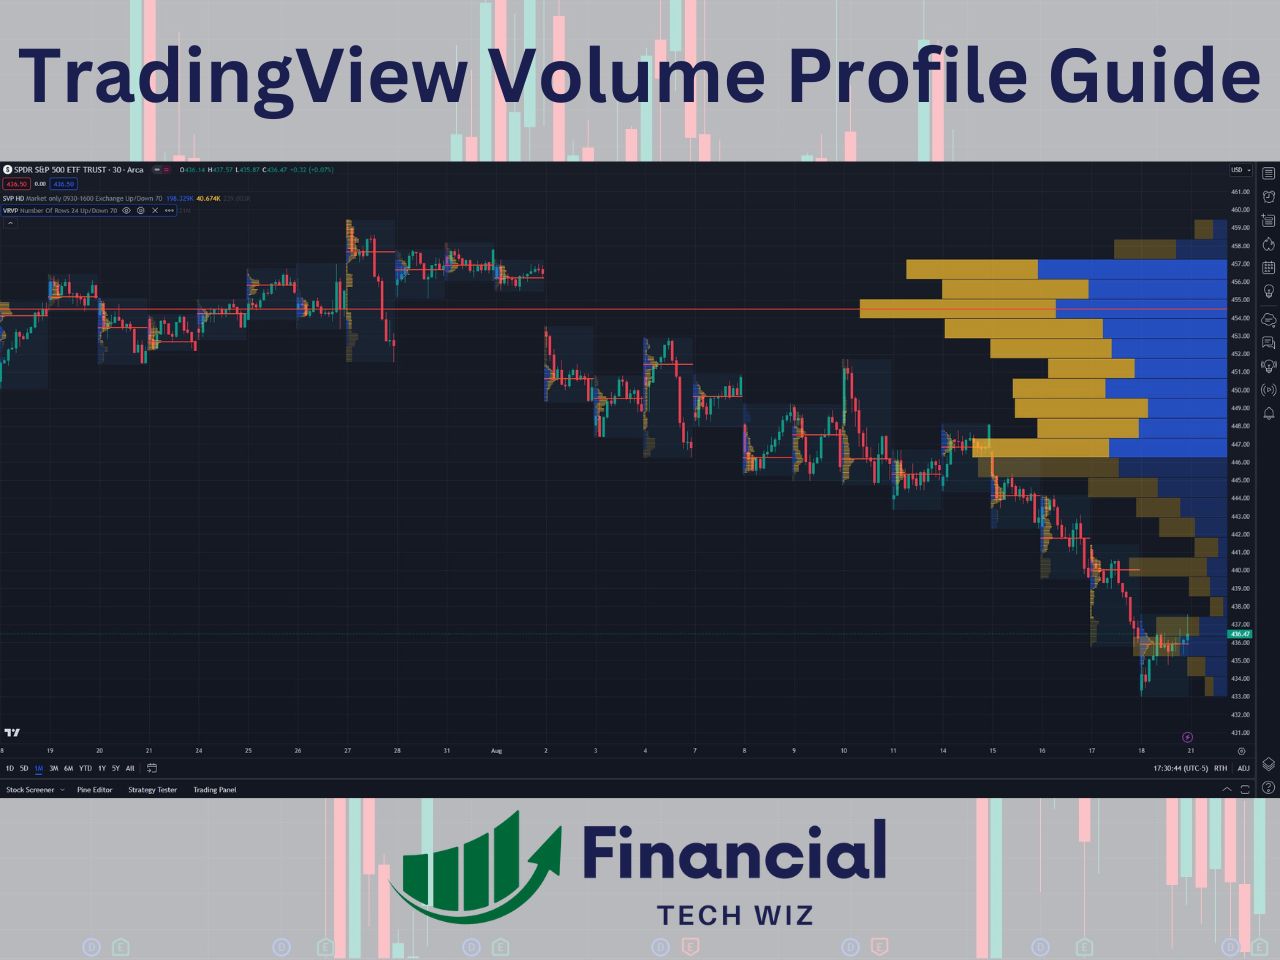
The volume profile is an advanced charting study that shows the amount of trading volume at specific price levels. It is a great way to find support and resistance levels, but you must know how to use the proper time frames and types of profiles to apply them to your trading properly.
The volume profile is a unique tool that isn’t available for all assets on many platforms. However, TradingView allows you to view the volume profile of every asset like stocks, crypto, futures, and forex on a centralized platform.
What is the Volume Profile?
The volume profile is a charting study that maps the volume traded at specific price levels over a user-defined time period. The volume profile requires a premium TradingView subscription, so new users can usually get a free trial to test it out.
- Volume Profile Tools on All Assets
- Market Profile (TPO) Charting
- Footprint Charting
Unlike traditional volume indicators that display volume as vertical bars for each time period, the volume profile plots volume as a horizontal histogram on the chart, providing a clear visual representation of the volume distribution among different price levels.
The key attributes of the volume profile include:
- A holistic view of the volume traded at each price level
- Insights into areas of high liquidity (high volume) and low liquidity (low volume)
- Identification of significant price levels that may act as support or resistance
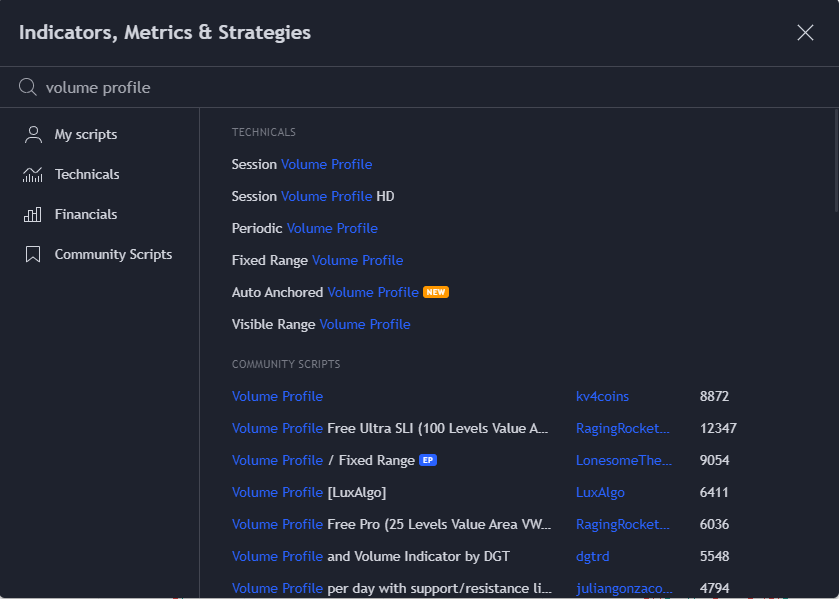
Enabling and Accessing the Volume Profile on TradingView
To enable the volume profile on TradingView, follow these simple steps:
- Open a chart on the TradingView platform
- Navigate to the toolbar at the top of the chart
- Select the “Indicators” icon (looks like a flask)
- Search for “volume profile” in the search bar
- Choose your desired volume profile type (visible range, fixed range, session volume, etc.)
- The volume profile will be added to the chart
Types of Volume Profile Indicators on TradingView
There are five main types of Volume Profile indicators available on TradingView:
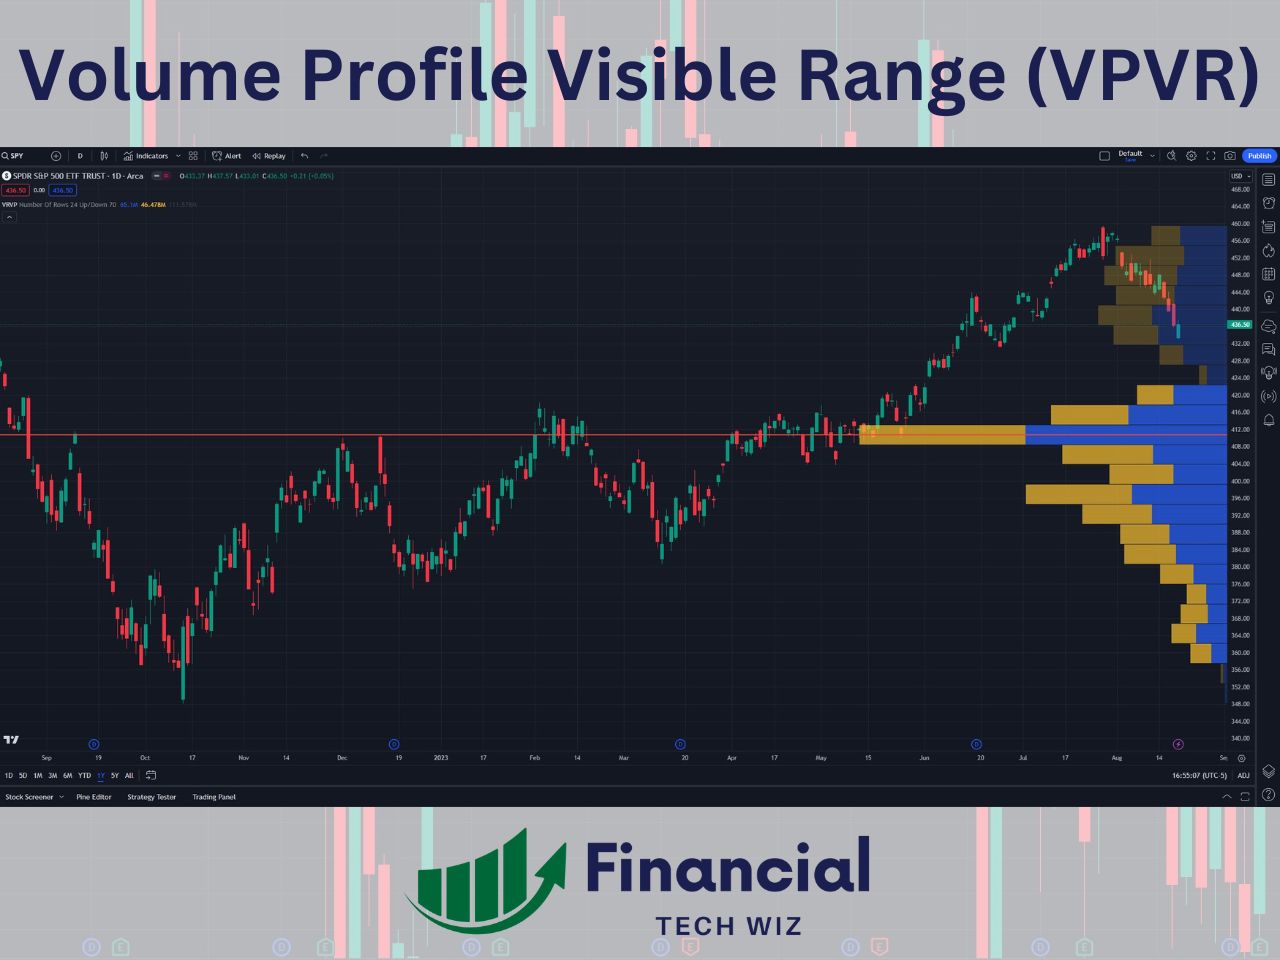
Visible Range Volume Profile (VRVP Indicator)
Displays volume distribution for the visible range of bars or candles on the chart. It adjusts dynamically as you change the chart view. The VRVP allows swing traders to determine long-term supply and demand levels to base entries and exits.
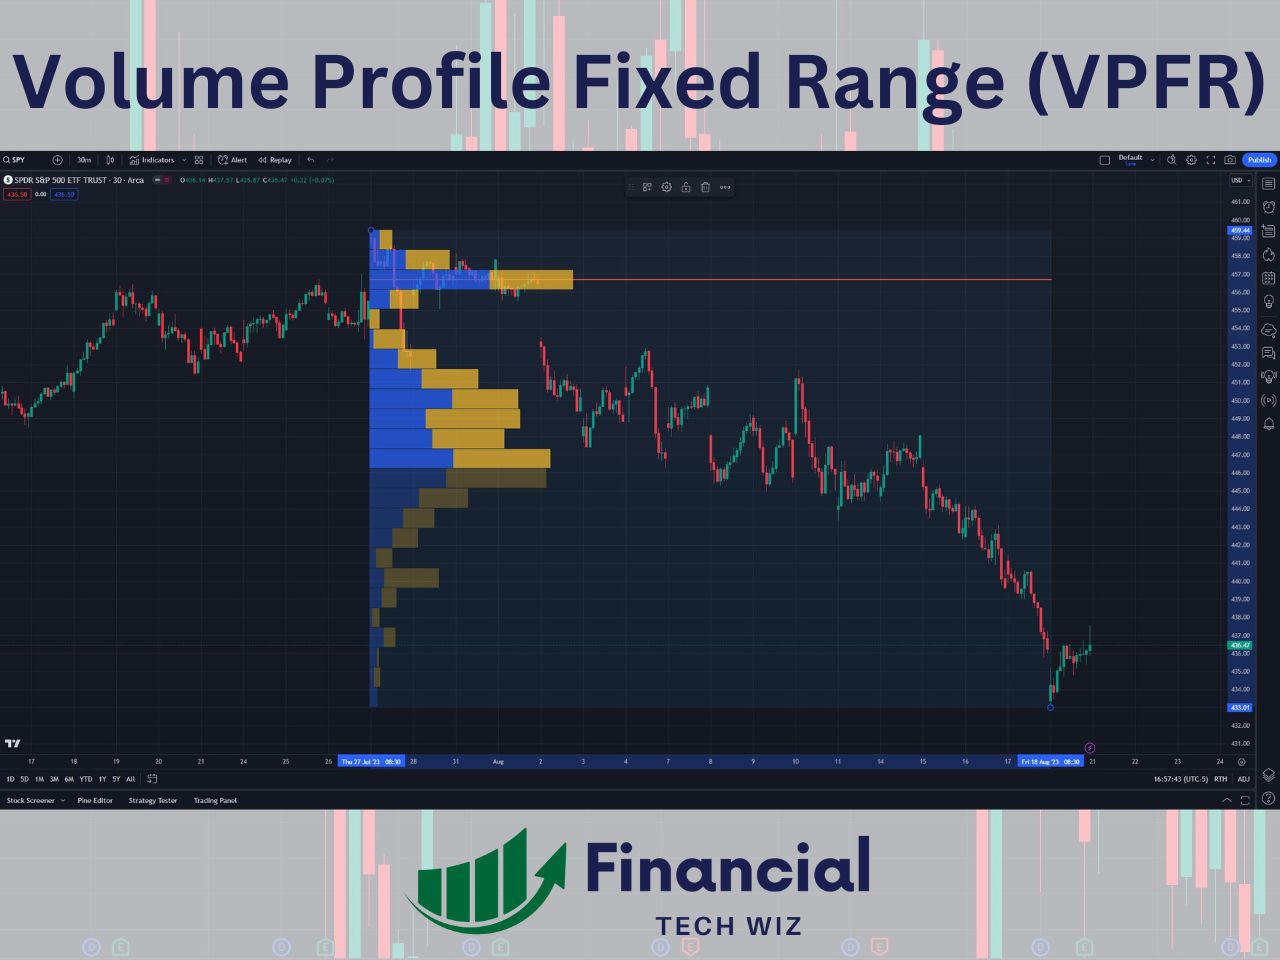
Volume Profile Fixed Range (VPFR)
Allows you to define a fixed range for the volume profile based on a specific time period. This one is similar to the VRVP, but you must manually pick two points.
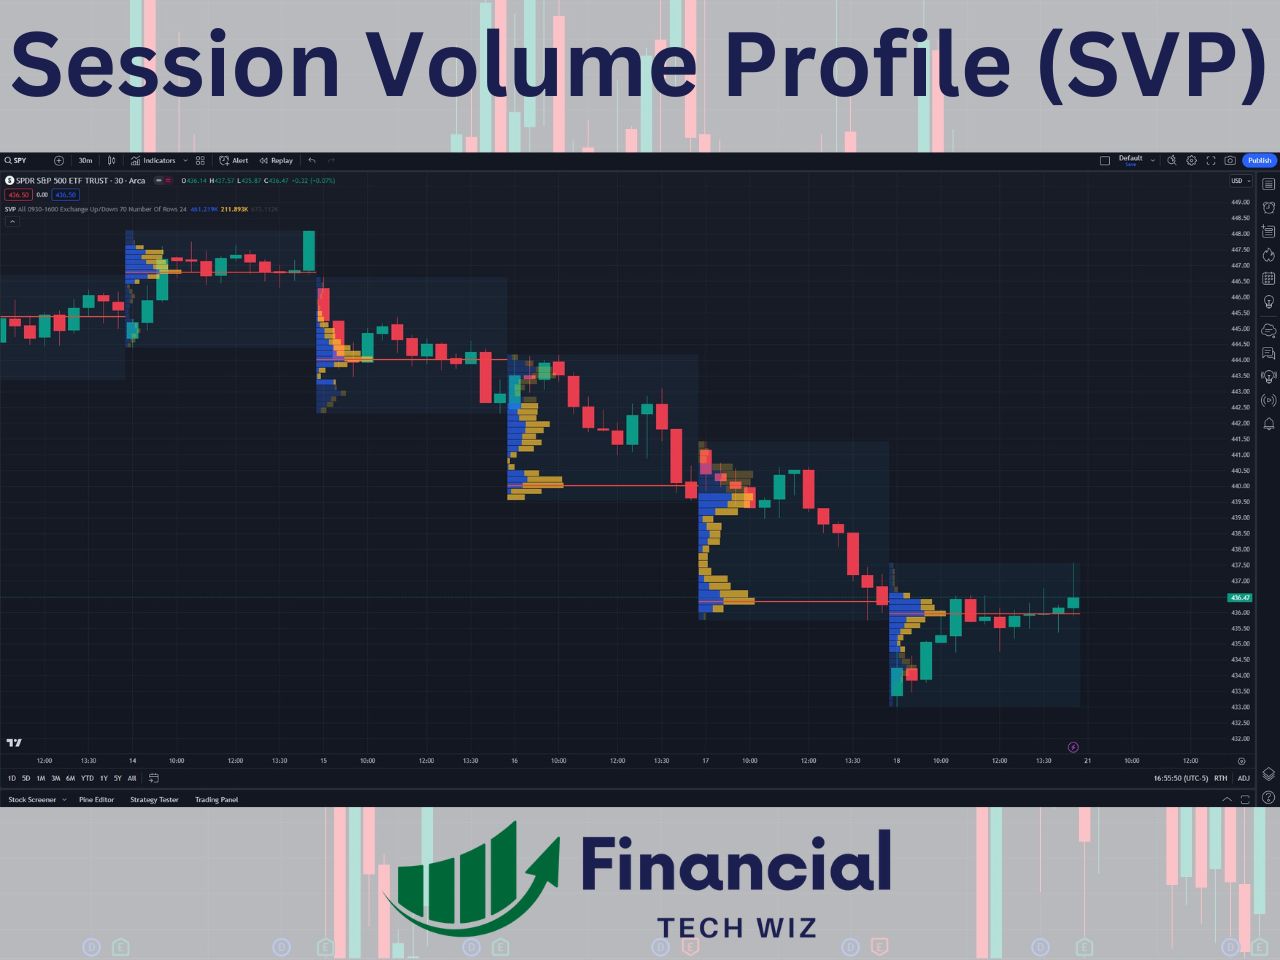
Session Volume Profile (SVP)
Shows volume distribution for individual trading sessions. SVP is also referred to as the Volume Profile Session Volume (VPSV). The SVP is commonly used by day traders since a new profile is generated each day.
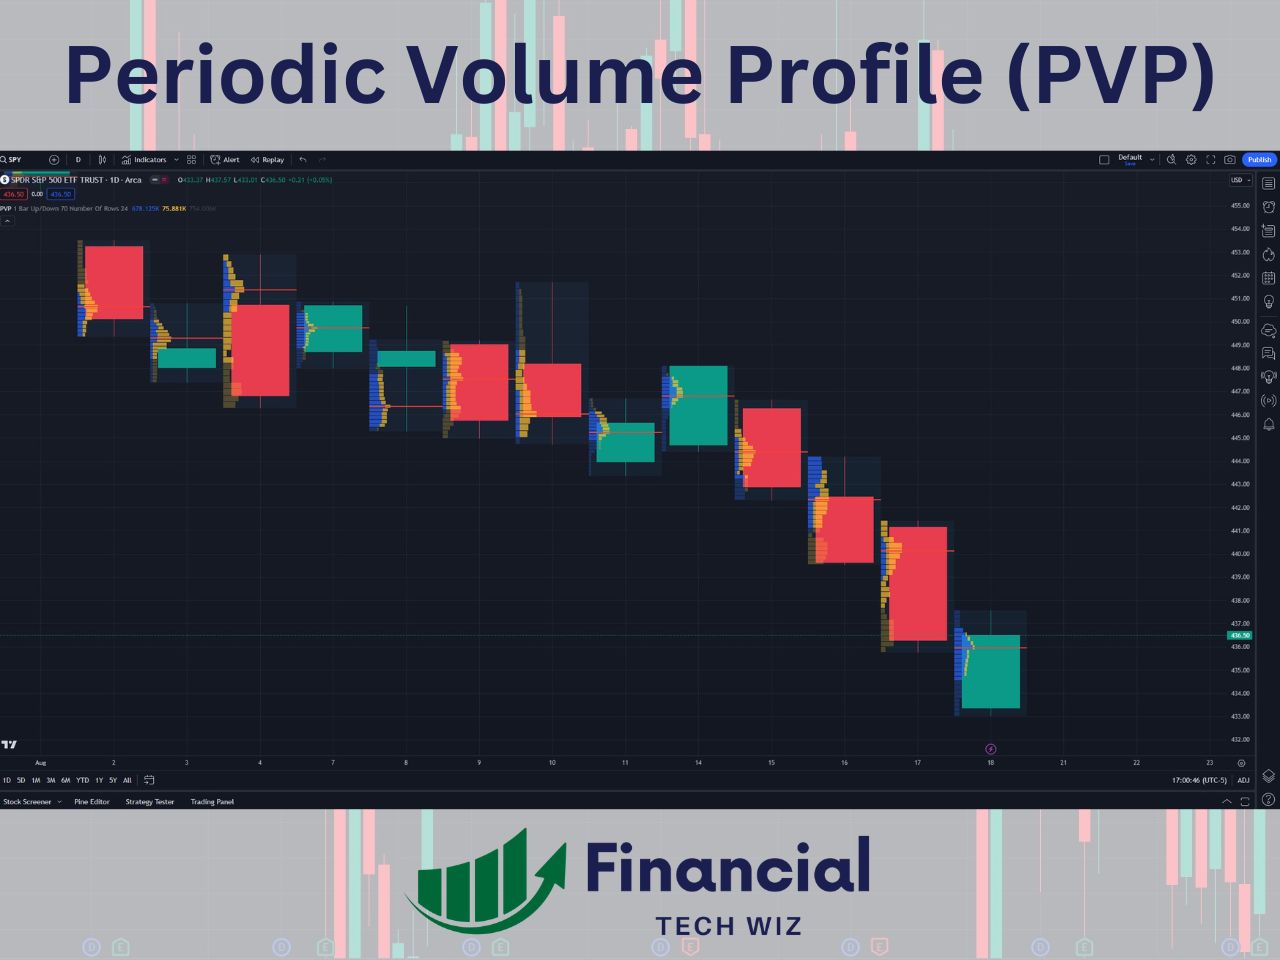
Periodic Volume Profile
The periodic volume profile will display a volume profile for different periods of time. For example, you can see the volume profile for each daily candle if you use the daily chart and set the period to 1. The periodic volume profile is not used as commonly as the SVP and VRVP.
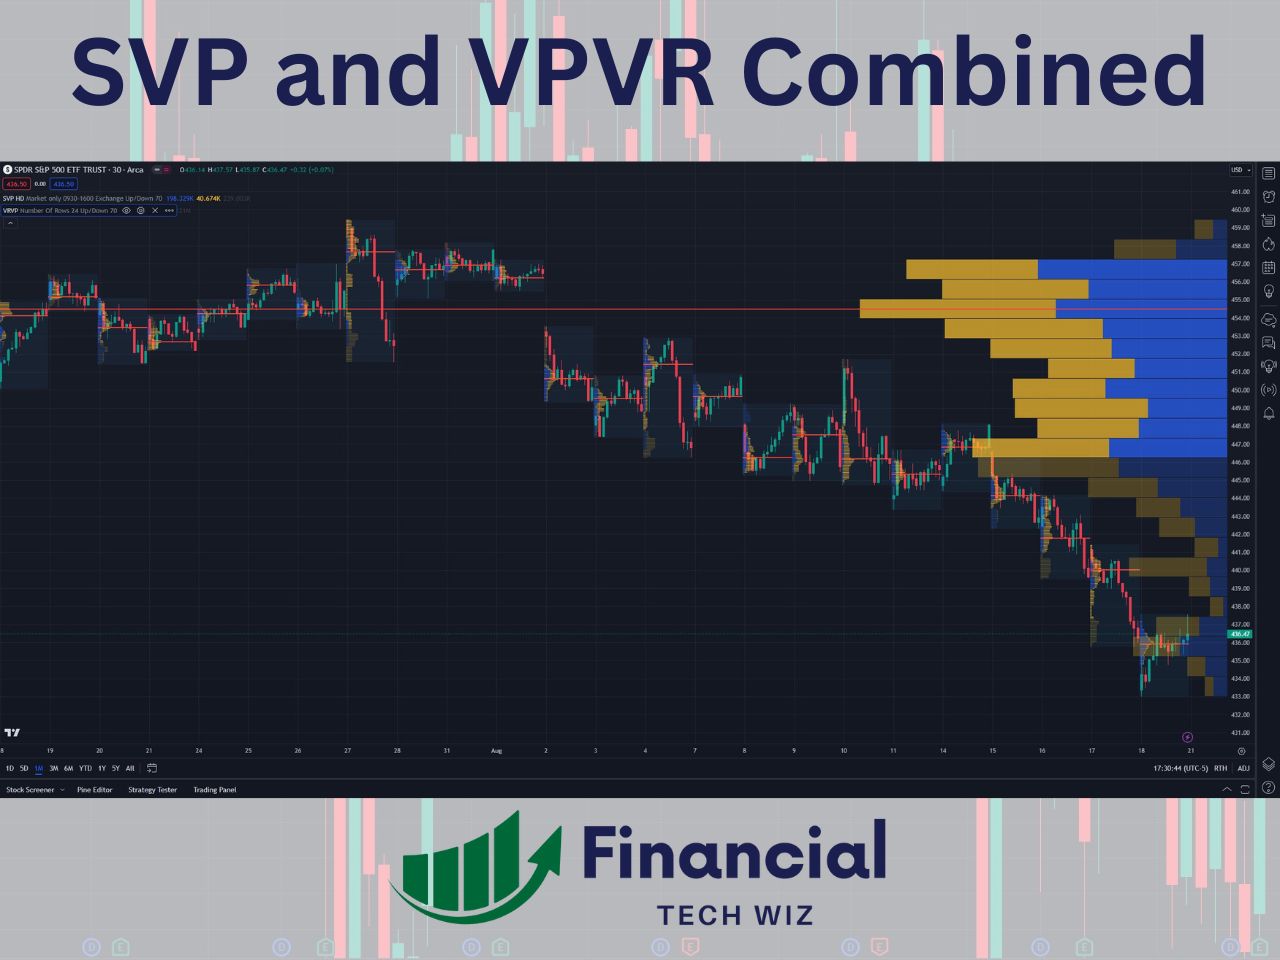
Each type of Volume Profile is for different uses. The session volume profile is commonly used by day traders, while the volume profile visible range may be used more by swing traders. However, using both the session volume profile and the visible range volume profile is a great way to analyze supply and demand on all time frames.
Combining the SVP and VRVP
When you combine the SVP and VRVP, you can view long-term and short-term support and resistance levels, making them a deadly combo. For example, when a long-term and short-term VPOC line up, the level is much stronger.
Join for FREE: Access tons of free educational material!
Don’t miss out – Join now and start learning!
- Free Educational Material
- Community for Like-Minded Traders
- Personalized Trading Education
How to Read the Volume Profile
Reading the Volume Profile involves understanding its key components:
- Point of Control (POC): The price level with the highest volume traded. Similar to the VWAP, price tends to gravitate back toward the POC. It can be used as support and resistance or a take profit level, depending on the trade.
- Value Area (VA): The price range where most of the volume was traded (default set to 70%). It includes Value Area High (VAH) and Value Area Low (VAL), often used as support and resistance levels.
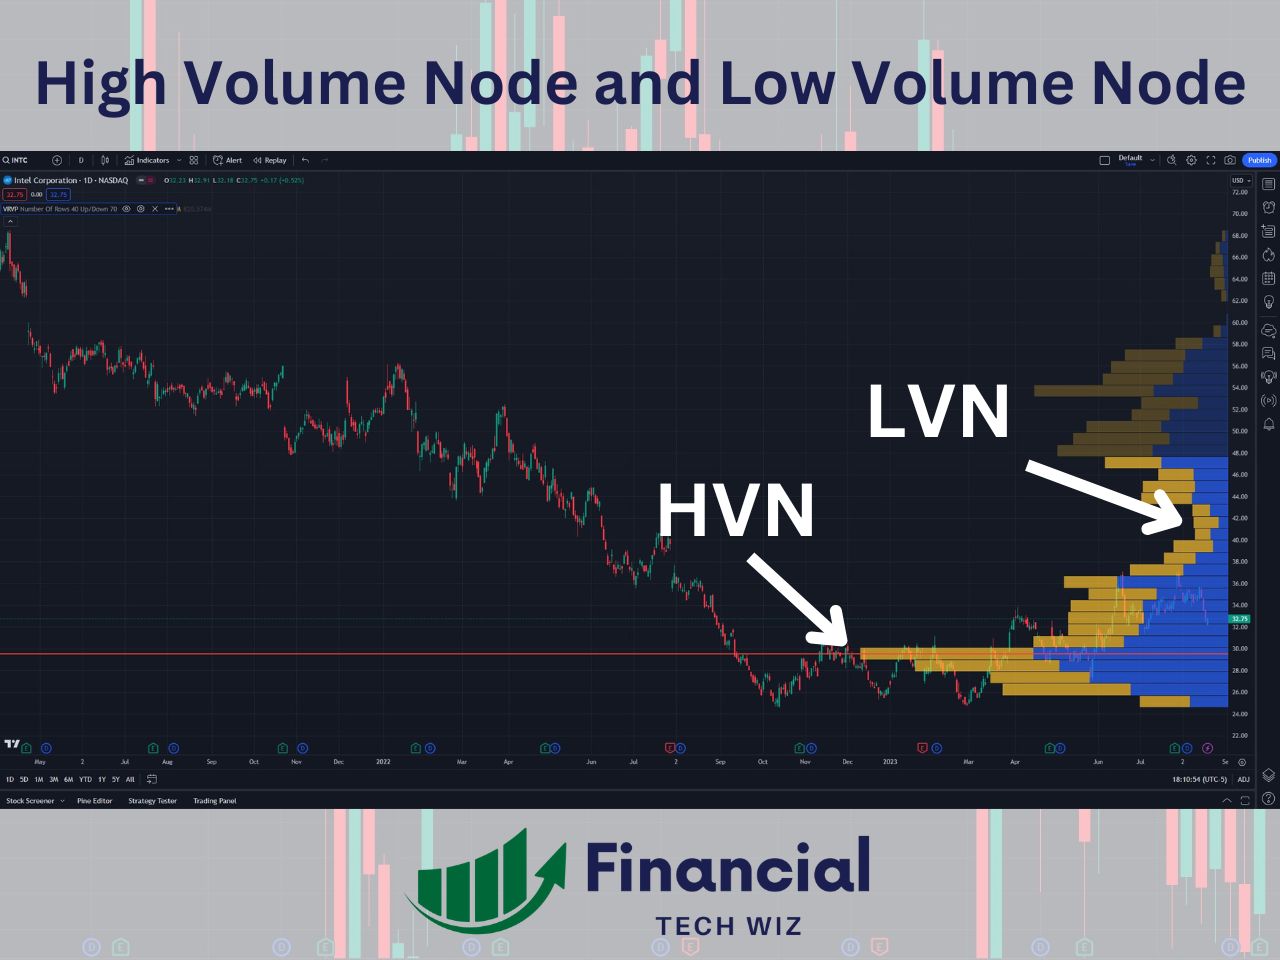
- High Volume Nodes (HVNs): Areas where a large amount of volume was traded. HVNs may indicate strong support or resistance levels.
- Low Volume Nodes (LVNs): Areas with low volume indicating potential price breakouts or quick price movements. When price enters into a LVN, it generally moves quickly to the next HVN.
Volume Profile Customization and Settings in TradingView
TradingView allows users to customize the appearance and settings of the volume profile indicator. Here are some notable customization options:
- Row Size: Adjusts the height of histogram bars, allowing you to view volume distribution at different levels of granularity.
- Volume Type: Choose between total volume, buy volume, or sell volume to view different aspects of trading activity.
- Value Area Percentage: Set the percentage of volume to be included in the Value Area (default is 70%).
- Color Settings: Customize the colors of the histogram, POC, and Value Area to suit your visual preferences.
These customization options give traders the flexibility to tailor Volume Profile to their individual trading needs.

Tips for Effective Use of Volume Profile
To make the most of the Volume Profile indicator, consider the following tips:
- Combine with Other Indicators: Use volume profile in conjunction with other technical indicators, such as moving averages or trend lines, to enhance your analysis and validate trade setups.
- Monitor Key Levels: Pay attention to the POC, VAH, VAL, HVNs, and LVNs. These levels often act as significant support or resistance and may influence price action.
- Analyze Market Conditions: Use volume profile to assess the balance or imbalance in the market. Balanced markets have a symmetrical volume distribution, while imbalanced markets may indicate a strong directional bias.
- Validate Breakouts: Use low volume nodes to identify potential breakout levels. Price may move quickly through these areas due to low liquidity.
Free Volume Profile Indicator on TradingView
While the volume profile is a paid indicator on TradingView, you can use the RS: Market Profile custom indicator as a free alternative. It will not provide the volume bars, but you can get the value area based on volume and the volume point of control (VPOC) using this indicator.
How to Set up the RS: Market Profile as a Free Volume Profile Indicator on TradingView
1- Add the custom indicator using this link and scroll down to add the indicator to your favorites.
2- On a TradingView chart, click indicators, and add the RS: Market Profile
3- Click the gear icon on the indicator at the top left of the chart to edit the settings
4- Ensure “Highlight POC Based on VP” and Use VP POC for Value Area” are checked
5- Change TPO characters to the letters
6- Change the timeframe to daily (if you use fixed, you can get volume numbers for one day or an extended period. This is explained more below under the section: Using the Fixed Timeframe on RS: Market Profile to See the Volume).
7- Customize the VP Poc and value area colors to your liking
8- Change your chart to a line or remove the candles altogether if you only want to see the profile (The two lines on the left of the letters indicate the open price and close price. The close price is the current price if the market is open).
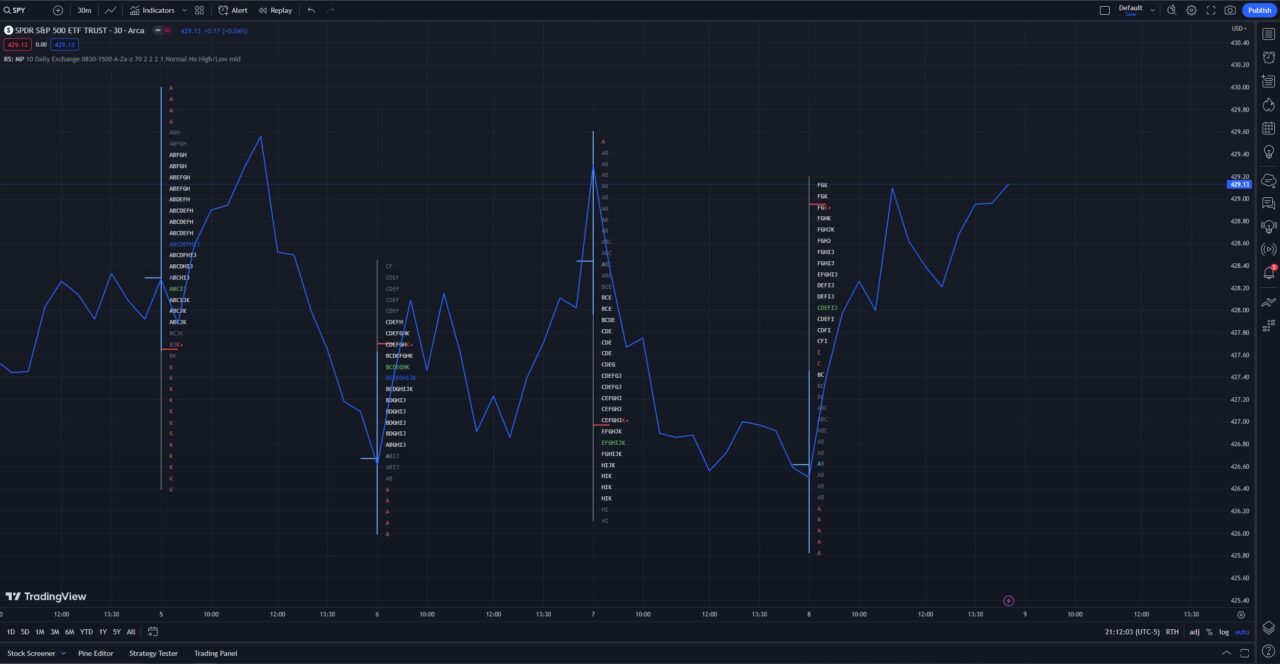
Reading the RS: Market Profile as a Volume Profile
The image above shows the final product of customizing the RS: Market Profile indicator to be similar to a volume profile. On my chart, the white letters indicate the value area based on volume. The green letters are the volume point of control (VPOC).
This indicator works best on highly liquid tickers such as futures, but you can use it on SPY and QQQ for free to track the indices. Additionally, you can view volume numbers based on price if you use the fixed timeframe.
Best Volume Indicators on TradingView
In addition to Volume Profile, TradingView offers a variety of volume indicators to complement your analysis. Some popular volume indicators include:
- On Balance Volume (OBV)
- Chaikin Money Flow (CMF)
- Accumulation/Distribution Line (ADL)
- Money Flow Index (MFI)
While each indicator provides valuable insights, volume profile stands out for its ability to map volume distribution at specific price levels, making it an indispensable tool for many traders.
Market Profile vs. Volume Profile
The market profile is another charting study that organizes price AND time information into a distribution similar to the volume profile. The volume profile only takes volume into account. Here are some key differences:
- Market Profile: Organizes price data into a statistical distribution based on time and volume. It represents the market’s activity over time and highlights prices where the market spent the most time, in addition to the volume profile. Market Profile is often presented as a bell-shaped curve or “TPO” (Time Price Opportunity) chart.
- Volume Profile: Only displays the volume traded at specific price levels and does not include time spent. It is pretty much the market profile except without the time aspect.
Keep in mind that the volume profile can be used on longer time frames, while the market profile is primarily used for day trading.
How Much is TradingView?
It’s important to note that access to the Volume Profile indicator is available exclusively for Premium users. Luckily, you can sign up for a free trial using our affiliate link to test out the volume profile indicators. If you decide to continue, volume profile indicators are available on all plans, including the cheapest one.
TradingView Volume Profile | Bottom Line
TradingView is definitely the best platform for accessing the volume profile for all assets. It makes it convenient to track stocks, crypto, futures, and forex from a single platform.
While paying for TradingView may not be necessary for everybody, it is definitely worth getting a TradingView free trial to test out risk-free.
Get Your Free Trading Resources
Grab the free trading journal template plus the same tools we use to stay organized, consistent, and objective.
- Free trading journal template
- Custom indicators, watchlists, and scanners
- Access our free trading community
Enter your email below to get instant access.
No spam. Unsubscribe anytime.


