TradingView Tutorial | How to Use TradingView for Beginners
TradingView is one of the most popular and powerful web-based platforms for charting, technical analysis, and trading. Whether you are a beginner or an experienced trader, you can benefit from the features and tools that TradingView offers.
In this TradingView tutorial, you will learn how to use TradingView like a pro, from setting up your account and charts to using indicators, alerts, drawing tools, and more.
How to Use TradingView Charts
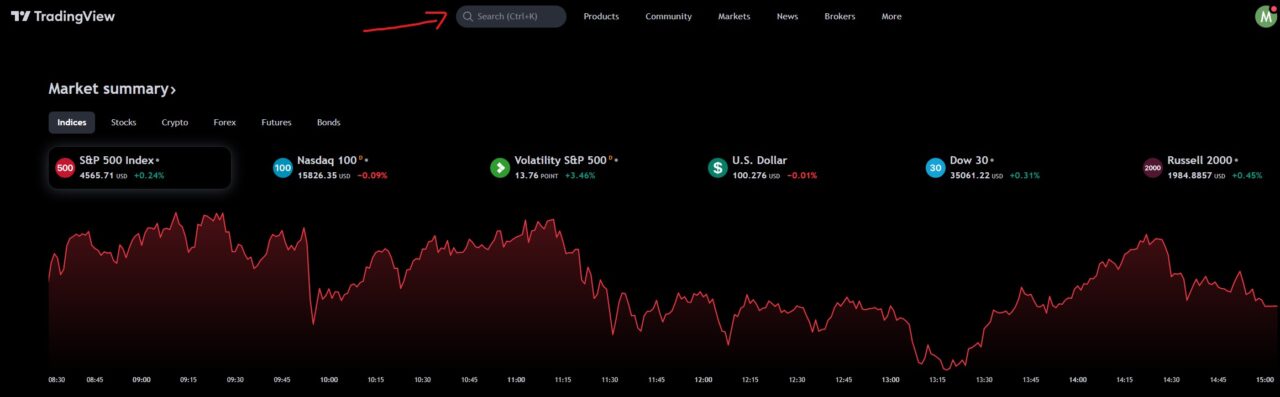
The first step to using TradingView is to create a free account on their website. You can also upgrade to a paid plan for more features and benefits. Once you have an account, you can access the TradingView homepage, where you can see the latest market news, ideas, and charts.
Exclusive Deal: 30-Day FREE Premium Access + Bonus Credit
Don’t Miss Out – Sign up for TradingView Now!
- Advanced Charts
- Real-Time Data
- Track all Markets
To start using the TradingView chart, you need to type a symbol into the bar at the top of the homepage. You can enter any asset that you want to analyze, such as stocks, forex, cryptocurrencies, commodities, indices, etc. For example, if you want to see the chart of Apple stock, you can type AAPL and click on it.
The chart will open in a new tab, where you can customize it according to your preferences. You can change the chart type, time frame, layout, colors, and more. You can also add indicators, drawing tools, alerts, and other features that we will explain later in this tutorial.
Drawing tools on TradingView
One of the most useful features of TradingView is the drawing tools. These are tools that allow you to mark up your charts with lines, shapes, patterns, text, and other elements. You can use them to identify trends, support and resistance levels, chart patterns, Fibonacci retracements, and more.
To access the drawing tools on TradingView, you need to click on the icon on the left-hand side of the screen that looks like a line. This will open a menu with different categories of drawing tools, such as trend lines and channels. You can select any tool that you want to use and click on the chart to apply it.
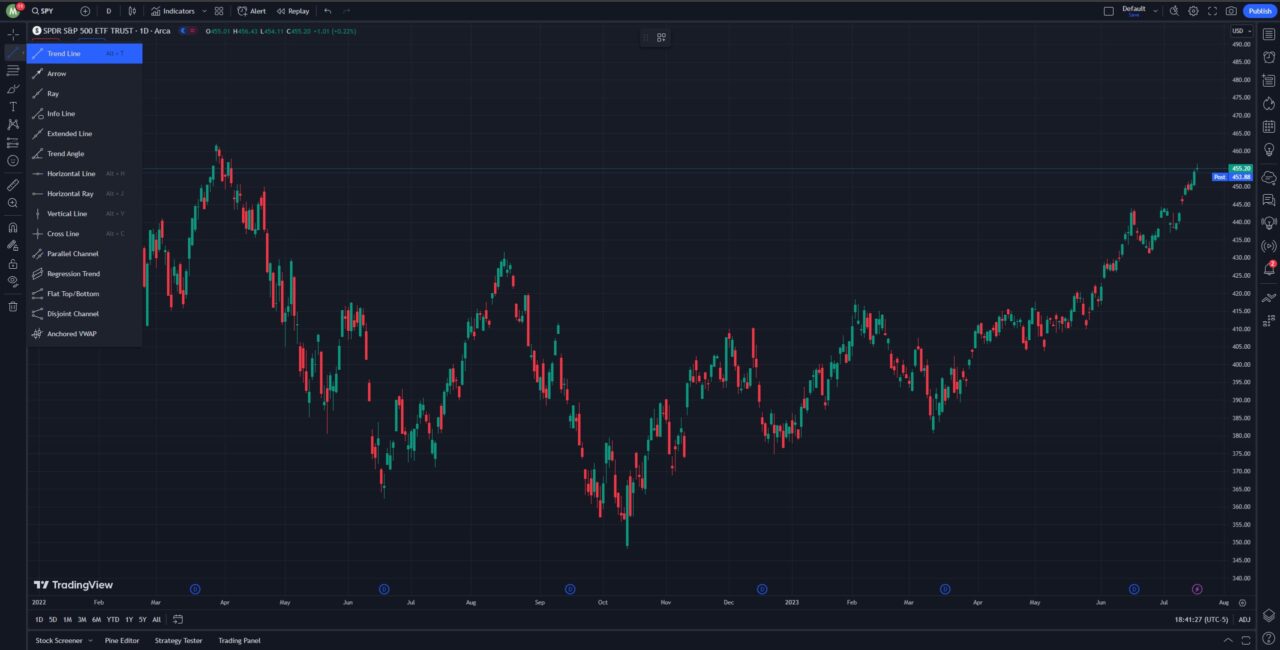
You can also customize the settings of each drawing tool by right-clicking on it and choosing “Settings.” You can change the color, style, thickness, visibility, and other options of each tool. You can also duplicate, lock, hide, or delete any drawing tool by right-clicking on it and choosing the appropriate option.
If you want to learn more about how to draw on TradingView and how to use different drawing tools effectively, you can check out our article on how to draw on TradingView.
Using Indicators on TradingView
Another powerful feature of TradingView is the indicators. Indicators can help you identify trends, momentum, volatility, volume, and other aspects of the market.
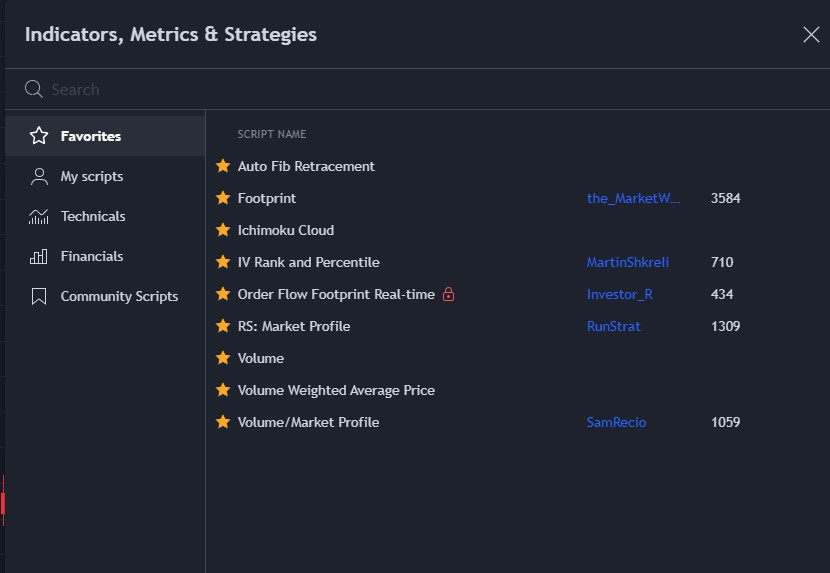
To add indicators to your chart on TradingView, you need to click on the indicators icon at the top of the screen. This will open a menu that allows you to search for all types of indicators, including custom ones built by other traders. Once you find the indicator you want, simply click on it.
The indicator will appear on your chart as a new panel or overlaying the price action. You can customize the settings of each indicator by clicking on its name on the top left corner of its panel or by right-clicking on it and choosing “Settings.”
You can learn more in our article covering the best TradingView indicators.
How to use the TradingView Stock Screener
TradingView also offers a stock screener feature that allows you to discover stocks for both trading and investing.
To access the stock screener on TradingView, you can access it from the home page under products -> screeners. Or you can click the stock screener at the bottom left of your chart.
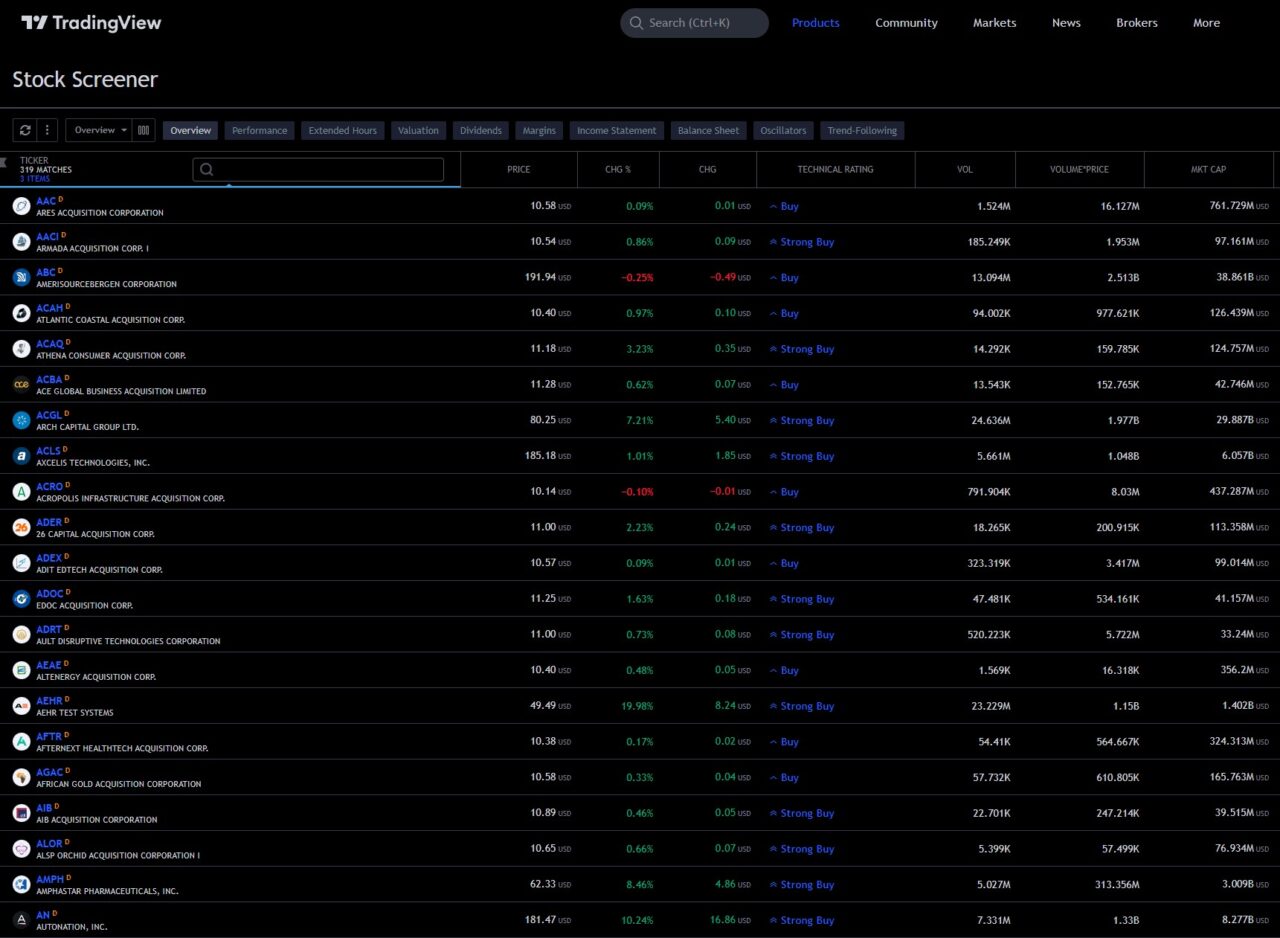
You can filter stocks by price, volume, market cap, dividend yield, P/E ratio, EPS growth, and more. You can also filter stocks by technical indicators and patterns, such as moving averages, RSI, MACD, breakouts, candlestick patterns, and more.
You can learn more about how to use the TradingView stock screener in our comprehensive article.
Can you Actually Trade on TradingView?
TradingView allows you to connect with brokers to trade directly on the charts. However, many people just use TradingView as a charting platform and trade on a brokerage.
The advantage of trading on TradingView is that you can execute your trades faster and easier without switching between platforms. The disadvantage is that you may have limited options for brokers, fees, and features.
To trade on TradingView, you need to have a paid plan and a supported broker account. You can see the list of supported brokers on the TradingView website.
Once you have connected your broker account, you can start trading on TradingView. Consider our article on the best TradingView brokers to learn more.
How to use TradingView for Cryptocurrency
TradingView also supports cryptocurrency charts, which you can view and analyze the same way as stocks and forex. However, there are some differences and options that you need to be aware of when using TradingView for cryptocurrency.
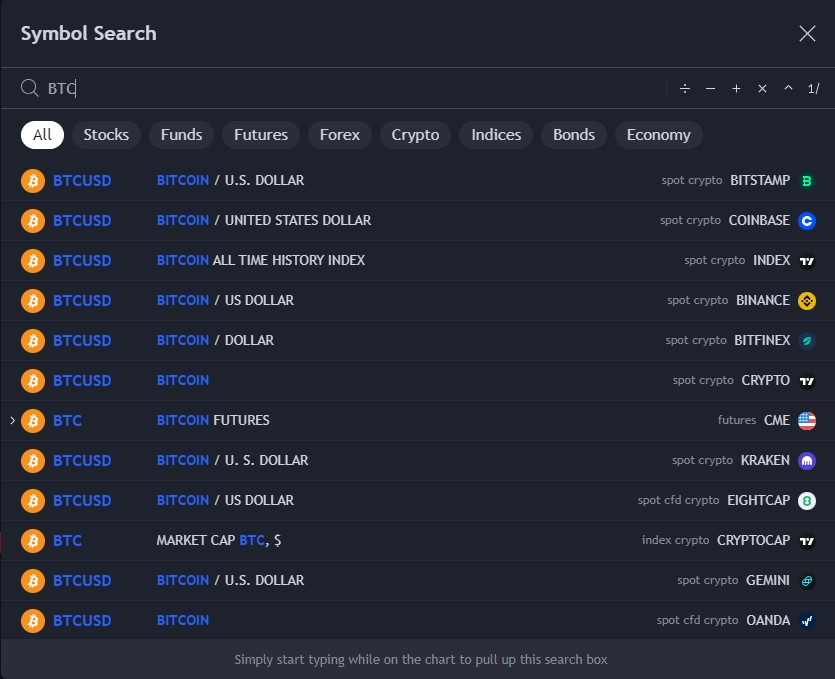
One of the main differences is that you can choose from different exchanges that offer cryptocurrency trading. For example, if you want to see the chart of Bitcoin, you can type BTCUSD and choose from various exchanges, such as Coinbase, Binance, Bitfinex, etc. Each exchange may have different prices, volumes, liquidity, fees, etc., so it is important to pick the one that suits your needs and preferences.
Another difference is that you can view cryptocurrency charts in different currencies, such as USD, EUR, GBP, JPY, etc. For example, if you want to see the chart of Bitcoin in Japanese yen, you can type BTCJPY and choose an exchange that offers this pair.
Apart from these differences, you can use TradingView for cryptocurrency in the same way as for other assets. You can add indicators, drawing tools, alerts, and other features to your cryptocurrency charts. You can also trade cryptocurrencies on TradingView if your broker supports them.
How to use TradingView for Day Trading
TradingView is also a great platform for day trading. Day traders use short-term price movements and technical analysis to make profits from intraday market volatility.
To use TradingView for day trading, you should consider using lower time frames for your charts, such as 1-minute or 5-minute intervals. This will allow you to see more details and opportunities in the daily price action.
Common indicators day traders use include the 9 and 26-EMA lines and the volume profile.
How to Use Order Flow in TradingView
TradingView offers several indicators that can help you use order flow in your analysis, such as volume profile, footprint charts, and market profile. These indicators display the volume and transactions of buyers and sellers at different price levels and time intervals.
They can help you see where the most trading activity occurs, where the market is balanced or imbalanced, where the market is likely to move or stall, etc. The volume profile is an advanced TradingView indicator that requires a premium subscription to use, so consider signing up for a free trial to test it out.
If you want to learn more about how to use order flow indicators on TradingView and how to interpret them effectively, you can check out these articles:
How to use TradingView – Bottom Line
TradingView is a versatile and powerful platform that can help you improve your trading performance and results. It offers a wide range of features and tools that can help you analyze any asset in any market. You can customize your charts, add indicators, use drawing tools, set up alerts, trade directly on the charts, and more.
In this TradingView tutorial, we have covered the basics of how to use TradingView for different purposes and styles of trading. However, there is much more to learn and explore on TradingView. You can check out our website for more tips, tutorials, and ideas.
If you want to start using TradingView today, you can sign up for a free trial using our affiliate link. You will get access to all the features and benefits of TradingView for 30 days without any risk or obligation. You can also upgrade to a paid plan for more features and benefits at any time.
FAQ
Is TradingView good for beginners?
TradingView is a great platform for beginners who want to learn how to analyze and trade the financial markets. TradingView offers a user-friendly interface, a wide range of features and tools, a supportive community, and a free plan that allows you to access most of the functionalities.
Can you use TradingView without a broker?
Yes, you can use TradingView without a broker if you just want to use it as a charting and analysis platform. You can access thousands of markets and assets, add indicators and drawing tools, set up alerts, and share your ideas with the TradingView community.
Related Articles
TradingView Paper Trading Tutorial
Get Your Free Trading Resources
Grab the free trading journal template plus the same tools we use to stay organized, consistent, and objective.
- Free trading journal template
- Custom indicators, watchlists, and scanners
- Access our free trading community
Enter your email below to get instant access.
No spam. Unsubscribe anytime.


