
How to Draw on TradingView (Step by Step, Every Tool + Shortcuts)

TradingView‘s drawing toolbar is the most underused weapon on the platform. Most traders stick to a single trendline and never touch the tools that actually speed up analysis. This guide walks through every drawing tool, the shortcuts that make them fast, and how your drawings carry across charts and the mobile app.
- TradingView’s drawing tools (trendlines, Fibonacci, boxes, freehand, and text) all live in the left-hand toolbar and work the same way: pick a tool, click your anchor points, then fine-tune from the floating settings panel.
- Speed comes from three habits: build a favorites toolbar, save drawing templates so your styles carry over, and learn the keyboard shortcuts (Alt+T for a trendline, Alt+H for a horizontal line).
- Every drawing tool is free on the basic TradingView plan, and your drawings sync across charts and devices, including the mobile app.
Drawing clean levels is half the work. The other half is knowing which of those levels actually made you money. The Financial Tech Wiz Trading Journal pulls trades in from 25+ brokers and shows win rate and P&L by symbol and hold duration, so you can see which setups are worth drawing.
Start a 7-day free trialGetting Started with Drawing Tools
Locating the Drawing Tools
All of TradingView’s drawing tools live on the left panel of the chart, grouped into seven categories: cursors, lines, Fibs, shapes, annotations, patterns, and prediction. Each category expands into a submenu when you hover or long-click on any tool icon in that group.
Popular Drawing Tools
- Cursor: cross, dot, arrow, eraser
- Trend Line tools: trend line, horizontal line/ray
- Gann and Fibonacci tools: Fib retracement, trend-based Fib extension, pitchfork
- Geometric shapes: path, highlighter, brush, rectangle
- Annotation tools: text, callout, price label, price note, arrow marker
- Patterns: head and shoulders, Elliott wave
- Prediction and measurement tools: long, short, price, and date range
- Icons: emoji range for quick chart marking
The 8 TradingView Drawing Tool Categories (Quick Map)
TradingView groups its drawing tools into eight categories in the left toolbar. Knowing which category holds what saves you from hunting for a tool mid-analysis:
Cursors set how your pointer behaves (arrow, cross, dot, or eraser). Trend line tools cover trendlines, rays, horizontal and vertical lines, and channels, the bread and butter of support and resistance work. Fibonacci tools include retracements, extensions, fans, and time zones (see our full walkthrough on drawing Fibonacci retracement levels in TradingView). Patterns snap classic formations like head and shoulders, triangles, and Elliott waves onto the chart (our chart patterns guide explains what each one signals). Forecasting and measurement tools project price and time and measure moves. Geometric shapes (rectangles, ellipses, arcs) box off zones and consolidation ranges. Annotation tools add text, callouts, and notes. Icons drop emojis and flags to mark events. Every one of these is placed the same way: select it, click your anchor points, then adjust from the settings panel.
How to Use Drawing Tools
Step-by-Step Instructions
Drawing tools in TradingView are used for chart annotation and analysis. Here is the core workflow:
- Open a TradingView chart.
- Select the tool you want from the left-side drawing panel. Long-click any tool icon to see the full submenu for that category.
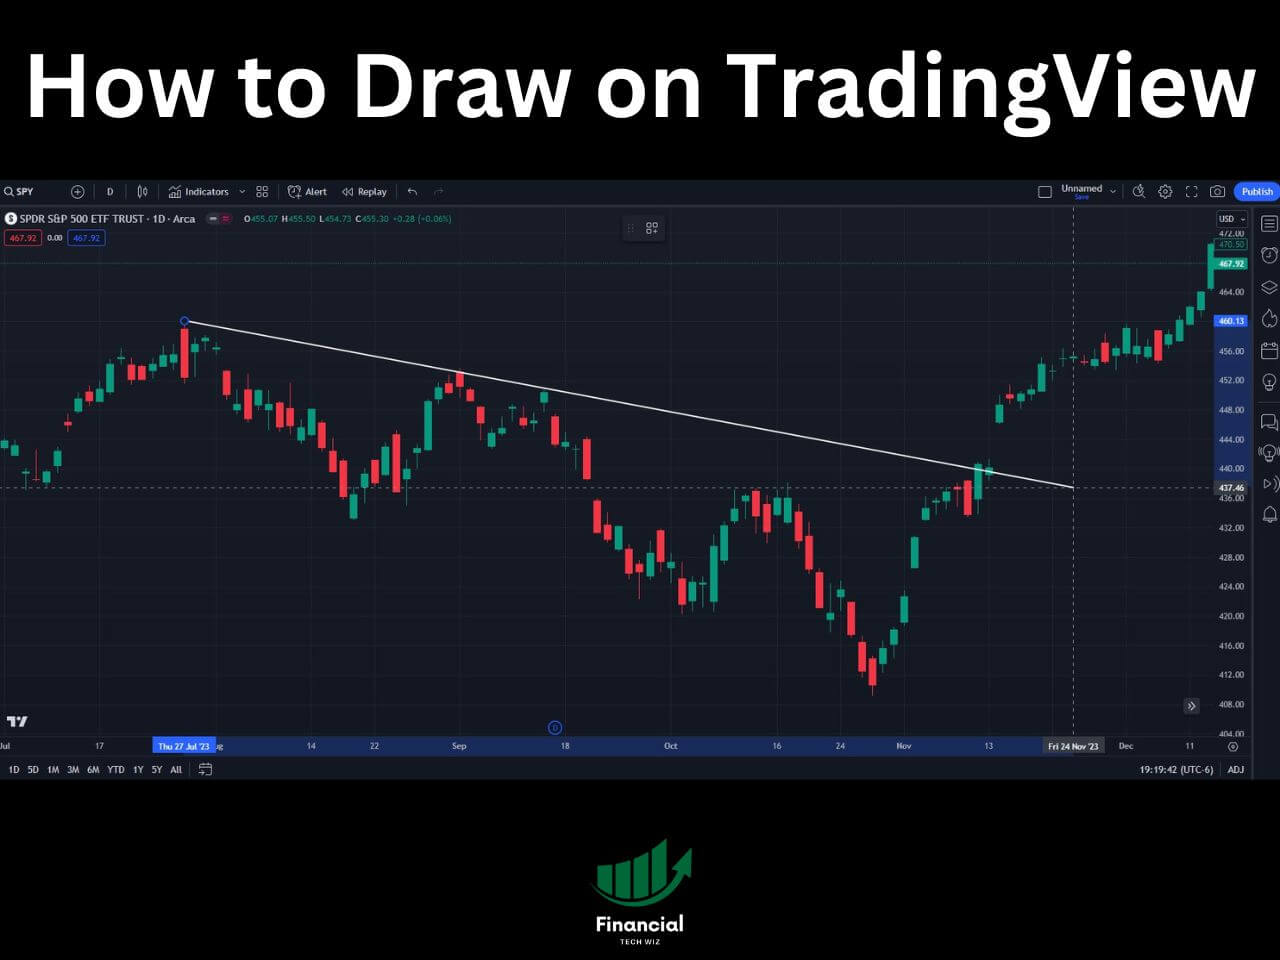
- Click the first anchor point on the chart where you want the drawing to begin. The price level highlights on the Y-axis.
- Click the second anchor point to set the drawing. Most tools place on a double-click; the brush and freehand tools use click-hold-drag.
- Hold Shift while placing the second anchor to lock trendlines horizontal, vertical, or to 45-degree increments.
Drawing in Full Screen Mode
When you enter full-screen mode the main drawing toolbar hides. Use the favorites toolbar, a floating on-chart toolbar of your pinned tools, to keep working without exiting full screen. Add tools to favorites by right-clicking any tool in the left panel and selecting “Add to favorites.”
Draw It Yourself
Every drawing tool in this guide is free on the basic TradingView plan. Open a chart, grab the trendline tool, and start marking your levels in seconds.
Open TradingView FreeFull screen pairs well with a wider view of price, so it helps to know how to zoom out on TradingView before you start drawing longer term levels.
Customizing Drawing Tools
TradingView lets you customize every drawing’s color, thickness, line style, and label display. Two ways to access settings:
- Floating panel: appears automatically when a drawing is selected. Change color, thickness, and style in one click.
- Custom window: click the gear icon in the floating panel, or right-click the drawing and choose “Settings.” This opens a full settings dialog with every available option including price labels, line extension, and ray direction.
Creating a Favorites Toolbar
The favorites toolbar is a floating toolbar that sits on the chart surface so your most-used tools are one click away regardless of the chart mode. To add a tool, right-click any tool in the drawing panel and choose “Add to favorites.” To reposition the toolbar, click and hold the six-dot drag handle on the left edge of the toolbar.
Drawing a Path in TradingView
The Path tool creates a chain of connected line segments ending with an arrow, useful for marking wave sequences and multi-leg trend moves. Here is how to use it:
- Open the Geometric Shapes group and select Path.
- Click the starting point on the chart.
- Click each subsequent point to add a segment. The segments connect automatically.
- Double-click the final point to close the path.
- The arrowhead can appear at the start, end, or both. Toggle this in the tool settings or the floating toolbar.
Drawing Freehand on TradingView
To draw freehand, use the Brush tool under the Geometric Shapes category. Open the group, select Brush, then click and hold while dragging to draw. Release to finish. The Brush respects magnet mode settings, so turn strong magnet off when you want organic freehand lines that do not snap to OHLC values.
Writing on TradingView
To add text annotations, use the Text tool under Annotation Tools. Select the tool, click where you want to place the text, type, then press Enter or click outside the text box to finish. The Callout tool works the same way but adds an arrow pointing to a specific price level on the chart.
Drawing Lines in the TradingView App
The mobile TradingView app supports a subset of drawing tools: trendlines, horizontal lines, Fib retracement, rectangles, and text. To use them:
- Open a chart on the TradingView app.
- Tap the pencil icon to open the drawing menu.
- Select the tool, then tap each anchor point in sequence. On mobile you tap rather than click-hold-drag for most tools.
- The favorites toolbar from desktop is not available on mobile, so access tools from the drawing menu each time.
Drawing Templates: Save Your Styles Once, Reuse Forever
Every drawing tool in TradingView remembers the last style you used, but templates take it further. Open any drawing’s settings, click the Template menu at the top, and save the current style under a name. The next time you grab that tool, pick the saved template from the dropdown and the trendline (or rectangle, or Fib) appears with your color, thickness, line style, font, and price labels already configured. Most traders skip this and re-style every drawing by hand for years. Save the five templates you use most: a primary support/resistance line, a confirmation trendline, a Fib for retracements, a Fib for extensions, and a rectangle for supply/demand zones. You will save hours every month.
Magnet Mode and Snap to Price
Magnet mode is a chart-level setting that snaps your drawings to specific OHLC values on each candle. Click the magnet icon at the top of the drawing toolbar to open three options: weak magnet (snaps if you are within a few pixels), strong magnet (always snaps), and off. Strong magnet is the right default for support and resistance work because it forces every line to land on a real wick or close, not a pixel-rounded estimate. The drawback: pixel-perfect freehand sketches are impossible with strong magnet on, so toggle it off when you draw freehand or annotate text.
Sync Drawings Across Charts and Symbols
By default, a trendline you draw on AAPL stays on AAPL. Open MSFT in the same window and the trendline is gone. To change this, right-click on any drawing, choose the “Lock and Hide” submenu, and look for “Sync drawings to all symbols,” or open Settings > Symbol > Sync Drawings. With sync on, every drawing follows the chart anywhere. This is great for index analysis (a Fib drawn on SPY stays when you flip to QQQ) and a problem for symbol-specific levels (your AAPL trendline now clutters every other ticker). Pick the mode that matches how you trade: indexers go on, single-stock traders go off, multi-chart layout users use the “Sync drawings to charts in this layout” middle option.
Keyboard Shortcuts That Double Your Drawing Speed
TradingView has a full set of TradingView keyboard shortcuts worth learning, and the drawing-specific ones are especially useful. Hold Shift while drawing a trendline to lock it horizontal, vertical, or to 45-degree increments. Hold Ctrl (Windows) or Cmd (Mac) while clicking a drawing to select multiple at once for batch deletion or color changes. Press Esc to cancel a half-drawn object. Press Backspace or Delete with a drawing selected to remove it. Use Ctrl/Cmd + Z to undo the last drawing action. The Object Tree, the icon that looks like stacked horizontal lines on the right side panel, lists every drawing on the chart so you can hide, lock, or delete by name without hunting on the chart itself.
Drawing the trendline is step one. Step two is logging the trade so you can see whether your trendlines are actually predictive. Grab the Financial Tech Wiz free Google Sheets journal: it tracks entry, exit, R-multiple, and tag-based filtering so you can spot which setups your drawings nail and which ones you should stop drawing.
Get the Free TemplateReplay Tool and Drawings: Backtest Your Lines
The Replay tool lets you scroll the chart back in time bar by bar, and any drawing you place stays anchored to its original timestamp. The combination is one of TradingView’s strongest study features: pick a date six months ago, draw the trendline you would have drawn at the time, then step the chart forward bar by bar to see whether the trendline held. Open Replay from the top toolbar, click “Select bar” to set the start date, then use the play controls to step forward. Drawings made during replay are saved on the chart, which is great for a permanent study record but adds clutter if you replay every day. Periodically clean the chart with the Object Tree.
How to Draw on TradingView: Bottom Line
TradingView’s drawing tools are powerful and versatile. The traders who get the most out of them are not the ones who know every tool; they are the ones who have set up templates for their five most-used drawings, enabled magnet mode for their support/resistance work, and learned the keyboard shortcuts that cut annotation time in half. Start there, then explore the more advanced features like sync across charts and the Replay backtest workflow. For a deeper look at the full platform, the TradingView tutorials hub covers every major feature with step-by-step walkthroughs.
Before You Go
If you want to keep learning about TradingView and trading tools, check out these posts:
How to Get a TradingView Free Trial
The Best TradingView Indicators
FAQ
How do I draw a trendline on TradingView?
Click the trendline icon in the left-side drawing toolbar (or press Alt + T on most layouts), click the first anchor point on a wick or close, then click the second anchor to set the line. Hold Shift while you click the second anchor to lock the line horizontal, vertical, or to a 45-degree slope.
How do I draw on the TradingView mobile app?
Tap the chart to bring up the toolbar, then tap the pencil icon to open the drawing menu. The mobile app supports a smaller subset of tools (trendlines, horizontal lines, Fib retracement, rectangles, text), and you draw by tapping each anchor point rather than click-hold-drag. The favorites toolbar from the desktop app is not available on mobile.
Can I save my drawing styles on TradingView?
Yes. Open any drawing’s settings, click the Template menu at the top of the settings window, and save the current style under a name. Future drawings of that tool can be styled in one click by picking the template from the dropdown.
How do I delete all drawings on a TradingView chart?
Right-click anywhere on the chart, choose “Object Tree” or “Remove drawings” to clear every drawing at once. Use Object Tree if you want to delete some but not others; Remove drawings is the nuclear option.
Why are my drawings showing up on other symbols?
The “Sync drawings to all symbols” setting is on. Right-click any drawing, find the sync option (or open chart Settings > Symbol > Sync Drawings), and switch to “off” or to “Sync drawings to charts in this layout” depending on how you want the lines to follow you.
Are TradingView’s drawing tools free?
Yes. Every drawing tool is available on the free TradingView plan. The paid plans add multi-monitor sync, more saved layouts, and the ability to keep more drawings on a single chart, but the toolset itself is identical. See the full TradingView pricing guide for a breakdown of what each plan includes.
Financial Tech Wiz / Free resources
Build a clearer picture of your trading.
Start with the free trading journal template. Keep your trades organized, review your results, and build a consistent review routine.
- Free Google Sheets and Excel trading journal template
- Indicators, watchlists, and scanners
- Access to the free trading community
Ready for automatic trade tracking? Explore the Financial Tech Wiz Trading Journal.
Free resources + trading emails. Unsubscribe anytime.







