How You Can Use Fibonacci Retracements on TradingView
Intro to the Fibonacci Retracement on TradingView
Fibonacci retracement levels have been a staple of technical analysis for centuries, providing traders with valuable insights into potential price reversals and areas of support and resistance.
In this guide, we’ll explore how to effectively use the Fibonacci retracement tool on the TradingView platform, which I believe is the best charting software for all assets.
TradingView Limited Time Offer!
Exclusive Deal: 30-Day FREE Premium Access + Bonus Credit
Don’t Miss Out – Sign up for TradingView Now!
- Advanced Charts
- Real-Time Data
- Track all Markets
The Origins and Importance of Fibonacci Retracement Levels
Fibonacci retracement levels originate from the Fibonacci sequence—a mathematical series of numbers with unique properties. These levels are widely used in trading to identify key areas where price action is likely to occur. The most commonly used Fibonacci retracement levels include:
- 23.6%
- 38.2%
- 50% (not an official Fibonacci ratio, but frequently used)
- 61.8%
- 78.6%
Traders rely on these levels to anticipate possible future price movements and to inform their trading strategies.
How to Use the Fibonacci Retracement Tool on TradingView
TradingView’s platform offers a user-friendly and versatile Fibonacci retracement tool. Here’s how you can use it to enhance your technical analysis:
Step 1: Open a Chart on TradingView
- Select the asset you want to analyze and open its chart.
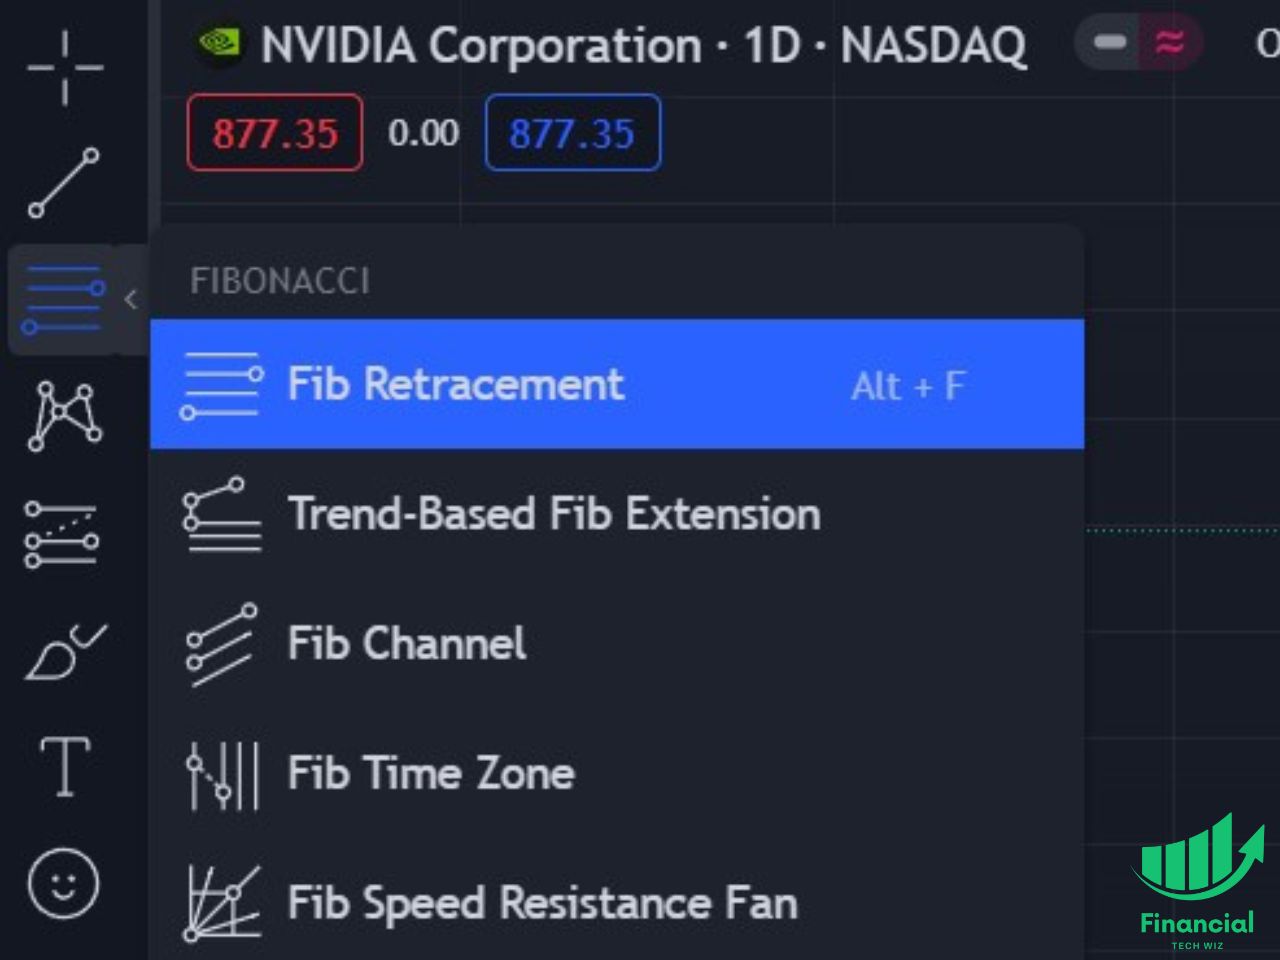
Step 2: Locate the Fibonacci Retracement Tool
- Find the toolbar on the left side of the chart.
- Select the “Fibonacci Retracement” tool.
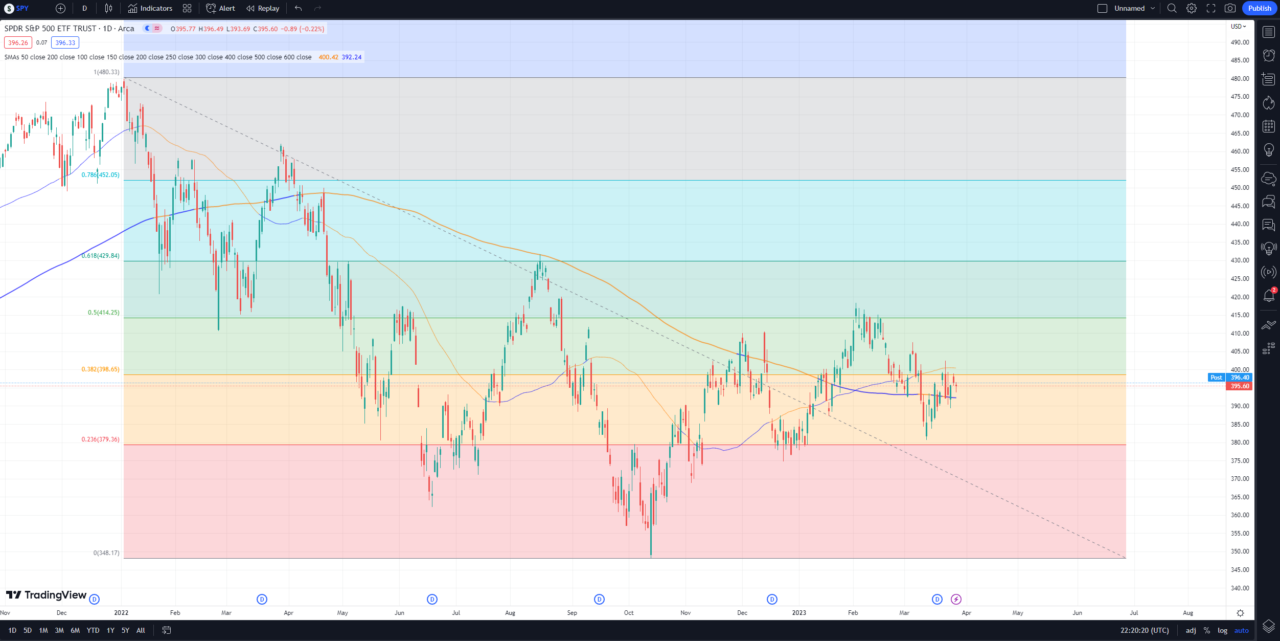
Step 3: Define Two Extreme Points
- Click on the chart with the tool to define two extreme points (a high and a low) on the chart.
- The tool will automatically generate the Fibonacci retracement levels between the two points.
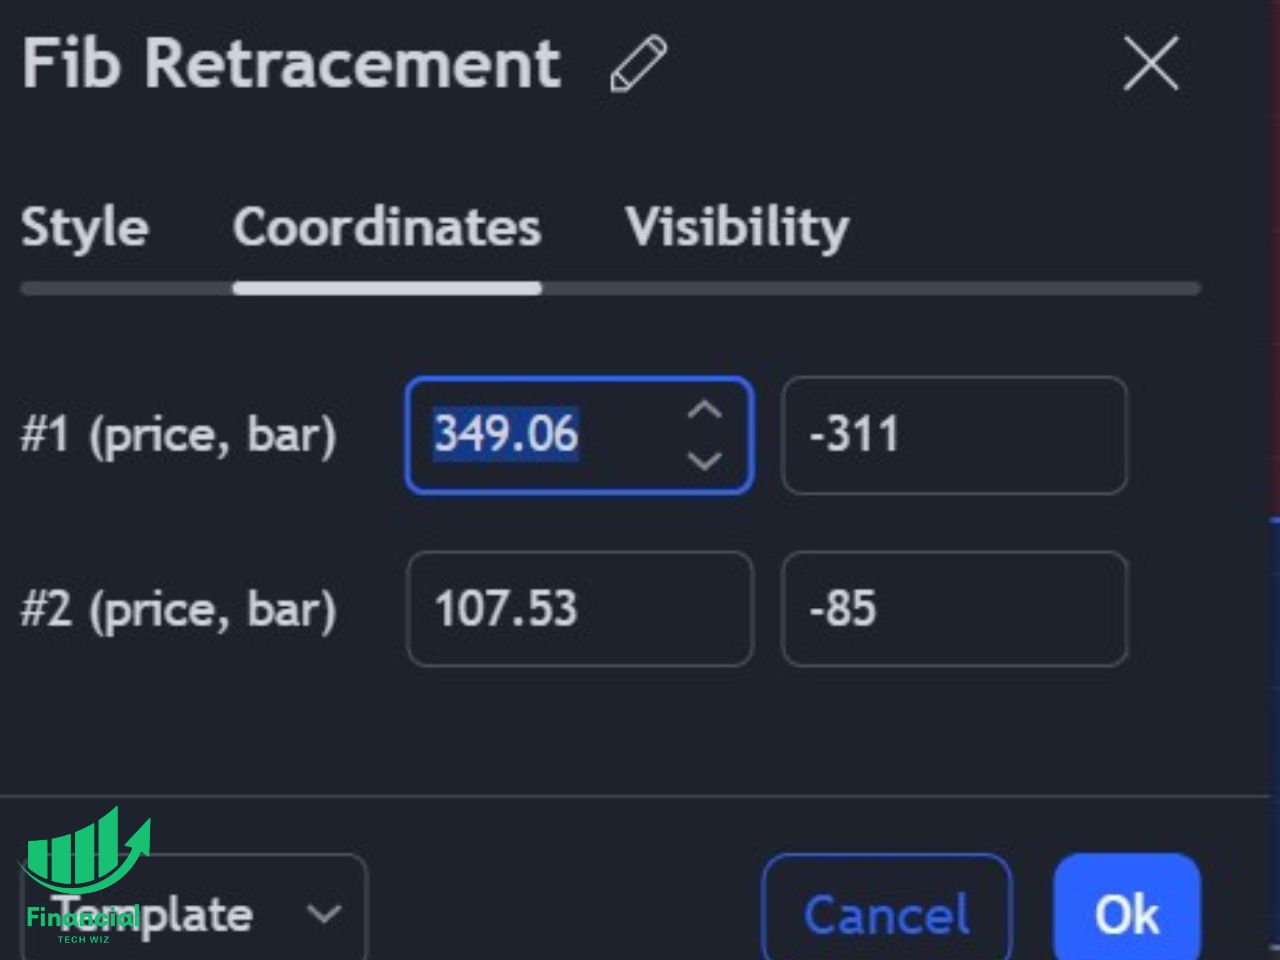
Step 4: Customize the Tool’s Settings
- Right-click the Fibonacci lines and select “Settings” to customize your coordinates, colors, line styles, and visibility.
- You can hover over a candle to determine the exact highs and lows of it and adjust accordingly in the coordinates tab.

Should the First Point be a High or Low?
- If the first point you select on the chart with the Fibonacci tool is a high, the tool will populate the 161.8% level to the upside.
- If the first point you select is a low point on the chart, the tool will populate the downside 161.8% level.
The 161.8% level can help you determine breakout levels to the upside and downside. For example, if you want to determine how high an asset will go if it breaks out of its range to the upside, you would analyze the 161.8% level.
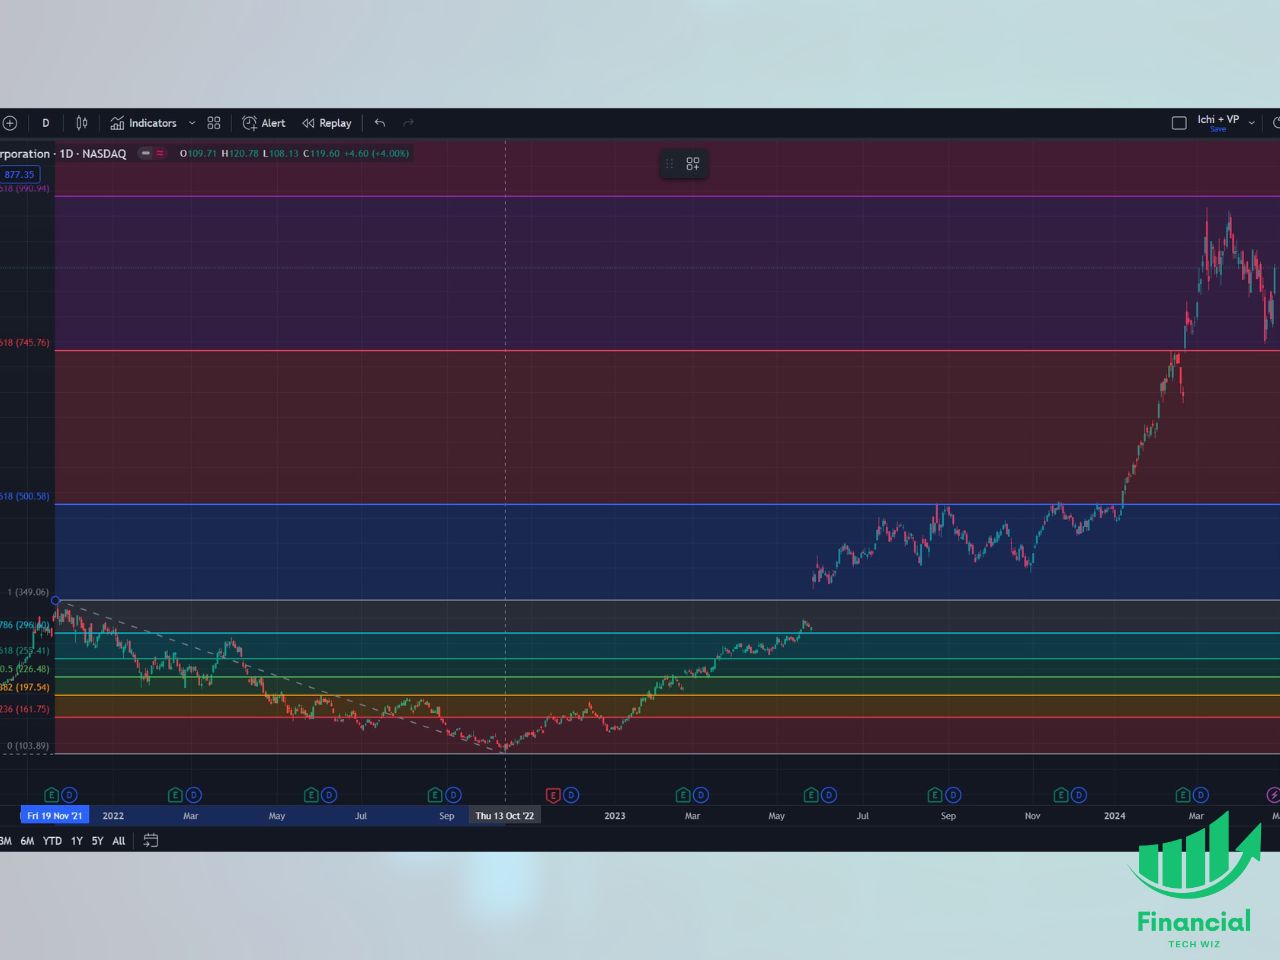
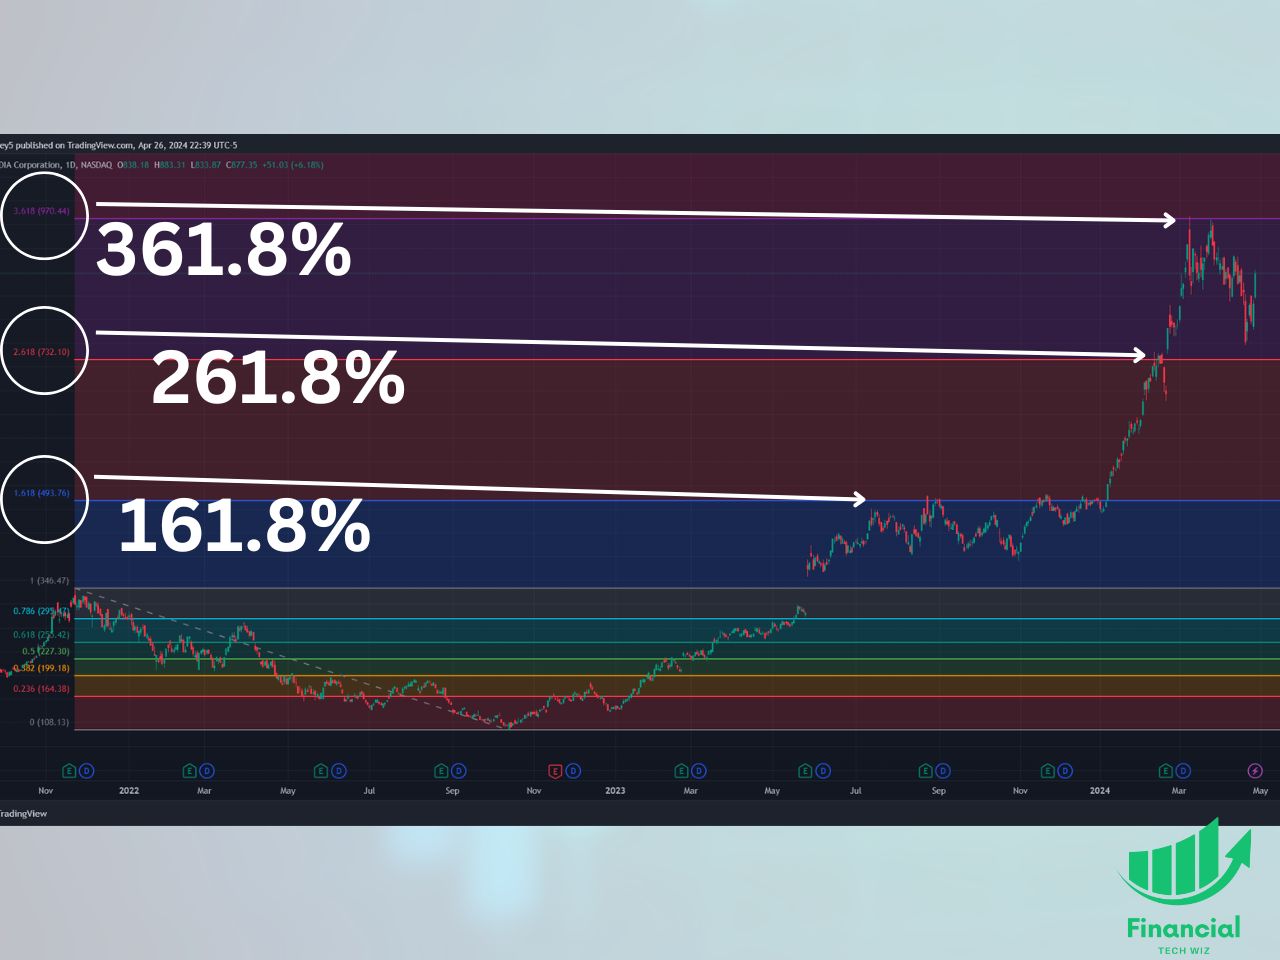
An excellent example of this is on the $NVDA daily chart. If you select the first Fibonacci point at the $NVDA high in 2021 and the second point at the 2022 low, you will see how accurate the 161.8%, 261.8%, and 361.8% levels can be. You can see this in the image:
As you can see, the price clearly reacts to the 161.8%, 261.8%, and 361.8% levels several times. Keep in mind these levels were generated based on the two initial points selected without any hindsight bias into the future, proving how these levels can be effective.
Choosing the Right Time Frame for Fibonacci Retracements
When using the Fibonacci retracement tool, the choice of time frame depends on your trading strategy and goals:
- Short-Term Traders: May use lower time frames such as 1-hour or 15-minute charts.
- Long-Term Traders: May find daily, weekly, or monthly charts more suitable.
The tool can be effectively used on various time frames, depending on whether you are a short-term or swing trader.
The Role of Fibonacci Retracement in Trading
Fibonacci retracement levels are a great technical analysis tool, regardless of which time frame you use. The tool is best used on the daily time frame and longer, and it provides context for where support and resistance levels are.
For example, you can pick the first pivot point at a stock market crash low and then set the second point at a significant high point on the chart. Here are the different Fibonacci retracement levels that will populate:
- 23.6% – official Fibonacci sequence level
- 38.2% – official Fibonacci sequence level
- 50%
- 61.8% – official Fibonacci sequence level
- 78.6% – official Fibonacci sequence level
- 161.8%
- 261.8%
- 361.8%
The official and most important Fibonacci retracement levels are the 23.6%, 38.2%, 61.8%, and 78.6% levels. However, the 50% is commonly used along with the 161.8%, 261.8%, and 361.8% levels.
Exploring the Auto Fibonacci Retracement Indicator on TradingView
TradingView also has an auto Fibonacci retracement tool that automatically adjusts as you change timeframes. This tool is primarily useful for active traders who trade on multiple different time frames.
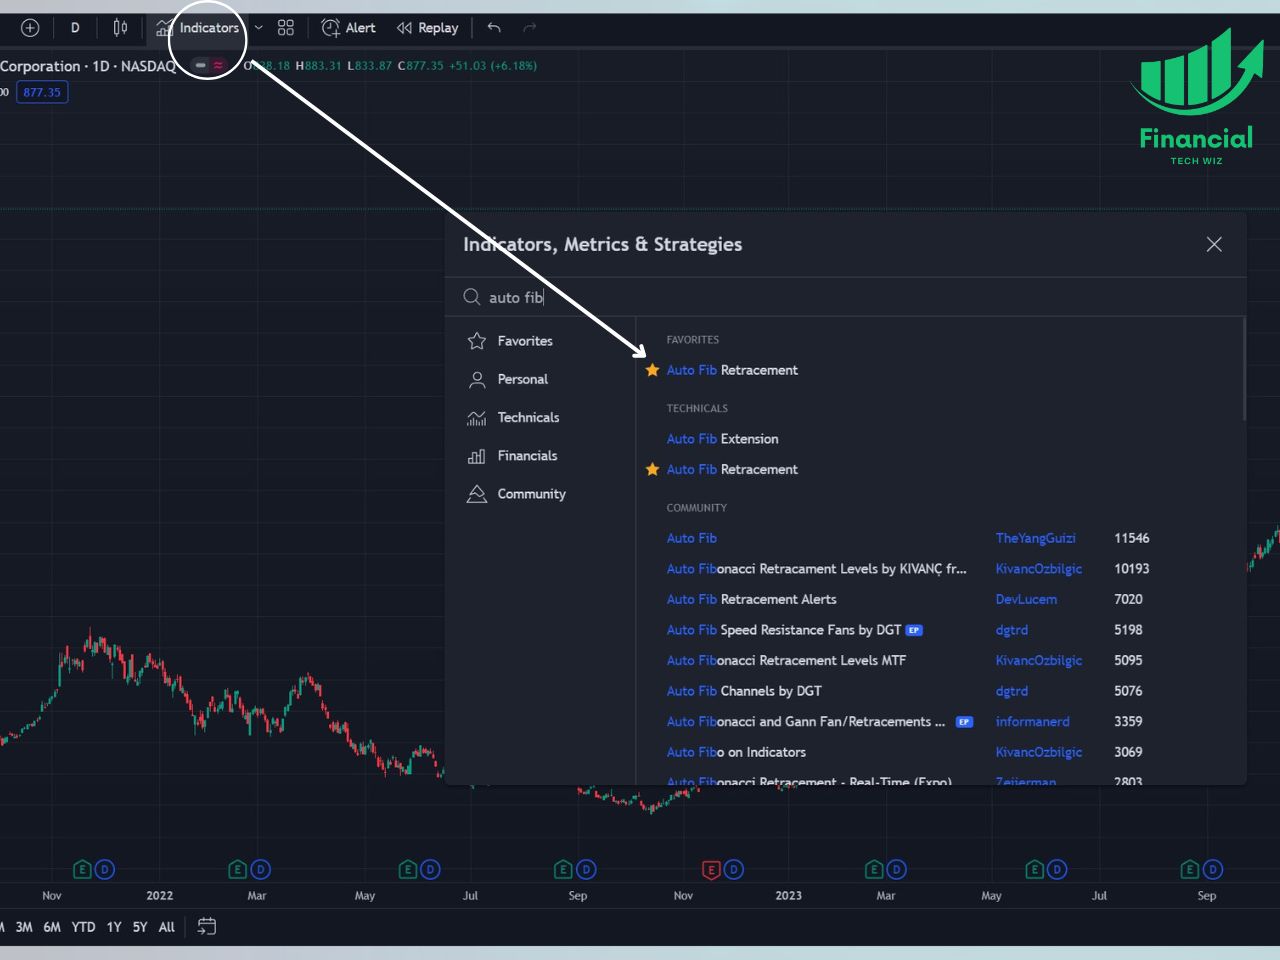
How to Add the Auto Fibonacci Tool to Your TradingView Chart
1- Open any chart on TradingVIew
2- Click on indicators at the top of the chart
3- Type “Auto Fib Retracement” and click on it from the list of indicators
Adjusting the Auto Fibonacci Retracement Settings
Here is how to adjust the settings of the auto Fibonacci retracement tool on TradingView:
1- Hover over the indicator name at the top left of the chart
2- Click on the gear icon
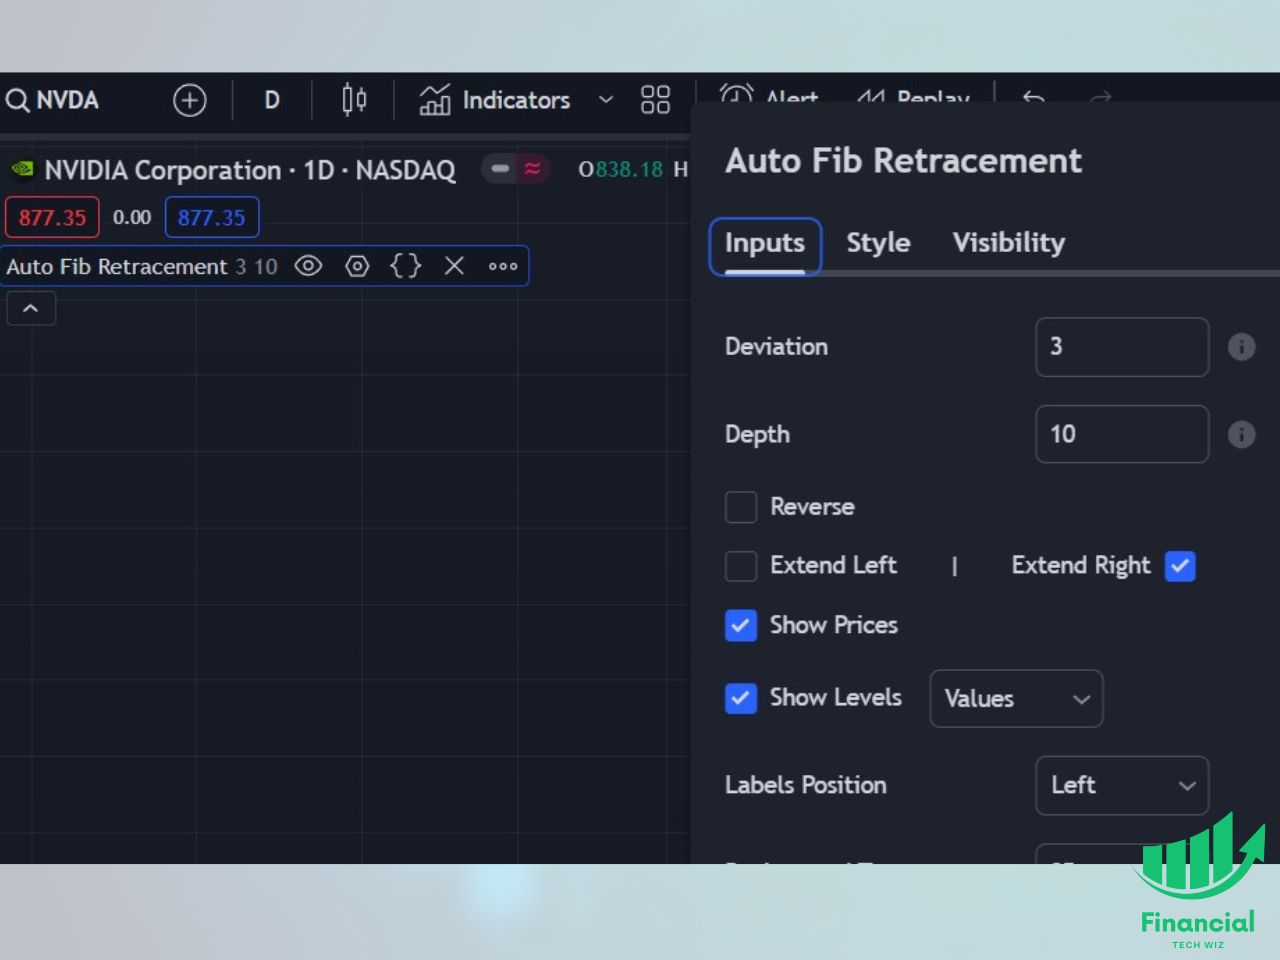
From here, you can adjust a few settings, including:
- Deviation: How much the price will differ from the first selected level. You can mess around with this number until you get consistent results, but using 1-3 is generally the best.
- Depth: How far back the first pivot point will be placed. The bigger the number, the further back the first pivot point will be placed.
- Extend Left/Right: You can extend the Fibonacci levels to the left and/or right so it can fill as much of the chart as you want.
Benefits of the Auto Fibonacci Retracement Indicator
- Automatically identifies extreme points and calculates retracement levels.
- It saves time and effort, especially if you switch between multiple time frames.
Combining Fibonacci Retracements with Other Technical Indicators
For a more comprehensive analysis, traders often use the Fibonacci retracement tool alongside other technical indicators, such as:
- Moving Averages (SMA, EMA) – if a price drops to a Fibonacci support level, and there is also a moving average line, it can help confirm a bullish trade.
- Relative Strength Index (RSI) – if the price is approaching a Fibonacci retracement resistance level, you can get more confirmation to short if the RSI is also over 70.
- Moving Average Convergence Divergence (MACD) – if the price approaches a Fibonacci support level, and it rebounds and causes the MACD to show an uptrend signal, this could confirm a bullish trade.
These indicators complement the Fibonacci retracement tool, providing additional confirmation and enhancing trade setups.
Fibonacci Retracement TradingView | Bottom Line
The Fibonacci retracement tool on TradingView is an excellent way to determine support and resistance levels, view breakout price targets, and provide context for use with other indicators. You can also use the auto Fibonacci tool to automatically pick the two points for you.
The tool is completely free to use on TradingVIew. All you need to do is sign up for a free account. If you use my affiliate link, you can get a free trial of the premium features and a credit toward your subscription if you decide to upgrade.
TradingView Limited Time Offer!
Exclusive Deal: 30-Day FREE Premium Access + Bonus Credit
Don’t Miss Out – Sign up for TradingView Now!
- Advanced Charts
- Real-Time Data
- Track all Markets
Before you go
If you want to keep educating yourself about trading, you must check out these posts as well:
What is the Most Successful Options Strategy
Options Trading for Income: The Complete Guide
Mark Minervini’s Trading Strategy: 8 Key Takeaways
The Best Options Trading Books
The Best Laptops and Computers for Trading
How to Get a TradingView Free Trial
The Best TradingView Indicators
Get Your Free Trading Resources
Grab the free trading journal template plus the same tools we use to stay organized, consistent, and objective.
- Free trading journal template
- Custom indicators, watchlists, and scanners
- Access our free trading community
Enter your email below to get instant access.
No spam. Unsubscribe anytime.


