TradingView Tick Charts Explained
Tick charts are an excellent tool for day traders, and they are now available to use on TradingView. Continue reading to learn how to use tick charts on TradingView, both natively and with custom scripts.
TradingView Tick Charts – Key Takeaways
- Tick charts allow you to view candles based on a number of transactions rather than a time interval
- A 1-minute candle chart will start a new candle each minute, while a 100-tick chart will start a new candle every 100 transactions (ticks)
- Tick charts are available on TradingView’s professional plans, which start at $199 per month
- You can also check out the open-source custom tick chart indicator by LonesomeTheBlue for free
Exclusive Deal: 30-Day FREE Trial of Tick Charts + $15 Referral Credit
Test TradingView’s Native Tick Charts for Free – Limited Time Offer!
- Access to Native Tick Charts
- Customize with Free Scripts
- Real-Time Transaction Data
What Are Tick Charts?
Tick charts are a type of financial chart that differs from traditional time-based charts. Instead of plotting price movements over a fixed time interval, tick charts focus on the number of transactions (ticks) that occur in the market. This distinction provides traders with valuable insights into market activity and price fluctuations.
Tick charts also allow you to see how much volume is occurring and how quickly the market is moving. If there are tons of transactions going through, there will be many new candles forming. On the other hand, if there is low volume, new candles won’t form as often since tick charts are based on the number of transactions instead of time intervals.
Note: tick charts should not be confused with the tick index chart.
How to Use TradingView’s Native Tick Charts
To use TradingView’s built-in tick charts, you need to have a professional plan, which start at $199 per month. You should be able to get a 30-day free trial using my discounted affiliate link to test them out before upgrading.
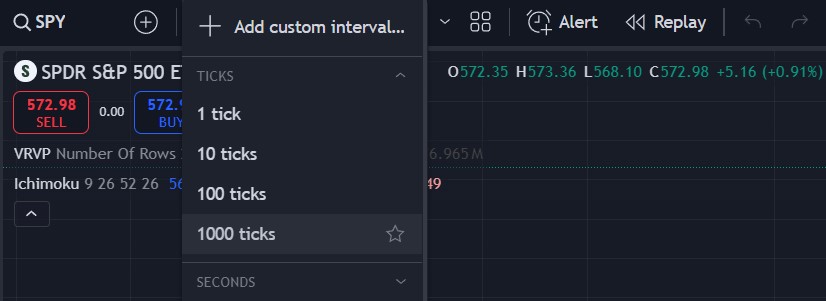
Once you have an upgraded account, follow these steps to use TradingView’s tick charts:
- Open any chart
- Click on the timeframe option at the top left
- Under “ticks,” select one of the available tick interval options
How Are Tick Charts Created?
Each candlestick on a tick chart represents the price variation based on a specified number of consecutive ticks. For example, if a trader sets the parameter to 50 ticks per candle, each candlestick on the chart is formed using 50 consecutive ticks. This precise representation allows traders to monitor price changes and transaction volume closely.
Advantages of Tick Charts
Tick charts offer several key advantages for traders:
- Enhanced precision in monitoring price changes
- Greater resolution during periods of high market activity
- Real-time visualization of transaction volume
Implementing Tick Charts on TradingView with Custom Scripts
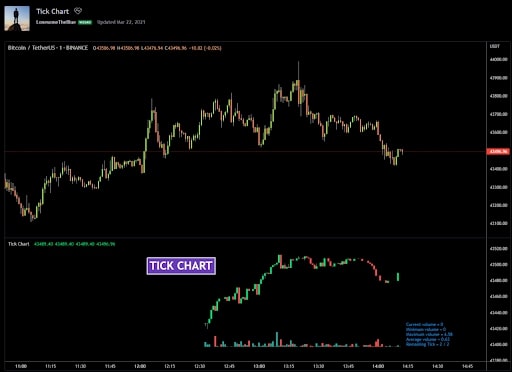
While TradingView offers native tick charts, resourceful traders have created custom scripts that achieve this functionality and have shared them for free. Notably, the “Tick Chart” script by LonesomeTheBlue generates tick charts based on real-time bars, complete with customizable options.
Customizable Options and Features
The “Tick Chart” script provides users with the ability to set the “Number of Ticks Per Candle,” allowing for flexibility in chart resolution. Additionally, users can customize chart aesthetics, such as the colors of the body, wicks, and volume bars.
The script also offers valuable features such as displaying OHLC (Open, High, Low, Close) values and current, minimum, maximum, and average volumes for each candle. It is important to note that this script only works for real-time movements and will reset if you close your chart and reopen it.
Benefits and Use Cases of Tick Charts on TradingView
Use Cases for Various Trading Strategies
Tick charts are versatile and can be used in various short-term trading strategies. From scalping to momentum trading, tick charts provide traders with detailed insights into the dynamics of price movement and liquidity.
Analyzing Market Activity and Transaction Volume
The ability to visualize transaction volume and market activity at a granular level empowers traders to make informed decisions. This level of analysis is invaluable for identifying potential trade opportunities and understanding market trends.
TradingView Tick Charts | Bottom Line
TradingView’s tick charts are a great tool for day traders and can be accessed natively with a professional plan or for free through custom scripts. They are definitely worth checking out if you scalp for day trade short-term movements.
To access the native tick charts on TradingView, you have to upgrade to a professional account. Alternatively, you can try out the community made custom scripts to see if they suit your needs for free.
Get Your Free Trading Resources
Grab the free trading journal template plus the same tools we use to stay organized, consistent, and objective.
- Free trading journal template
- Custom indicators, watchlists, and scanners
- Access our free trading community
Enter your email below to get instant access.
No spam. Unsubscribe anytime.


