Tick Index: Mastering Intraday Trading Insights
The financial markets are dynamic and ever-evolving. Amid the noise of price movements, traders and investors seek tools to gauge market sentiment and make informed decisions.
One such tool is the Tick Index. In this article, we’ll explore the Tick Index, its interpretations, and its applications in trading.
Understanding the Tick Index and Its Significance
The Tick Index measures the difference between the number of stocks experiencing an up-tick (price increase) and the number of stocks experiencing a down-tick (price decrease) on a specific exchange, such as the New York Stock Exchange (NYSE). Positive values indicate bullish sentiment, while negative values signify bearish sentiment.
The Tick Index provides a real-time snapshot of market strength or weakness, making it a go-to tool for short-term traders.
Is There a $Tick for Nasdaq?
While the $Tick Index is often associated with the NYSE, a similar indicator exists for Nasdaq under the symbol $Tickq.
Both indexes serve the same purpose, capturing market sentiment by comparing the number of rising stocks to falling stocks on their respective exchanges.
Interpreting the Tick Index: Sentiment and Reversals
- Neutral Sentiment: A Tick Index value between +200 and -300.
- Bullish Sentiment: A value above +200, with values above +500 indicating strong bullishness.
- Bearish Sentiment: A value below -300, with values below -500 indicating strong bearishness.
- Market Reversals: Extreme values (above +1000 or below -1000) may signal an impending reversal.
Enhancing Your Trading Edge with the Tick Index
The $Tick indicator allows traders to time their entries and exits for optimal trading outcomes. For instance, contrarian traders may go long when the index shows extreme negative values and short when it shows extreme positive values.
By understanding market sentiment, traders can capitalize on exhaustion zones and potential reversals.
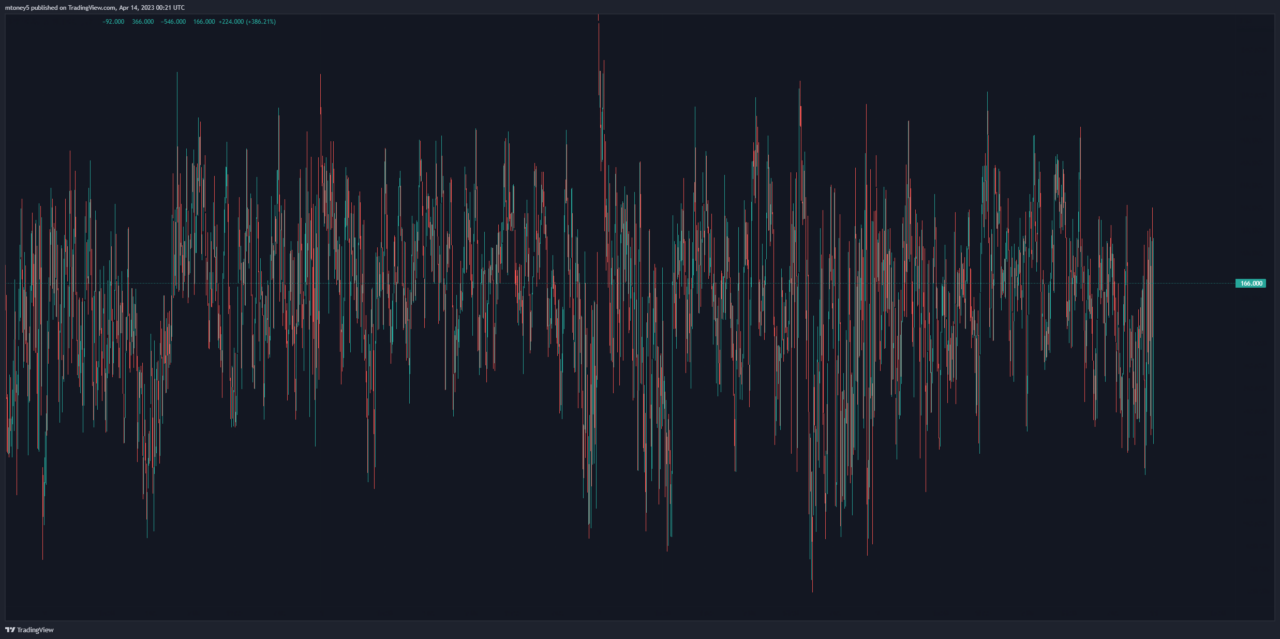
Practical Insights: Charting the Tick Index
Trading platforms like TradingView offer a seamless experience for charting the Tick Index. TradingView provides advanced charting tools, real-time data, and a community of traders for idea-sharing. New users can enjoy a discount and a free trial through this link.
Brokers and Platforms: Accessing Real-Time Data
Tick charts are available on various platforms, including TradingView, Tastytrade, and ThinkorSwim. When selecting a broker, consider factors like data accuracy, charting tools, and ease of use.
The Edge of Expertise: Advantages and Limitations
The Tick Index empowers traders to observe immediate market sentiment, providing a window of opportunity. However, it’s important to consider its limitations, including its short-term focus and potential for false signals. Traders should combine the Tick Index with other technical indicators and sound risk management.
Mastering the Tick Index
The Tick Index is a powerful ally for those who understand its intricacies. By using this indicator to assess market sentiment, traders unlock a world of opportunities for profitable decision-making.
Whether you’re a seasoned trader or new to the markets, the Tick Index offers insights that can elevate your trading journey.
Get Your Free Trading Resources
Grab the free trading journal template plus the same tools we use to stay organized, consistent, and objective.
- Free trading journal template
- Custom indicators, watchlists, and scanners
- Access our free trading community
Enter your email below to get instant access.
No spam. Unsubscribe anytime.


