How to Use Multiple Charts in TradingView
TradingView lets you view multiple charts in a single layout, which makes it significantly easier to track different timeframes, compare assets, and run a structured market analysis workflow. If you are on a paid plan, the multi-chart feature is built directly into the platform. If you are not ready to upgrade, there is also a free workaround that works well enough for most traders.
Key Takeaways
- TradingView supports 2 to 16 charts per layout depending on your subscription tier.
- Free users can replicate multi-chart setups by opening TradingView in multiple browser windows.
- You can sync charts by symbol, interval, crosshair, and date range to keep your analysis aligned across layouts.
Exclusive Deal: 30-Day FREE Premium Access + Bonus Credit
Don’t Miss Out – Sign up for TradingView Now!
- Advanced Charts
- Real-Time Data
- Track all Markets
How to Add Multiple Charts in TradingView
Setting up a multi-chart layout takes less than a minute once you know where to look.
- Open TradingView and go to a chart.
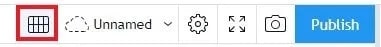
- In the top menu bar, click the Select Layout icon (grid icon).
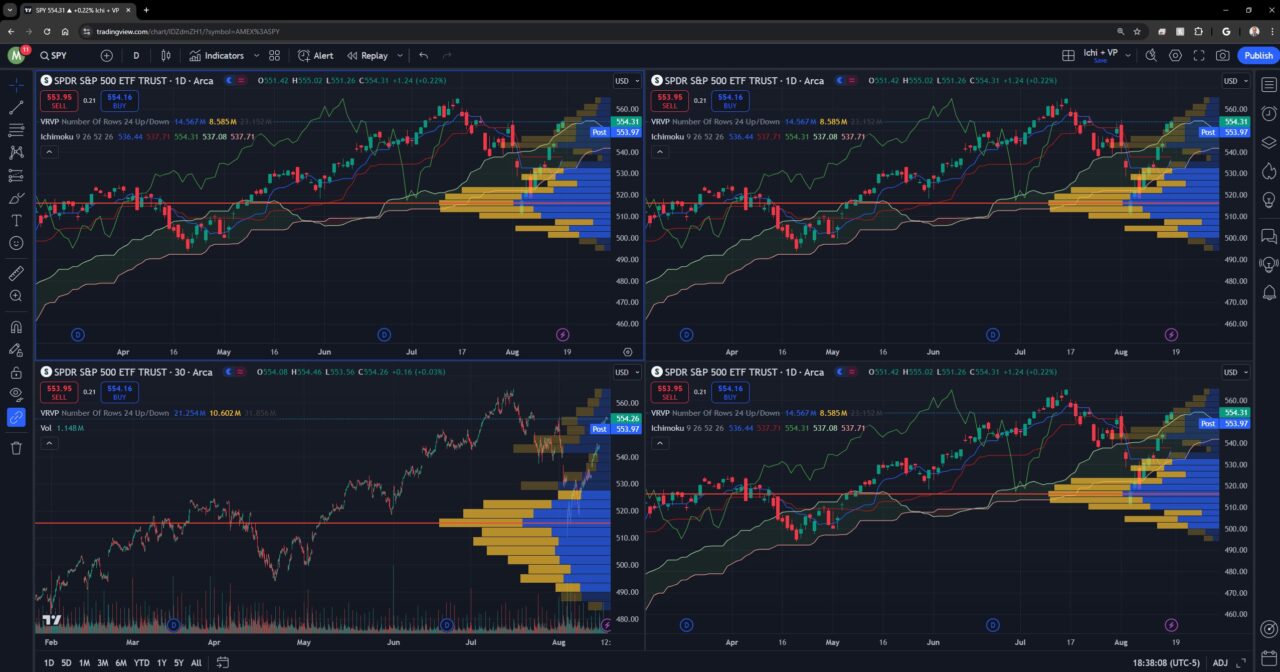
- Choose the layout that fits your screen. Options range from 2 charts side-by-side up to 8 or 16 depending on your plan.
- Click any panel in the layout, then type a ticker in the symbol search box to assign a different asset to that chart.
- Repeat for each panel until your workspace is set.
Each chart in the layout operates independently by default. You can assign different symbols, timeframes, and indicators to each panel. If you want charts to move together, use the sync feature covered below.
TradingView Multiple Charts by Plan
The number of charts you can display in a single layout depends on your subscription. Here is the current breakdown:
| Plan | Charts Per Layout | Monthly Price (Annual) |
| Free (Basic) | 1 | Free |
| Essential | 2 | ~$12.95/mo |
| Plus | 4 | ~$28.29/mo |
| Premium | 8 | ~$49.95/mo |
| Ultimate | 16 | ~$79.95/mo |
If you want to test the feature before committing to a subscription, TradingView offers a free trial on paid plans for new users. The trial gives you full access to the multi-chart layout on whichever plan you test.
How to Use Tradingview Multiple Charts for Free
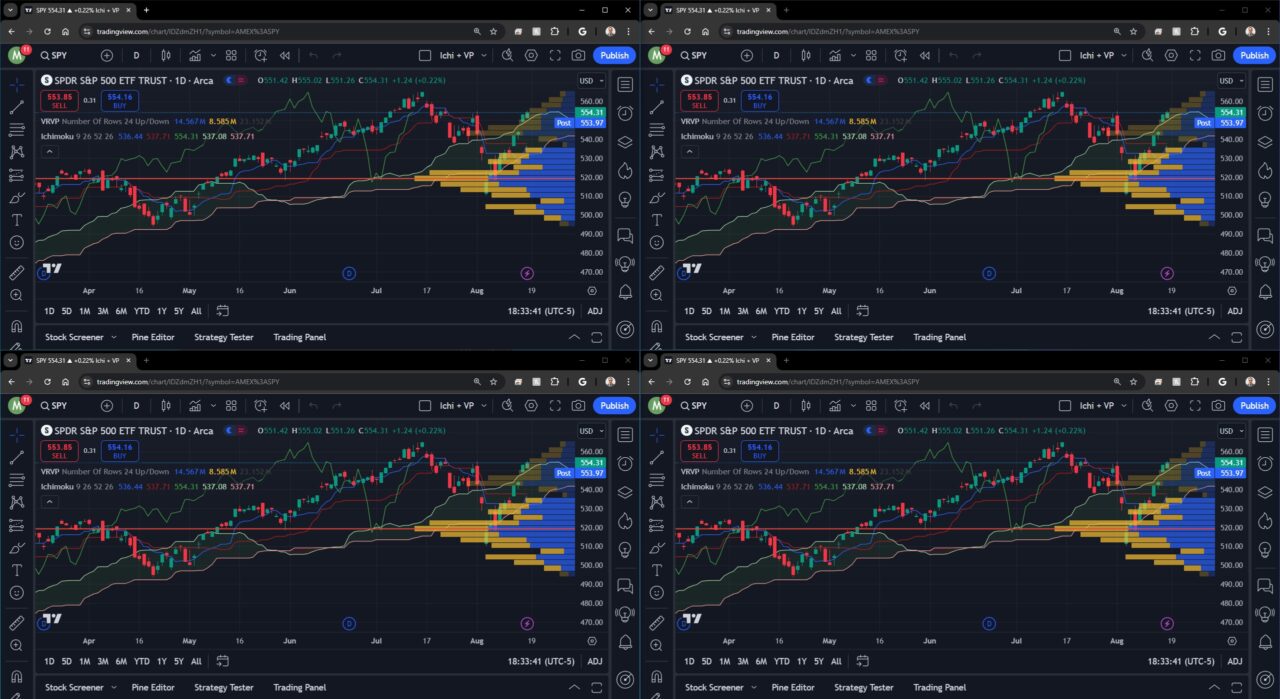
The free plan limits you to one chart per layout tab. The workaround is straightforward: open TradingView in multiple browser windows, resize each window to a smaller portion of your screen, and arrange them manually.
This approach works across all monitors. If you are running a dual or multi-monitor setup, you can dedicate different TradingView windows to different screens. The limitation compared to a paid layout is that charts cannot be synced, and managing separate windows adds friction to your workflow.
For traders who check only a handful of assets regularly, the free approach handles the job. For anyone doing systematic multi-timeframe analysis across several tickers, the paid layout structure is more efficient.

How to Sync Multiple Charts in TradingView
Syncing keeps your charts aligned across symbol, interval, crosshair, time, and date range. This is useful when you are running multi-timeframe analysis on the same asset and want all charts to move together.
To sync charts:
- Click the Select Layout icon in the top toolbar.
- Open the Layout Setup menu.
- Enable Symbol Sync, Interval Sync, or Crosshair Sync as needed.
- To create sync groups, right-click a chart and assign it an emoji marker. Charts with the same emoji sync together.
You can also apply indicators from one chart to all charts in the layout by right-clicking an indicator and selecting Apply to Entire Layout. This saves time when you want the same RSI or volume panel on every chart in your workspace. Press Tab to switch focus between charts in your layout without clicking.
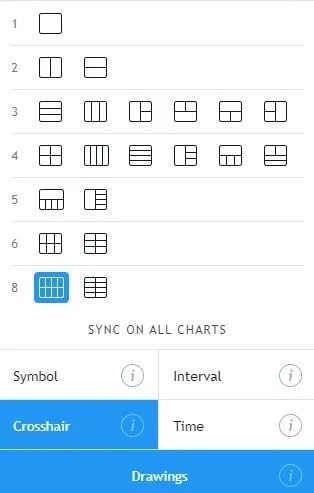
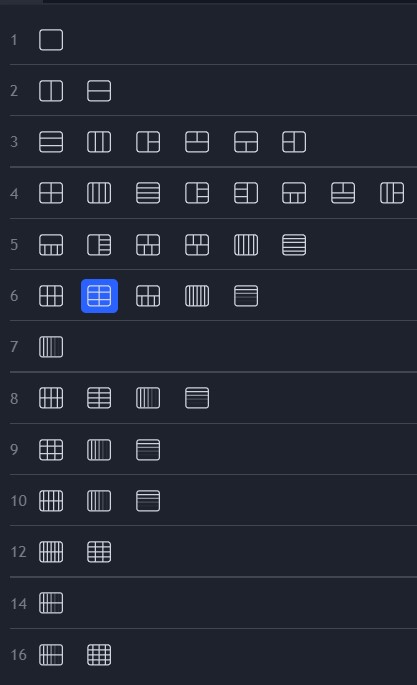
Types of TradingView Multiple Charts Layouts
Here are all the chart layouts that TradingView currently offers. Users with the Essential plan have layout 1&2 unlocked. Users with the Plus plan have additional layouts 3&4 unlocked along with the Essential plan layouts. Users with a Premium plan have all the way up to 8 charts per layout unlocked. You can also upgrade to a professional plan to get up to 16 charts in a single layout.
How to Save Multiple Chart Layouts
Saving your layout means you can restore it in one click the next session without rebuilding from scratch.
- In the top menu bar, open the Manage Chart Layouts dropdown.
- Select Save Layout or give the layout a new name using Rename.
- To reload a saved layout, open the same dropdown and click Load Layout, then select the saved name.
TradingView allows multiple saved layouts. You can build one layout for swing trading analysis, another for intraday scanning, and switch between them instantly. If you are still deciding on a plan level, the full TradingView pricing breakdown covers what each tier includes beyond just chart count.
Best Use Cases for Multi-Chart Layouts
Here are the most practical applications:
- Multi-timeframe analysis: Run the daily, 4-hour, and 15-minute chart for the same ticker on one screen. This is the most common use case for swing and position traders.
- Cross-asset correlation: Watch SPY alongside sector ETFs or individual stocks to spot divergences and relative strength shifts in real time.
- Indicator separation: Dedicate one chart to price action only, another to volume-based indicators, and another to momentum. Keeps each chart clean.
- Watchlist scanning: Assign each panel a different ticker and run through your watchlist without switching tabs.
If you are just getting started with the platform, the TradingView tutorial guide walks through the core interface before you get into layout customization.For traders tracking performance across multiple setups, it can also help to use a structured trading journal alongside your multi-chart workspace to log which setups are generating results.
TradingView Multiple Charts – Bottom Line
TradingView’s multi-chart feature is one of the most practical tools on the platform for anyone running a structured analysis workflow. The free workaround works, but the native paid layout is faster, cleaner, and gives you sync functionality that the browser window method cannot replicate. The Essential plan at approximately $12.95/month is enough to start with two charts per layout. If you run four or more regularly, Plus is the more efficient choice.New users can start with a free TradingView trial to test the full multi-chart feature set before committing to a plan.
Frequently Asked Questions
Can you use multiple charts on TradingView for free?
Yes. The free plan does not support multi-chart layouts natively, but you can open TradingView in multiple browser windows and resize them manually. You lose sync functionality, but the workaround is functional for basic use.
How many charts can you have in TradingView?
It depends on your plan. Essential supports 2 charts per layout, Plus supports 4, Premium supports 8, and Ultimate supports 16. The free plan is limited to 1 chart per layout tab.
How do you sync charts in TradingView?
Click the Select Layout icon, open Layout Setup, and enable Symbol Sync, Interval Sync, or Crosshair Sync. You can also group specific charts using emoji markers so only charts with the same emoji sync together.
How do I add a second chart on TradingView?
In the top menu bar, click the Select Layout icon and choose any multi-panel layout. Each panel operates as an independent chart. Click a panel and type a ticker symbol to assign it a different asset or timeframe.

Get Your Free Trading Resources
Grab the free trading journal template plus the same tools we use to stay organized, consistent, and objective.
- Free trading journal template
- Custom indicators, watchlists, and scanners
- Access our free trading community
Enter your email below to get instant access.
No spam. Unsubscribe anytime.


