How to Use TradingView: Beginner’s Tutorial (2026 Guide)
TradingView is the most-used charting platform for retail traders, with over 90 million users and a free tier that covers 95% of what a beginner actually needs. This tutorial walks through every core tool you will touch: charts, drawing tools, indicators, alerts, watchlists, paper trading, and the Strategy Tester. By the end, you will know the platform well enough to run your first full week without getting lost.
When you are done testing indicators, see our step-by-step guide on how to remove or hide indicators on TradingView, including how to clear them all at once and the per-plan indicator limits.
Key Takeaways
- The free TradingView plan gives you real-time charts, every drawing tool, 3 indicators per chart, and paper trading. That is enough to run a full beginner workflow without paying.
- The interface is organized into four toolbars (top, left, right, and bottom). Learn what each one does first and everything else becomes muscle memory.
- TradingView charts what happened. A separate trade journal tells you why. Pair TradingView with a journal from day one so you are not retro-building performance data six months later.
Free plan forever or upgrade to Essential, Plus, Premium, or Expert. 30-day trial unlocks every paid feature so you can test before you decide.
Claim Your $15 CreditTurn the trades you take on TradingView into real performance data. Equity curve, benchmark comparison, and AI insights built for active traders.
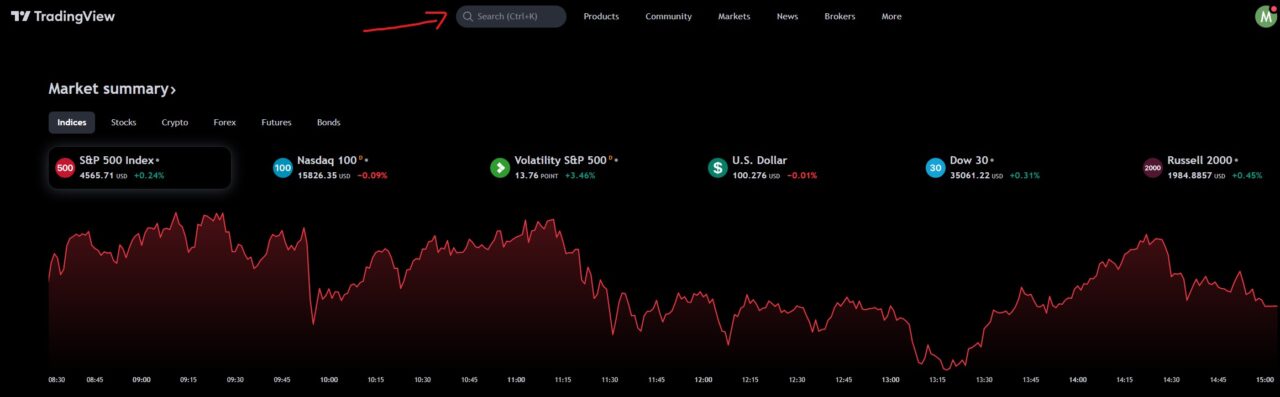
Try It FreeWhat Is TradingView (and Why Beginners Use It)
TradingView is a web-based charting and social trading platform used by over 90 million traders. It runs entirely in the browser (no install required), supports stocks, crypto, forex, futures, indices, and bonds across hundreds of exchanges, and offers paper trading, saved chart layouts, price alerts, and a massive community of public scripts and ideas.
For beginners, the appeal is simple: the free plan is usable on day one and you never outgrow the interface as you level up. Pro traders use the same charts. The platform also includes a Pine Script language for custom indicators, a Strategy Tester for backtesting, broker integrations for live order routing, and a news and economic-calendar feed built into the main view. For a deeper look at features and quirks, see our full TradingView review and a breakdown of how TradingView’s pricing breaks down. If you are choosing between charting platforms, see the full TradingView vs. Investing.com breakdown.
Create Your Free Account and Open Your First Chart
The first step is to create a free account at tradingview.com. Sign up with email, Google, Apple, or Facebook. You can upgrade to a paid plan later for more indicators per chart, more saved layouts, multi-monitor support, and intraday data on lower timeframes. Once you are in, the fastest way to start is to type a symbol into the search bar at the top of the homepage. Type a ticker like AAPL, BTCUSD, or EURUSD and click the result to open the chart.
The chart opens in the main workspace, where you can change the chart type, timeframe, layout, and colors. Everything you customize (indicators, drawings, colors, timeframe) can be saved as a template so the next symbol you open inherits the same setup automatically.
The TradingView Workspace, Explained
The TradingView interface is organized into four toolbars plus a main chart area in the middle. The chart area is where price action lives; the toolbars are how you interact with it. Beginners who feel overwhelmed on the first open are almost always just missing the mental model of which toolbar does what. Learn the map once and the rest of the platform becomes intuitive.
Top toolbar
Symbol search, timeframe selector, chart type, comparison tickers, indicators button, templates, alerts bell, replay mode, undo/redo, layouts, and the publish-idea button. This is where you spend 70% of your session.
Left toolbar
Every drawing tool. Trendlines, horizontal lines, channels, Fibonacci tools, shapes, text annotations, measurements, prediction tools, and icons. Right-click any tool to lock or save it as a default.
Right toolbar
Watchlist, alerts panel, hot list, calendar, data window, ideas stream, and chat. The watchlist is the one panel you will keep open at all times.
Bottom toolbar
Pine Editor, Strategy Tester, Trading Panel (where Paper Trading lives), Screener, News, and Text Notes. Most beginners never click down here for weeks, but this is where three of the most useful features on the platform hide.
Chart Types in TradingView
TradingView offers a dozen chart styles. The five you actually need to know:
- Candlestick: the default for most traders. Each bar shows open, high, low, and close. Set candlesticks as your default if they are not already.
- Bar (OHLC): same data as candlesticks, thinner visuals, preferred by some futures traders.
- Line: closing price only. Useful for long-term trend reading, not for entries.
- Heikin Ashi: smoothed candles that filter noise. Good for swing-trade trend reading, misleading for exact entries because it does not plot the real close.
- Renko and Range: time-independent bars that only print when price moves a set amount. Used for trend-following setups where you want to ignore consolidation.
How to Read and Customize Your TradingView Chart
Click the timeframe on the top toolbar to switch between 1-minute, 5-minute, hourly, daily, weekly, or any custom interval. Right-click the price scale on the right edge of the chart to toggle between regular price, logarithmic price, and percentage. Right-click anywhere on the chart background to open Chart Settings, which is where you change grid lines, background color, crosshair style, and session coloring. If the default light theme strains your eyes, switch to dark mode in one click.
Under the gear menu in the bottom-right of the chart, you can invert the price scale to view the chart upside down, which is a common bias-checking technique.
Chart Layouts and Templates
A layout saves the symbol, timeframe, drawings, indicators, and visual settings on a chart. A template saves the indicator and styling combination only, so you can apply the same setup to any new ticker. Both live on the top toolbar.
Free plans get one saved layout and unlimited templates. Essential and higher unlock five to ten layouts, multiple charts per tab, and sync across devices. A beginner workflow: build one default template with your core indicators, then use it on every new symbol you open. You will save 10 to 15 minutes per session inside a week. Once your workspace is configured, learn how to save your charts so the setup persists across sessions. You can also delete or reset a layout if you want to start fresh.
Drawing Tools on TradingView
The left toolbar is the drawing toolkit. Click a tool, then click on the chart to place it. The tools you will use most often: trendlines, horizontal ray (for support and resistance), Fibonacci retracement, parallel channel, and rectangles for marking zones.
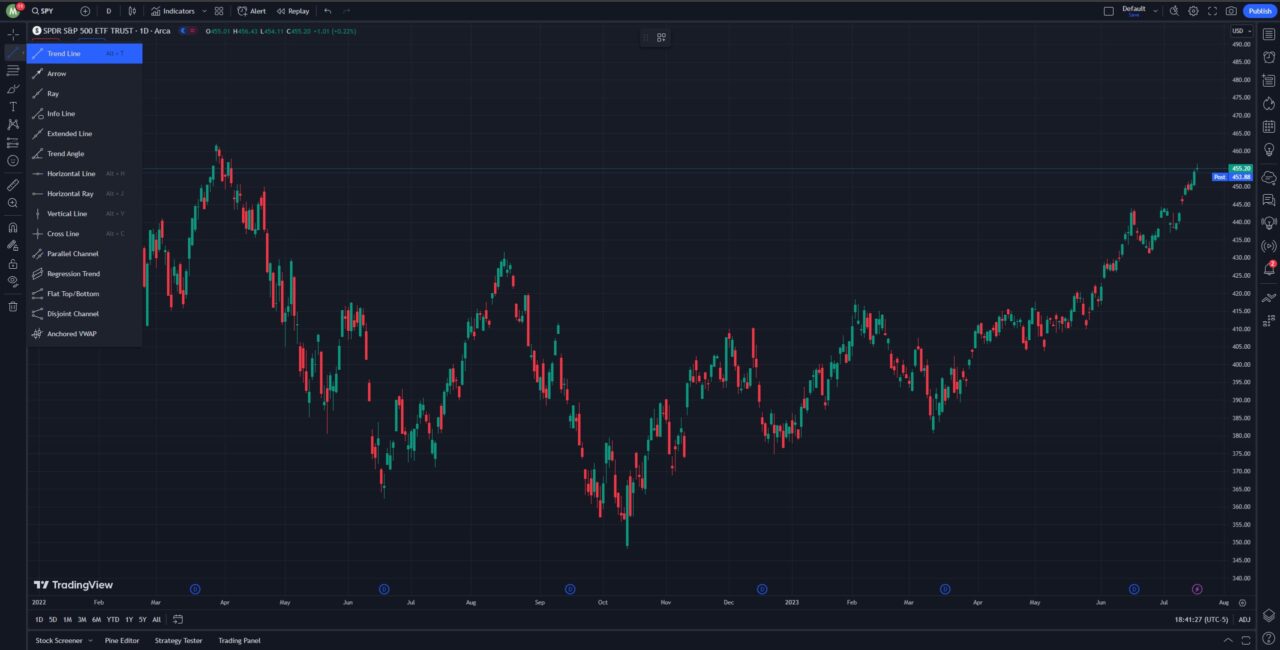
Right-click any placed drawing to edit color, line width, extend direction, or save it as the default for that tool (so every future trendline uses your preferred style automatically). Deeper walkthroughs: how to draw on TradingView, Fibonacci retracements, and the rectangle tool for marking supply and demand zones.
Rectangles are especially useful for marking institutional price zones like fair value gaps, where the gap between the first and third candle’s wicks creates a clear zone boundary you can shade directly on the chart.
How to Use Indicators on TradingView
Indicators are formulas that plot on (or below) your chart to highlight trend, momentum, volume, or volatility. Click the Indicators button on the top toolbar to open the indicator browser. You can search built-in indicators (Moving Average, RSI, MACD, Bollinger Bands, VWAP), browse community scripts published by other traders, and pin favorites for one-click access.
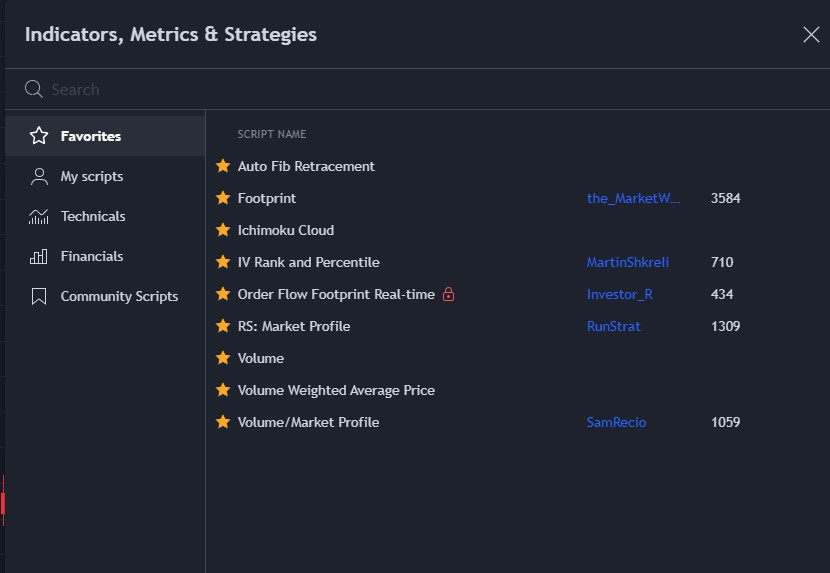
After an indicator is added, click its name on the chart to adjust the period, source, or style. The free plan allows 3 indicators per chart, which is usually enough. Recommended starters: the 50 and 200 period moving averages, add the RSI indicator for momentum, and VWAP for intraday traders. Full rundown of the best ones to start with: best TradingView indicators.
Build Your First Watchlist
The watchlist lives in the right toolbar. Click the plus icon at the top of the panel to add symbols. You can group watchlists by theme (mega-cap tech, high-IV names, sector ETFs, crypto majors), reorder symbols by drag, color-code rows, and sort by change percentage or volume. Watchlists sync across every device signed into your account, so the list you build on desktop shows up on the mobile app immediately.
Setting Up Alerts on TradingView
Alerts are the feature that replaces staring at charts. Click the alarm clock icon on the top toolbar (or press Alt+A) to open the alert dialog. You can set an alert on a specific price level, on a trendline or drawing you have placed, on an indicator condition (e.g., RSI crosses 70), or on a Pine Script strategy signal.
Alerts deliver via in-app popup, email, SMS (paid plans), and webhook (Pro tier and above, which is how automated execution setups are wired through services like SignalStack). The free plan caps active alerts at 1; paid tiers expand to 20, 100, or 400 depending on plan. A practical workflow: set alerts on the exact price levels where your trade thesis is invalidated or triggered, then close the tab. You stop overtrading because you are not watching charts; the alert pulls you back when action is actually required. For the full breakdown, see our full walkthrough of TradingView alerts.
Paper Trading on TradingView: Practice Before You Risk Money
Paper Trading is built into TradingView and works like a real account without real money. Open the Trading Panel on the bottom toolbar, select Paper Trading from the broker dropdown, and you get a simulated $100,000 account with real-time fills against live prices. Place market, limit, stop, and OCO orders directly from the chart. Reset the balance whenever you want a clean slate.
This is the single highest-leverage feature on the platform for beginners. A month of paper trading answers three questions no amount of chart staring will: can you actually hit your planned entry price, do you cut losers when your rule says to, and does your strategy survive real-time emotion even without real money on the line. Every paper trade should have a pre-set stop, target, and size. Log each one. When you switch to live, the only new variable should be your account balance, not your process. Full walkthrough with screenshots: TradingView paper trading tutorial.
Recommended Tool
Financial Tech Wiz Trading Journal
Once you start logging trades, paper or live, the Financial Tech Wiz Trading Journal turns them into performance data automatically. Equity curve, win rate by day of week, benchmark comparison, and AI insights. Starting at $9.91/month billed annually.
Try It FreeHow to Use the TradingView Stock Screener
The Stock Screener lives at the bottom of the chart window (Screener tab in the bottom toolbar) or under Products on the homepage. Filter by price, volume, market cap, dividend yield, P/E ratio, EPS growth, sector, and country, then layer in technical filters like moving average cross, RSI level, breakout from N-day high, or a specific candlestick pattern. Save any filter combination as a preset so you can re-run the same scan every morning. The Products menu also hosts the TradingView heatmap, a sector-level view that shows which markets are moving before you filter individual tickers.
For a complete filter-recipe breakdown by trading style and a step-by-step workflow, see the dedicated TradingView stock screener guide.
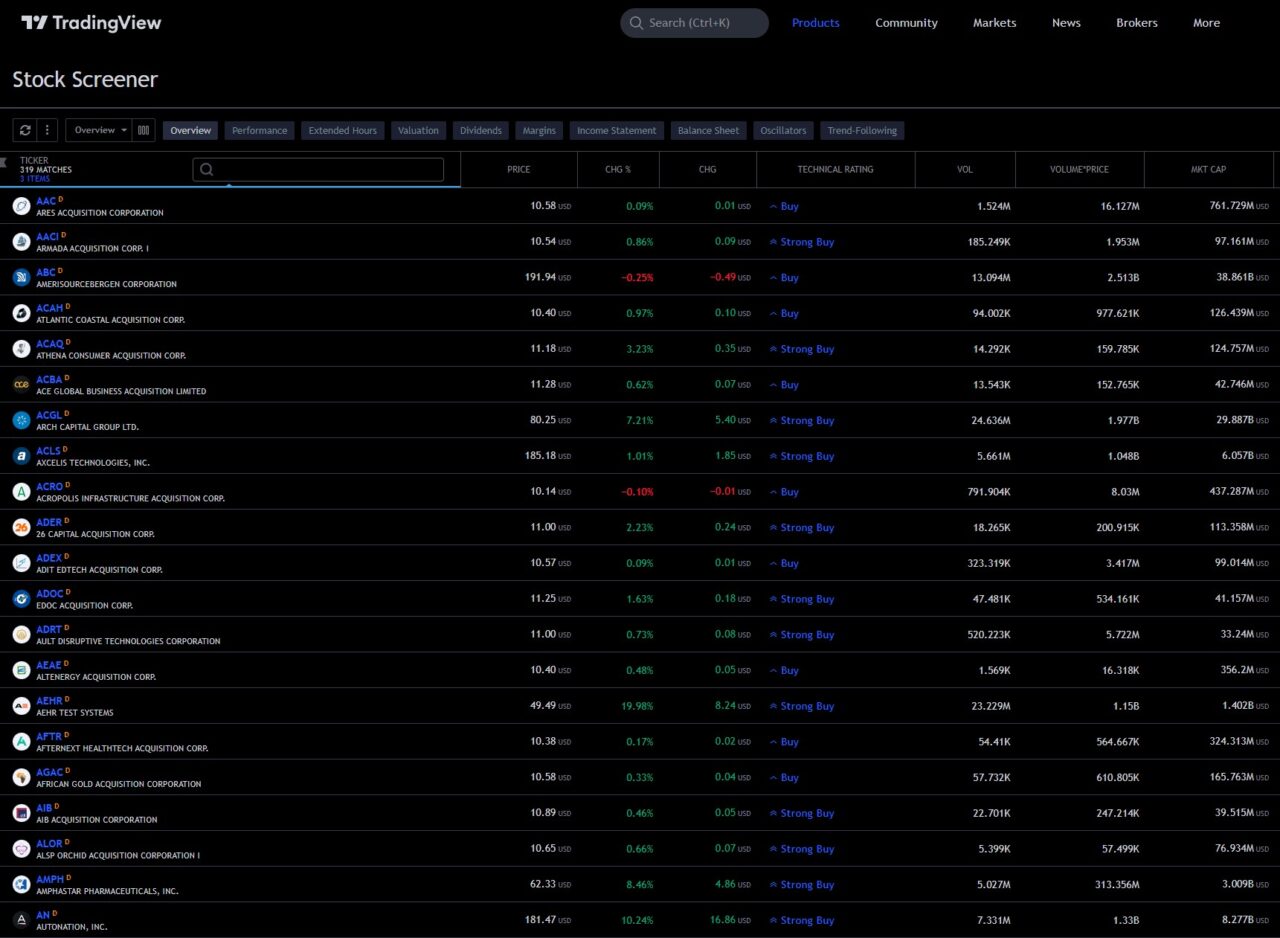
Full walkthrough and example screens: the TradingView stock screener.
Can You Actually Trade Live on TradingView?
Yes. TradingView connects to over 30 supported brokers, including tastytrade, TradeStation, Tradovate, Interactive Brokers, OANDA, and several crypto exchanges. You still need a separate broker account; TradingView is not a broker itself. Once connected, you place orders directly from the chart using the Trading Panel, with market, limit, stop, stop-limit, and bracket order types.
Three practical notes before you connect live money. First, connection is one-click OAuth for most brokers, and order routing happens through your broker, not TradingView, so fills and margin behavior match your account directly. Second, not every order type supported by your broker is exposed on the chart panel; for complex multi-leg options orders in particular, you may still want to use your broker platform. Third, chart-side execution requires a TradingView paid plan for some brokers. For a deeper comparison of the supported brokers and which one fits each trading style, see our post on the best broker for TradingView.
How to Use TradingView for Day Trading
Day traders rely on lower timeframes (1-minute, 3-minute, 5-minute) and real-time data. A few setup choices matter more than anything else:
- Set your TradingView time zone to match the session you are trading. A misaligned chart pushes session opens and key release candles to the wrong bar and breaks your pattern reading.
- Use multi-chart layouts so you can watch a 1-minute execution chart alongside a 5-minute and daily context chart at the same time.
- Learn the keyboard shortcuts that save real time, especially Alt+H for a horizontal line and Alt+T for a trendline.
- Common day-trader indicators: 9 and 26 EMA cross, VWAP for the intraday mean, and volume profile for session-level support and resistance.
How to Use TradingView for Cryptocurrency
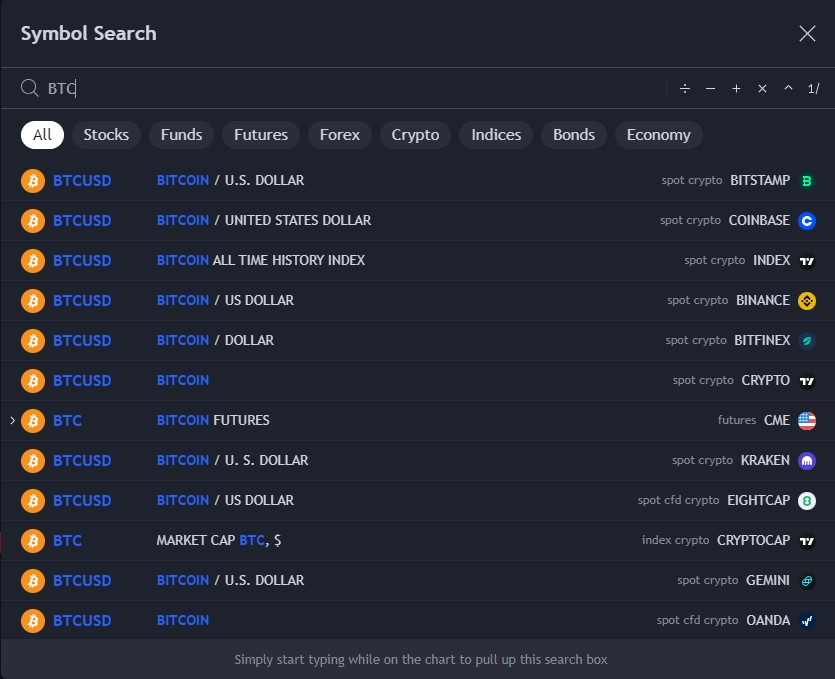
TradingView supports crypto charts across hundreds of exchanges. When you search a ticker like BTCUSD, you will see multiple exchange options (Coinbase, Binance, Bitstamp, Kraken, and more). Pick the exchange that matches your trading venue because volume, liquidity, and exact prices differ. You can also chart the cross pairs: BTCJPY, ETHBTC, SOLUSDT, or Bitcoin dominance (BTC.D) to gauge altcoin rotation.
Every other feature (indicators, drawings, alerts, paper trading) works the same on crypto as on stocks.
The TradingView Community and Ideas Feed
TradingView is as much a social platform as a charting tool. Every chart has a Publish button on the top toolbar that posts your annotated setup to the Ideas feed, where other users can like, comment, and follow. For beginners, the Ideas feed is a free education stream: search a ticker and read how other traders are reading the same chart, which often reveals setups and levels you missed. Once you have a setup worth sending, here is how to share a TradingView chart with anyone.
Two warnings. First, most published ideas are wrong. Treat them as prompts for your own analysis, not signals to trade on. Second, the best authors are usually not the loudest ones; use the follower count and the idea win-rate stats (visible on each author profile) as a filter.
Strategy Tester and Pine Script Basics
The Strategy Tester backtests a trading strategy against historical data. It lives on the bottom toolbar and runs on any strategy script written in Pine Script (TradingView’s native language). Attach a strategy to a chart and the Strategy Tester shows net profit, max drawdown, profit factor, win rate, and a trade-by-trade list. Pine Script is simpler than Python or JavaScript and designed specifically for charting logic. You can open the Pine Editor from the bottom toolbar, copy a published script, modify it, and run it on any symbol. Full breakdowns: Strategy Tester in TradingView and an introduction to Pine Script.
Developers occasionally ask whether TradingView exposes its data via API; the TradingView API guide covers what’s available and what isn’t.
Advanced: Order Flow and Footprint Charts
Once you are past the beginner stage, TradingView supports several order-flow tools: Volume Profile, Fixed Range Volume Profile, and Footprint Charts. These show the actual volume traded at each price level, not just the bar close. They help you see where the real transactional activity happened and where the market is accepting or rejecting price. Most order-flow tools require a paid plan. Start with the beginner-friendly write-ups before you dive in:
Common TradingView Mistakes Beginners Make
- Adding too many indicators. The free plan caps you at 3 per chart for a reason. Two is usually enough; four is almost always noise.
- Wrong time zone. The default time zone is Etc/UTC. If you are trading US sessions, set the chart to New York time so the open, close, and economic-release candles land on the correct bar. See our TradingView timezone guide.
- Not saving layouts. If you rebuild the same chart from scratch every day, you are losing 15 minutes of prep time daily. Save once, load every session.
- Skipping Paper Trading. New traders take live risk before they know where the buttons are. Paper trade for a month first.
- Ignoring Replay mode. The bar-replay feature on the top toolbar lets you rewind the chart to any date and step forward bar by bar, which is the single best way to train pattern recognition.
Your First Month on TradingView: A Realistic Plan
You do not need to master everything in week one. Most beginners burn out by trying to use every feature at once. The schedule below is what I would run if I were starting today. It keeps the cognitive load low and builds the habits that compound.
- Week 1: Create the account, pick your default chart type and time zone, save one layout, and spend 30 minutes a day just navigating the four toolbars until they feel familiar.
- Week 2: Build two watchlists (one for the names you actually want to trade, one for broader context tickers like SPY, QQQ, and VIX). Enable Paper Trading and take 10 to 15 paper trades with real entries and exits.
- Week 3: Add your first two indicators and your first drawing-tool defaults. Start using Replay mode to walk forward on historical setups.
- Week 4: Set alerts on the levels you actually care about so you stop babysitting charts. Start tracking every trade in the Financial Tech Wiz Trading Journal (paper trades count) so you can see where your performance is actually coming from by week 8.
Get Your Free Trading Resources
Grab the free trading journal template plus the same tools we use to stay organized, consistent, and objective.
- Free trading journal template
- Custom indicators, watchlists, and scanners
- Access our free trading community
Enter your email below to get instant access.
No spam. Unsubscribe anytime.
Frequently Asked Questions
Is TradingView free?
Yes. TradingView offers a free plan forever with no credit card required. The free plan includes real-time charts for most symbols, every drawing tool, 3 indicators per chart, one saved layout, and paper trading. Paid plans unlock more indicators per chart, more saved layouts, multi-monitor support, intraday data on lower timeframes, and alerts that never expire.
Is TradingView good for beginners?
Yes. TradingView’s interface is the most approachable of any charting platform: the learning curve for basic charting is about 30 minutes, the free plan is usable on day one, and the community publishes thousands of free beginner-friendly scripts you can click to add.
Can you trade directly on TradingView?
Yes, through a connected broker. TradingView supports over 30 brokers including tastytrade, TradeStation, Tradovate, Interactive Brokers, and OANDA. You still need a separate broker account; TradingView is not itself a broker.
Is TradingView a broker?
No. TradingView is a charting and analysis platform. It routes orders to connected third-party brokers; it does not hold customer funds, execute trades on its own books, or provide brokerage services.
How much does TradingView cost?
The free plan is $0 forever. Paid tiers run roughly $15 to $60 per month depending on plan and billing frequency. The full breakdown (including current promos and which plan fits which trading style) is in our post on how much TradingView costs.
Can you paper trade on TradingView?
Yes. Paper Trading is built in and free. Open the Trading Panel on the bottom toolbar, choose Paper Trading from the broker dropdown, and you get a simulated $100,000 account that takes real-time fills against live market prices.
Does TradingView work on mobile?
Yes. TradingView offers free iOS and Android apps with full charting, indicators, alerts, watchlists, and account sync. The mobile apps are not a drop-in replacement for desktop (drawings are harder on a small screen) but are excellent for checking alerts and watchlists on the go.
Can you use TradingView on a desktop app?
Yes. TradingView offers a dedicated desktop app for Windows and macOS that runs the same interface as the web version, with support for multi-monitor layouts and more responsive chart rendering on large screens.
What is Pine Script?
Pine Script is TradingView’s built-in programming language for creating custom indicators and strategies. It is simpler than Python or JavaScript and designed specifically for charting logic. You can open the Pine Editor from the bottom toolbar, write or edit a script, and plot it on any chart immediately.
Get Your Free Trading Resources
Grab the free trading journal template plus the same tools we use to stay organized, consistent, and objective.
- Free trading journal template
- Custom indicators, watchlists, and scanners
- Access our free trading community
Enter your email below to get instant access.
No spam. Unsubscribe anytime.


