StockAnalysis Review
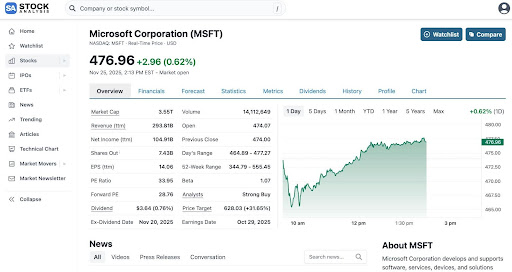
If you actively follow the stock market, having fast access to clean, reliable financial data is essential. Many investors still rely on cluttered platforms, outdated tools, or spreadsheets that slow down the research process and make simple analysis harder than it should be. StockAnalysis.com is a modern stock research platform designed to solve that problem….