Webull Trading Journal: Connect Your Account and Analyze Every Trade
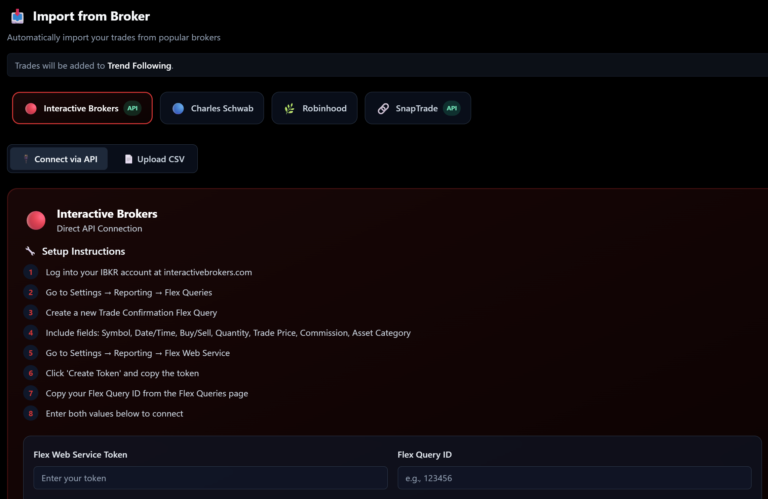
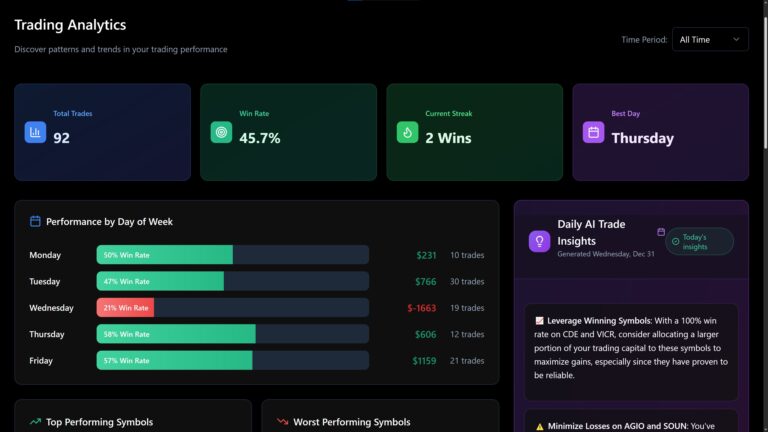
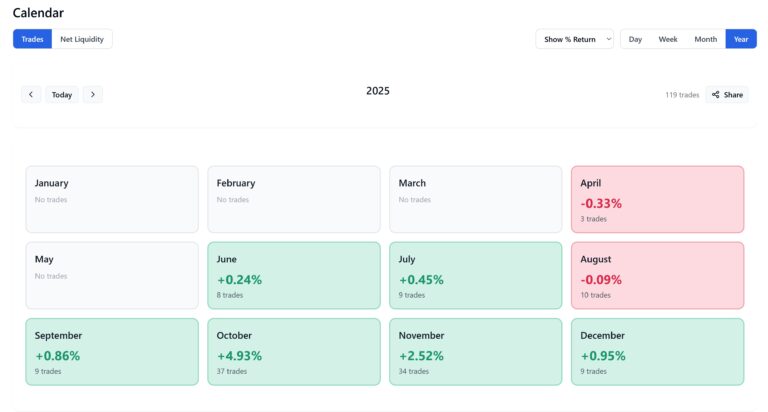
The Financial Tech Wiz Trading Journal connects directly to Webull via SnapTrade, pulling your stocks, options, and crypto trades automatically. Webull is built for active traders who want commission-free execution with advanced charting. The journal gives that execution data a full analytical layer so you can see what is actually working in your Webull account….