Doji Candle Types: Dragonfly, Gravestone & More
The Doji candlestick pattern is an essential technical analysis tool traders and investors often use to understand market sentiment. This article explores the meanings, types, and trading implications of the Doji pattern.
Understanding the Doji Candlestick Pattern
The Doji candlestick pattern is characterized by its distinct “cross” shape, where the opening and closing prices of an asset are either equal or very close to each other. The Doji symbol represents a state of indecision and balance between buyers and sellers in the market.
Types of Doji Candles and Their Interpretations
- Neutral Doji: The Neutral Doji features an almost invisible body located in the middle of the candlestick, reflecting a state of balance between bullish and bearish sentiments.
- Long-Legged Doji: The upper and lower shadows of the Long-Legged Doji Candle are significantly longer than the body.
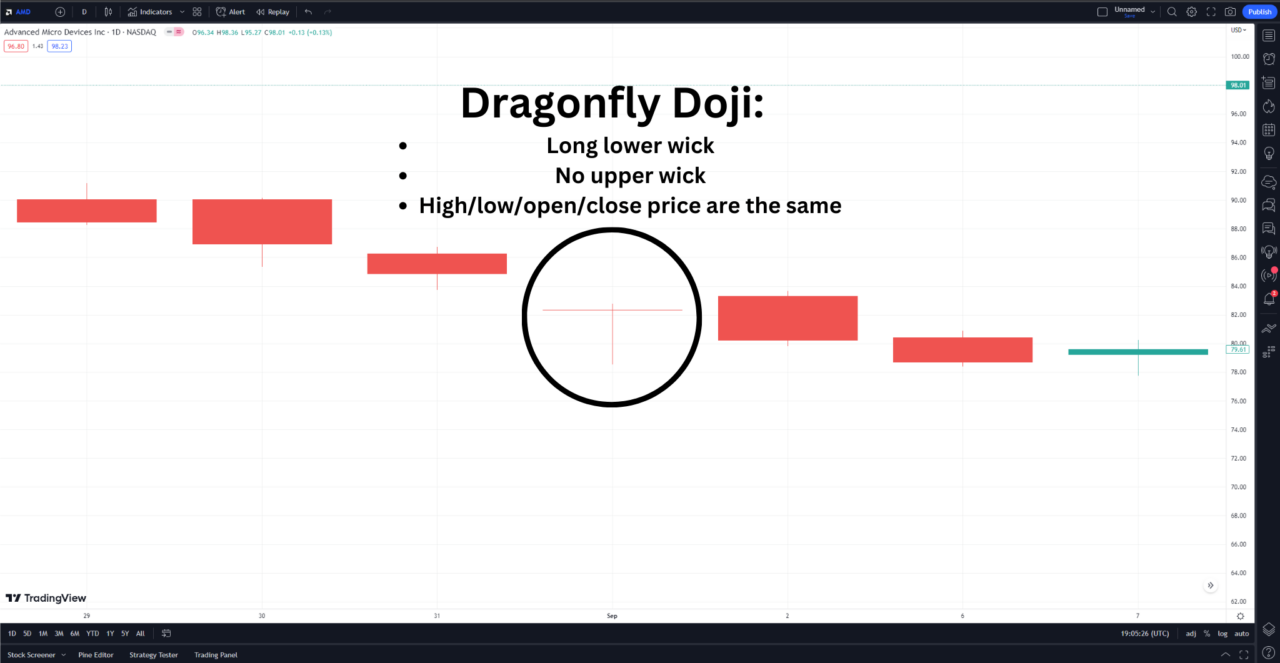
- Dragonfly Doji: The Dragonfly Doji is a T-shaped candle with a long lower wick, signifying a potential bullish reversal if it forms at the end of a downtrend.
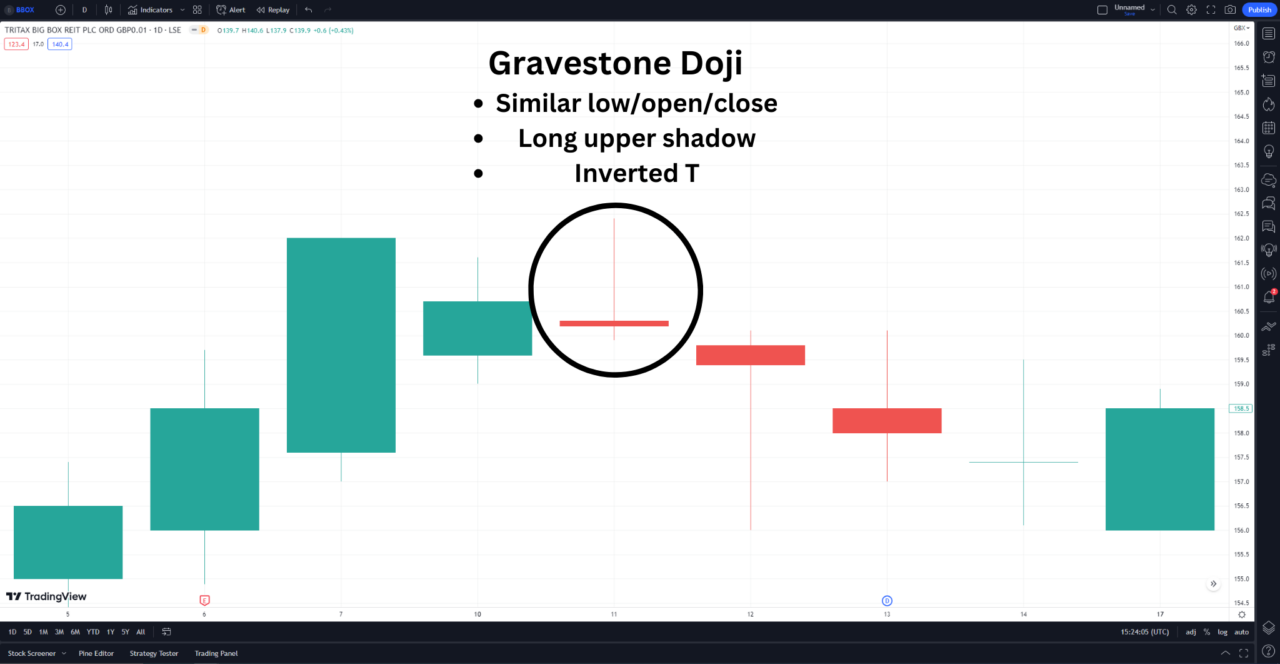
- Gravestone Doji: The Gravestone Doji is an inverted T-shaped candle, indicating a potential bearish reversal if it appears in an uptrend.
When two of these doji variants appear back-to-back at the end of a trend, the setup is called the double doji pattern, a stronger reversal signal than any single doji because the dominant side has failed to reassert control across two consecutive candles.
Is a Doji candle bullish or bearish?
The answer depends on the context in which it appears, as the Doji pattern can be both bullish and bearish depending on its type and market conditions.
Color Variations of the Doji Pattern
The color of a Doji candlestick—red or green—can provide additional information about the price action. A red Doji suggests that the closing price is lower than the opening price, while a green Doji indicates the opposite.
Does it matter if a Doji is red or green?
The color of the Doji is less important than the broader trend and the context in which it appears.
Trading with the Doji Candlestick Pattern
Here are some key considerations for trading with the Doji pattern:
- Use the Doji pattern in conjunction with other technical indicators to confirm potential market trends.
- Look for confirmation from subsequent candles to validate trade decisions.
- Implement risk management measures, such as stop-loss orders, to protect your trade.
Limitations and Practical Considerations
The Doji pattern is a neutral indicator and does not provide strong buy or sell signals on its own. Traders should consider the overall market context and broader trends when interpreting Doji patterns. As with any trading tool, it’s essential to practice and experiment to enhance trading decisions.
Analyzing Doji Candles with TradingView
For traders looking to enhance their technical analysis skills, TradingView is an exceptional platform that provides a comprehensive set of charting tools and indicators, including the ability to analyze Doji candlestick patterns. TradingView’s user-friendly interface and interactive charts make it an excellent choice for both beginners and experienced traders.
TradingView usually offers a 30-day free trial for their premium subscriptions. This trial gives you access to advanced features, including real-time data, custom alerts, and priority customer support. Additionally, by using my link, you can receive $30 off your subscription after the free trial ends.

Doji Candles | Bottom Line
The Doji candlestick pattern is a valuable tool for understanding market sentiment and potential trend reversals. Whether it’s the Neutral Doji, Dragonfly Doji, or Gravestone Doji, each pattern provides unique insights into the balance of power between buyers and sellers.
FAQ
What are the different types of doji candles?
There are five main types of doji candles:
- Neutral Doji: This is the most common type of doji candle, where the open and close prices are almost the same, indicating a balance between buyers and sellers. This pattern does not signal a clear trend direction by itself but rather a potential pause or reversal in the market.
- Long-Legged Doji: This type of doji candle has long upper and lower shadows, indicating a large price range during the session but a close near the open. This shows that there was a lot of volatility and indecision in the market, but no clear winner emerged.
- Dragonfly Doji: This type of doji candle has a long lower shadow and no upper shadow, indicating that the price opened near the high, dropped significantly, but then recovered to close near the open. This shows that the sellers were initially dominant, but the buyers managed to push the price back up, creating a bullish signal.
- Gravestone Doji: This type of doji candle has a long upper shadow and no lower shadow, indicating that the price opened near the low, rose sharply, but then fell back to close near the open. This shows that the buyers were initially dominant, but the sellers managed to push the price back down, creating a bearish signal.
- Four-Price Doji: This is a rare type of doji candle, where the open, high, low, and close prices are all equal, indicating a complete stalemate between buyers and sellers. This shows that there was no price movement at all during the session, suggesting a very low liquidity or interest in the market.
Is doji bullish or bearish?
A doji candle by itself is neither bullish nor bearish, as it indicates a state of equilibrium or indecision in the market. However, depending on the context and the preceding trend, a doji candle can signal a possible trend reversal or continuation.
For example, a doji candle after an uptrend can indicate that the buyers are losing momentum and the sellers are gaining strength, creating a bearish reversal signal. Conversely, a doji candle after a downtrend can indicate that the sellers are losing momentum and the buyers are gaining strength, creating a bullish reversal signal. A doji candle within a consolidation or sideways movement can indicate that the market is waiting for a catalyst or confirmation before choosing a direction.
What are the three types of doji candles?
The three most common types of doji candles are:
- Neutral Doji: The open and close prices are almost the same, indicating a balance between buyers and sellers.
- Long-Legged Doji: The upper and lower shadows are long, indicating a large price range during the session, but a close near the open, indicating indecision in the market.
- Dragonfly Doji: The lower shadow is long and there is no upper shadow, indicating that the price opened near the high, dropped significantly, but then recovered to close near the open, indicating bullish pressure.
What are the different types of bullish doji?
The different types of bullish doji are:
- Dragonfly Doji: The lower shadow is long and there is no upper shadow, indicating that the price opened near the high, dropped significantly, but then recovered to close near the open. This shows that the sellers were initially dominant, but the buyers managed to push the price back up. This is a bullish signal when it occurs after a downtrend or at a support level.
- Doji Star: This is a two-candle pattern where the first candle is bearish and has a large body, and the second candle is a doji that gaps below the first candle’s body. This shows that there was a strong selling pressure in the first session, but then a pause or reversal in the second session. This is a bullish signal when it occurs after a downtrend or at a support level.
- Morning Doji Star: This is a three-candle pattern where the first candle is bearish and has a large body, the second candle is a doji that gaps below the first candle’s body, and the third candle is bullish and has a large body that closes above or within the first candle’s body. This shows that there was a strong selling pressure in the first session, but then a reversal and a strong buying pressure in the third session. This is a bullish signal when it occurs after a downtrend or at a support level.
What is the difference between green doji and red doji?
Both types of doji show a very small or no net change in the price, but the color can indicate which side had a slight edge in the market.
A green doji is when the open price is lower than the close price, indicating that the price increased slightly during the session. A red doji is when the open price is higher than the close price, indicating that the price decreased slightly during the session.
What is a doji vs. hammer?
A doji is a candlestick pattern where the open and close prices are almost the same, indicating a balance or indecision in the market.
A hammer is a candlestick pattern where the open and close prices are near the high of the session, and there is a long lower shadow, indicating that the price opened near the high, dropped significantly, but then recovered to close near the high.
This shows that the sellers were initially dominant, but the buyers managed to push the price back up, creating a bullish signal.
What is hammer vs. dragonfly doji?
A hammer and a dragonfly doji are both bullish candlestick patterns that indicate a possible reversal in a downtrend. However, there are some differences between them:
- A hammer has a small body near the high of the session, while a dragonfly doji has no body at all, meaning that the open and close prices are equal.
- A hammer can have a small upper shadow, while a dragonfly doji has no upper shadow at all, meaning that the high and close prices are equal.
- A hammer can have any color, while a dragonfly doji is usually green, indicating that the close price is higher than the open price.
These differences suggest that a dragonfly doji is a stronger bullish signal than a hammer, as it shows more bullish pressure and less bearish resistance in the market.
What is the difference between a doji and a spinning top?
A doji and a spinning top are both candlestick patterns that indicate a state of equilibrium or indecision in the market. However, there are some differences between them:
- A doji has almost no body at all, meaning that the open and close prices are almost equal, while a spinning top has a small body in the middle of the session, meaning that there was some net change in the price.
- A doji can have any length of upper and lower shadows, while a spinning top has relatively long upper and lower shadows, meaning that there was a large price range during the session.
These differences suggest that a spinning top shows more volatility and uncertainty in the market than a doji, as it shows more price movement and less consensus among buyers and sellers.
What does a bullish doji look like?
A bullish doji has no or very small body at all, meaning that the open and close prices are almost equal. It can have any length of upper and lower shadows but usually has longer lower shadows than upper shadows, meaning that the price dropped significantly during the session but then recovered to close near the open.
This shows that the sellers were initially dominant, but the buyers managed to push the price back up, creating a bullish signal.
By considering the context and using the pattern alongside other indicators, traders can make more informed decisions in the ever-changing financial market. Consider this article about candlestick patterns as part of your research.
This article contains affiliate links I may be compensated for if you click them.
Consider this article about the 3 bar play as part of your research.
Get Your Free Trading Resources
Grab the free trading journal template plus the same tools we use to stay organized, consistent, and objective.
- Free trading journal template
- Custom indicators, watchlists, and scanners
- Access our free trading community
Enter your email below to get instant access.
No spam. Unsubscribe anytime.


