How to See Implied Volatility (IV) Rank on thinkorswim
Discover the difference between IV rank and IV percentile and how you can add IV rank to the thinkorswim platform.
What are Implied Volatility and Historical Volatility
Before we get into implied volatility rank (IVR), we must understand implied volatility (IV) and historical volatility (HV). HV is also known as realized volatility.
The implied volatility of an underlying stock is a measure of the market’s expectation of future price movement. Implied volatility is a component of the Black-Scholes model used to determine option prices.
A stock with high implied volatility is expected to move a lot and have high option premiums and vice versa.
Historical volatility measures how far a stock’s price moves away from its average. Essentially, the higher the realized volatility of a stock, the riskier it is.
What is Implied Volatility Rank (IVR)
IVR is a measurement used by options traders to determine how the current implied volatility of a stock compared to the last 52 weeks. IVR is measured on a scale of 0-100. 0 is the lowest IV in the past year, and 100 is the highest in the past year.
Option traders utilize IVR to determine if implied volatility is high or low compared to what it usually trades at. Generally, you should sell options with high IV to take advantage of the elevated premiums.
What is IV Percentile (IVP)
IVP is a similar metric to IVR, except it measures the percentage of days over the last 52 weeks that implied volatility was lower than its current level. For example, if the IVP of a stock is at 25%, that means 75% of the time over the last year, IV was higher.
IV Rank vs. IV Percentile
Both IVR and IVP are valuable metrics for options traders to use. The difference is that IVP measures a percentage of days, while IVR measures IV itself.
How to Calculate IV Rank
To determine the IV rank of a stock, you must figure out the range implied volatility traded between the last 52 weeks. For example, let’s say that a stock’s IV traded between 20% and 40% over the previous 52 weeks.
If the current implied volatility is 30%, the stock’s IV rank is 50.
How to Add Implied Volatility Rank to thinkorswim
If you use thinkorswim to trade options, you may realize there is no default indicator for IV rank. However, thinkorswim does have IV percentile by default, which is similar, but not exactly the same as explained above.
Luckily, you can add a tastytrade IV rank custom indicator to thinkorswim by using the code at the bottom of this article. Even with this custom IV rank indicator, the exact readings on thinkorswim and the tastytrade brokerages do not match.
Let’s take a look at the IV rank and IV percentile of AAPL stock on both platforms so we can effectively compare and contrast. Here are the IV rank and IV percentile readings of AAPL stock at the same time on both platforms:
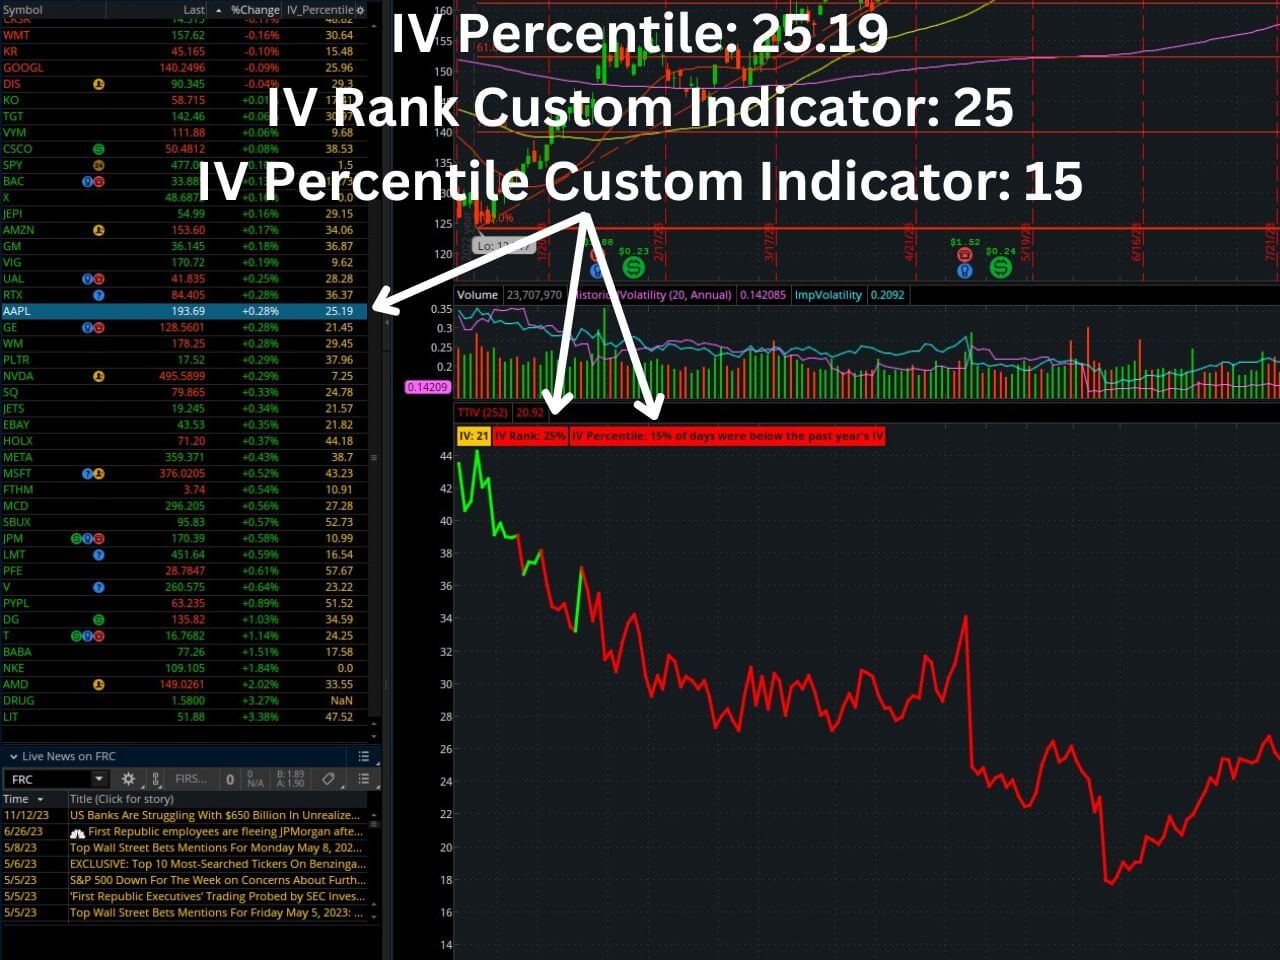
- AAPL stock thinkorswim IV percentile default – 25.19%
- AAPL stock thinkorswim IV rank custom tastytrade indicator – 25%
- AAPL stock thinkorswim IV percentile custom tastytrade indicator – 15%
As you can see from the image and numbers from thinkorswim above, the default IV percentile option essentially matches the reading of the custom tastytrade indicator. Therefore, adding it isn’t of much benefit unless you want to see it plotted on a chart.
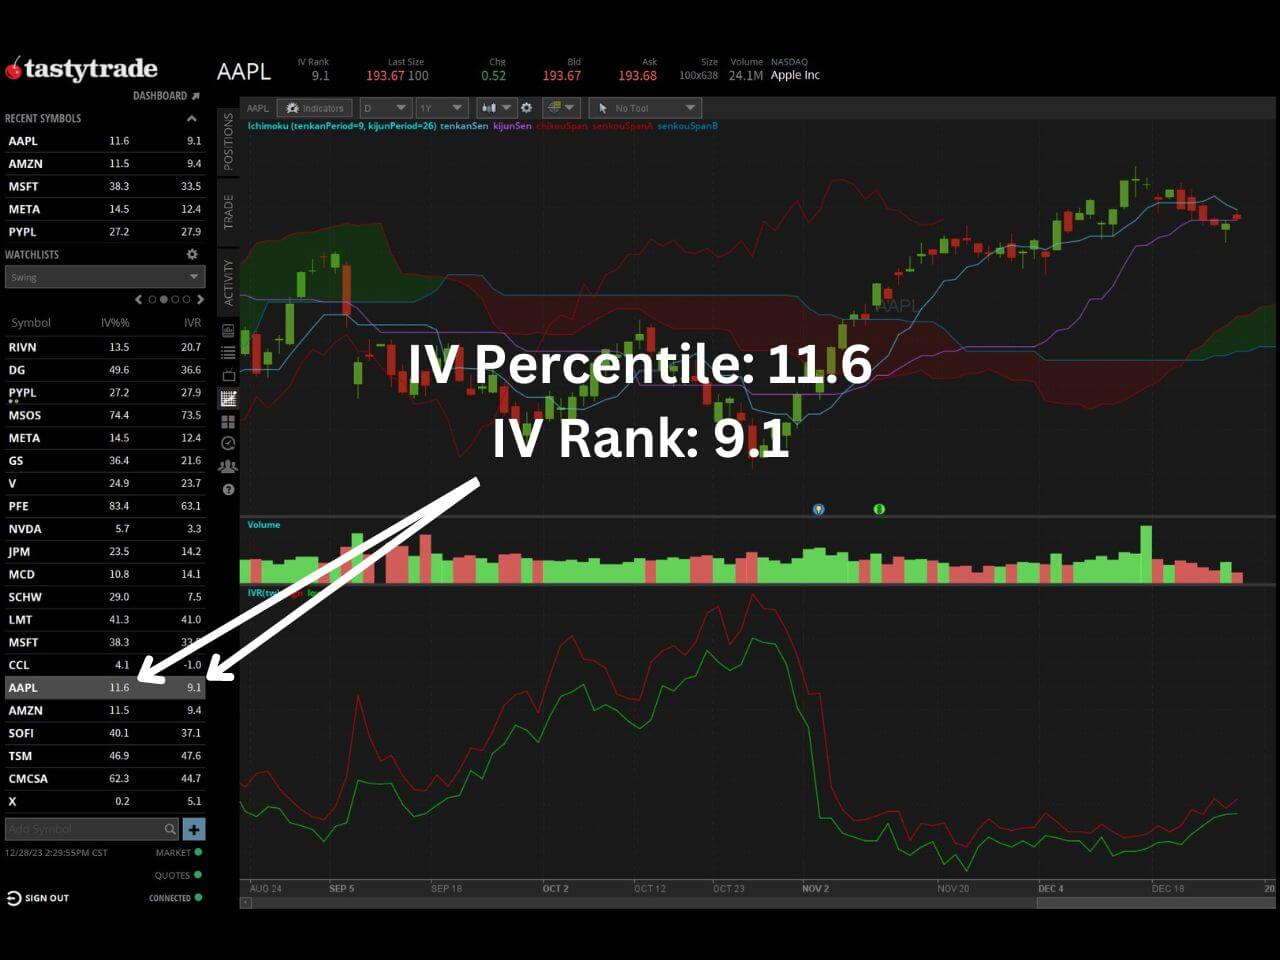
- AAPL stock tastytrade IV rank – 9.1%
- AAPL stock tastytrade IV percentile – 11.6%
As you can see from the tastytrade image and IV readings above, the IV rank and IV percentile are quite different from the readings from thinkorswim. In fact, none of them match, which tells us that stressing over these exact IV numbers is pointless.
Instead of worrying about the differences, simply stick to one platform or the other, so that you are not comparing apples to oranges when comparing the IV of different stocks.
The Custom tastytrade Indicator for thinkorswim
In the thinkorswim image above, you may notice that I am utilizing a custom indicator called TTIV (tastytrade IV). The indicator displays both an IV percentile and IV rank calculation.
I have concluded that the IV readings between thinkorswim and tastytrade do not match and are not worth deciphering. However, if you want access to the custom indicator to add to thinkorswim, I will leave the code and instructions at the bottom of this post.
My advice is to pick one method of tracking the IV rank or IV percentile and stick with it so it is the same for all of your trades.
Otherwise, you can plot the normal implied volatility indicator (not rank or percentile) on your chart and determine whether you believe the implied volatility is elevated or low.
How to Add the tastytrade Custom Indicator to thinkorswim
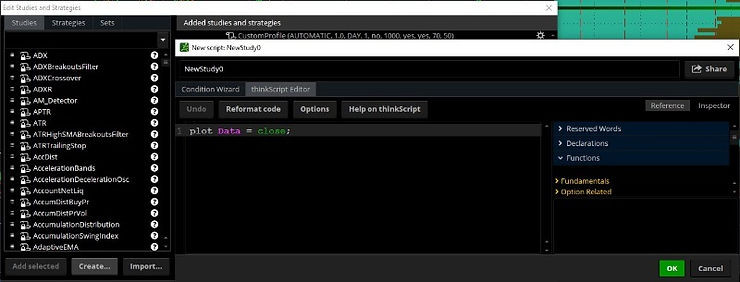
To add the tastytrade (TTIV) custom indicator to your thinkorswim charts, follow these steps:
- Chart tab -> studies (beaker) -> create -> enter name (TTIV) -> delete the default code and paste in the code at the bottom of this article.
How to Scan for Implied Volatility Rank in thinkorswim
thinkorswim has a built-in stock scanner that allows you to discover stocks with high IV rank/IV percentile. To utilize it, follow these steps:
- Scan tab -> add filter -> volatility -> IV_percentile
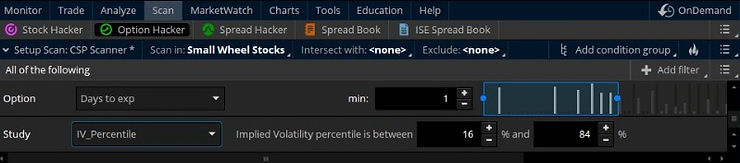
Once you add this study, you can scan for stocks that have a specific range of IVR/IVP.
Implied Volatility Rank on TradingView
If you prefer to use TradingView charts, there are custom IV rank and IV percentile indicators available for TradingView. You can learn how to add it by checking out our article on how to add IV rank and IV percentile to TradingView.
However, if you want to take full advantage of the features TradingView has to offer, you can sign up for a free trial for a premium subscription using my affiliate link. You will also get a credit toward your subscription.
Exclusive Deal: 30-Day FREE Premium Access + Bonus Credit
Don’t Miss Out – Sign up for TradingView Now!
- Advanced Charts
- Real-Time Data
- Track all Markets
# ————————START BELOW THIS LINE————————–
#
# tastytrade/dough Research Team
# Michael Rechenthin, Ph.D.
# Follow me on twitter: @mrechenthin
#
# IV Rank is a description of where the current IV lies in comparison
# to its yearly high and low IV
#
# IV Percentile gives the percentage of days over the last year, that
# were below the current IV. If the IV Rank is above 50%, then
# the script will highlight it green; otherwise red.
#
# For information on the two, see Skinny on Options Data Science,
# titled “IV Rank and IV Percentile (w/ thinkscript)” on Nov 12, 2015
# http://ontt.tv/1Nt4fcS
#
# version 3.2
#
declare lower;
declare hide_on_intraday; # do not display when using intra-day plots
input days_back = 252; # it is most common to use 1-year (or 252 trading days)
def x;
if GetAggregationPeriod() > AggregationPeriod.DAY {
x=1;
} else {
x=2;
}
AddLabel(yes, if (x==1) then “This script should be used on daily charts only” else “”);
# implied volatility
# using proxies for futures
def df = if (GetSymbol() == “/ES”) then close(“VIX”) / 100
else if (GetSymbol() == “/CL”) then close(“OIV”) / 100
else if (GetSymbol() == “/GC”) then close(“GVX”) / 100
else if (GetSymbol() == “/SI”) then close(“VXSLV”) / 100
else if (GetSymbol() == “/NQ”) then close(“VXN”) / 100
else if (GetSymbol() == “/TF”) then close(“RVX”) / 100
else if (GetSymbol() == “/YM”) then close(“VXD”) / 100
else if (GetSymbol() == “/6E”) then close(“EVZ”) / 100
else if (GetSymbol() == “/6J”) then close(“JYVIX”) / 100
else if (GetSymbol() == “/6B”) then close(“BPVIX”) / 100
else if (GetSymbol() == “/ZN”) then close(“TYVIX”) / 100
else if (Getsymbol() == “/ZW”) then close(“WIV”) / 100
else if (Getsymbol() == “/ZB”) then imp_volatility(“TLT”)
else if (Getsymbol() == “/ZC”) then imp_volatility(“CORN”)
else if (Getsymbol() == “/ZS”) then imp_volatility(“SOYB”)
else if (Getsymbol() == “/KC”) then imp_volatility(“JO”)
else if (Getsymbol() == “/NG”) then imp_volatility(“UNG”)
else if (Getsymbol() == “/6S”) then imp_volatility(“FXF”)
else imp_volatility();
def df1 = if !IsNaN(df) then df else df[-1];
# display regular implied volatility
# —————————
AddLabel(yes, “IV: ” + Round(df1 * 100.0, 0), Color.ORANGE);
# calculate the IV rank
# —————————
# calculate the IV rank
def low_over_timespan = Lowest(df1, days_back);
def high_over_timespan = Highest(df1, days_back);
def iv_rank = Round( (df1 – low_over_timespan) / (high_over_timespan – low_over_timespan) * 100.0, 0);
AddLabel(yes, “IV Rank: ” + iv_rank + “%”, if iv_rank > 50 then Color.GREEN else Color.RED);
# calculate the IV percentile
# —————————
# how many times over the past year, has IV been below the current IV
def counts_below = fold i = 1 to days_back + 1 with count = 0
do
if df1[0] > df1[i] then
count + 1
else
count;
def iv_percentile = Round(counts_below / days_back * 100.0, 0);
plot IVs = df1 * 100;
IVs.SetLineWeight(3);
IVs.AssignValueColor(if iv_rank > 50 then Color.GREEN else Color.RED);
AddLabel(yes, “IV Percentile: ” + iv_percentile + “% of days were below the past year’s IV”, if iv_percentile > 50 then Color.GREEN else Color.RED);
# thanks to Kevin Osborn for the following line
AddLabel(yes, if (GetSymbol() == “/6S” or GetSymbol() == “/ZB” or GetSymbol() == “/ZC” or GetSymbol() == “/NG” or GetSymbol() == “/ZS” or GetSymbol() == “/KC”) then “* ETF based” else “”, Color.BLACK);
# ————————END ABOVE THIS LINE————————
Get Your Free Trading Resources
Grab the free trading journal template plus the same tools we use to stay organized, consistent, and objective.
- Free trading journal template
- Custom indicators, watchlists, and scanners
- Access our free trading community
Enter your email below to get instant access.
No spam. Unsubscribe anytime.


