How to Get Candlesticks on TradingView (2026 Step-by-Step Guide)
Switching to candlestick charts on TradingView is a one-click change from the Bar Style menu, but most traders still hit one of three problems: they cannot find the toggle, candles disappear after a layout change, or the platform is rendering Heikin Ashi instead of standard candles. This guide fixes all three in 2026, walks through hollow versus filled bodies, color customization, and the candlestick pattern auto-recognition indicator, and confirms which TradingView pricing tier you actually need (spoiler: Free is fine for chart type access).
Key Takeaways
- Switching to candlestick charts on TradingView takes one click from the Bar Style toolbar at the top of any chart, and the choice persists across symbols once you save it as the default layout.
- If candles disappear, the most common causes are an accidental switch to Bars or Heikin Ashi, the chart set to range or renko mode, an indicator overlay covering the price chart, or a missing data subscription on the symbol you are viewing.
- Candlestick rendering is identical across the Free, Essential, Plus, Premium, Expert, and Ultimate tiers, so paid plans are only worth it for indicator slots, alerts, and intraday data, not for chart type access.
Recommended Tool
Financial Tech Wiz Trading Journal
Tag every candlestick pattern setup, track win rate by pattern type, and see which patterns your strategy actually performs on. Starting at $9.91/month billed annually.
Try It FreeWhat Candlestick Charts Show
A candlestick is a single price bar that encodes four data points for one trading session: the open, high, low, and close. The thick part is the body (open to close), and the thin lines above and below are the wicks (high and low). By default, a green or white body means the close was higher than the open and a red or black body means the close was lower. Candlesticks pack more visual information per bar than line charts, which is why most active traders default to them for entry timing, stop placement, and pattern reading.
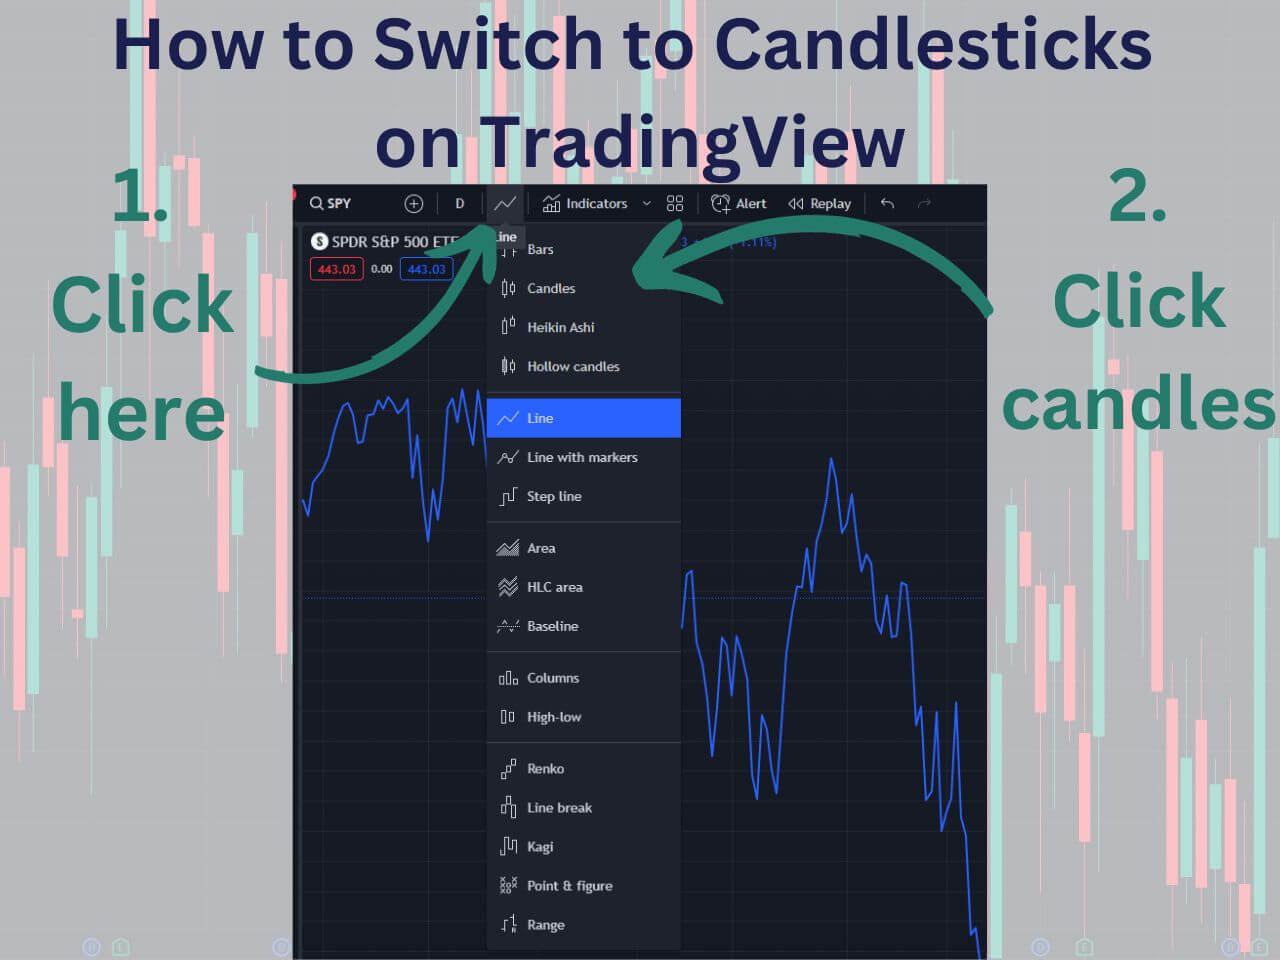
How to Switch to Candlesticks on TradingView
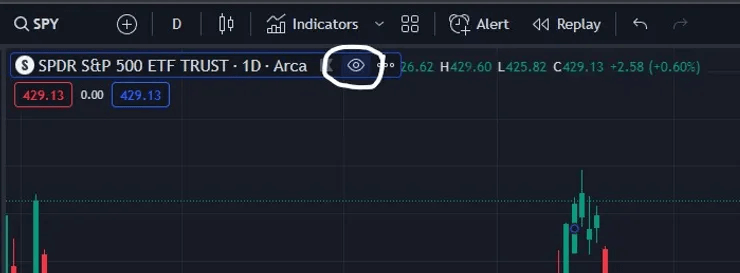
Open any chart on TradingView. Look at the top toolbar, find the Bar Style icon (it sits a few icons to the right of the symbol field and shows the current chart type), and click it. A menu opens with every chart type the platform supports: Bars, Candles, Hollow Candles, Heikin Ashi, Line, Area, Baseline, Columns, Range, Renko, Kagi, Point and Figure, Line Break, and Volume Candles. Click Candles.
The chart updates instantly. To make candlesticks the default for every new chart you open, right-click anywhere on the chart and choose Save chart layout (or Save as default from the toolbar). TradingView will load candlesticks on every symbol going forward, including across watchlist switching and symbol search.
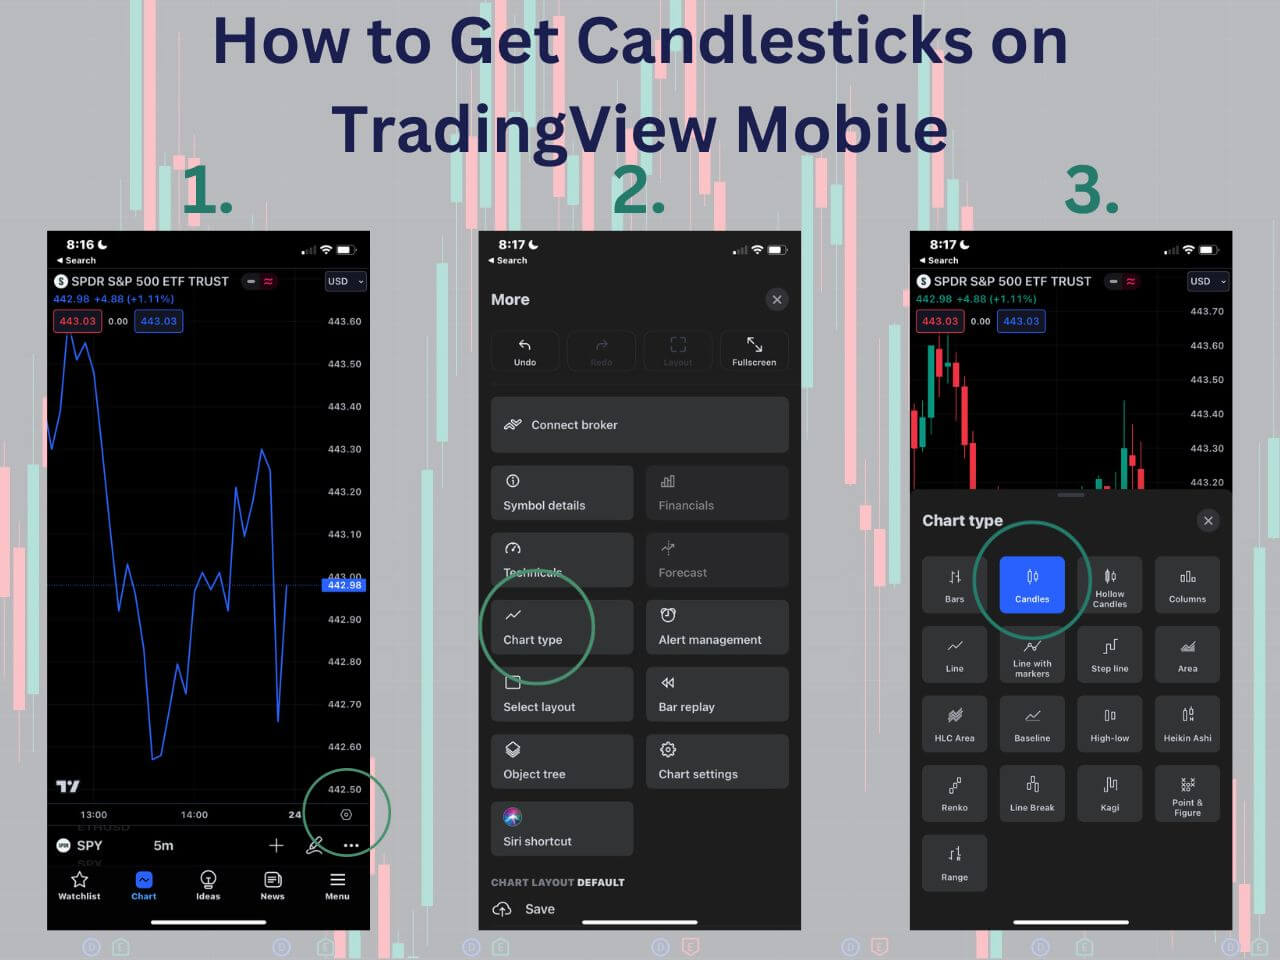
On mobile, tap the chart type icon at the bottom of the chart screen, scroll the chart type list, and tap Candles. The mobile app uses the same default-layout logic as the desktop app, so saving the layout in either place syncs to the other.
Hollow vs Filled Candlestick Bodies
TradingView ships two body styles: filled and hollow. Filled candles use a solid color body for both up and down sessions. Hollow candles use an unfilled body for sessions that closed higher than the previous close and a filled body for sessions that closed lower, regardless of within-session direction.
The practical difference: hollow candles encode close-versus-previous-close direction, giving a cleaner read on whether momentum is continuing or reversing across multiple bars. Pattern traders watching engulfing, harami, or morning star setups generally prefer filled candles because the patterns are defined relative to body color. Trend traders who want a cleaner momentum read often prefer hollow. To switch styles, open Bar Style and pick either Candles (filled) or Hollow Candles. The data is identical; only the body fill rule changes.
Customizing Candlestick Colors
The default green-and-red palette works for most traders, but TradingView lets you recolor every part of a candlestick separately. Right-click anywhere on the chart, choose Settings, and switch to the Symbol tab. You will see four color controls: up body, down body, borders (the outline around the body), and wicks. Each one can be set independently, so a black-and-white traditional palette is one click each.
Common recolor patterns: traders coming from Bloomberg or thinkorswim often switch to a blue-up / red-down or white-up / black-down scheme. Charts on a dark background often look cleaner with desaturated body colors and brighter wick colors. Once your palette is set, click the small dropdown near the Save button and choose Save as default, otherwise the change reverts when you load a different layout.
What to Do When Candles Disappear
“Candles disappeared” is one of the most common TradingView support questions, and almost always traces back to one of four causes. Work through them in order:
- Bar Style accidentally switched. Open the Bar Style menu and confirm Candles is selected. If the chart is on Bars, Heikin Ashi, Line, Area, Baseline, Range, or Renko, switch back to Candles.
- Indicator overlay covering price. An indicator like Volume Profile, a custom Pine script, or a heavy chart overlay can render on top of the price chart and visually hide candles. Click the indicator name in the upper-left of the chart, choose Hide, or reorder it so it sits behind the price.
- Body, border, or wick toggles disabled. In Settings, Symbol tab, confirm the Body, Borders, and Wick checkboxes are all enabled. If any one is off, the candle becomes invisible or partially invisible.
- Missing market data subscription. Some symbols (futures, foreign exchanges, certain crypto pairs) require an additional data subscription. If the chart shows no data at all, click the symbol name and check whether the exchange tag is grayed out or marked as requiring an upgrade.
If none of those fix the issue, click the chart, press the keyboard shortcut Alt + R (Windows) or Option + R (Mac), which resets the chart to fit and forces a redraw. That clears most rendering glitches without touching settings.
Heikin Ashi vs Candlesticks
Heikin Ashi looks like candlesticks but is calculated differently. Standard candlesticks plot the actual open, high, low, and close of each session. Heikin Ashi plots an averaged open and close derived from the previous Heikin Ashi bar, which smooths the chart and makes trends visually obvious at the cost of price accuracy.
Use standard candlesticks when you need real OHLC data: entry timing on the open or close, exact stop placement, and reading patterns like the bearish engulfing pattern or morning star pattern where body relationships are pattern-defining. Use Heikin Ashi when you want a smoothed view of trend direction with less noise, which can help hold decisions on multi-day swing trades but should never drive execution prices. The cleanest workflow is to default to standard candles and open a second panel running Heikin Ashi alongside.
TradingView Pricing in 2026
TradingView restructured its plans in 2026 into six tiers. The good news for candlestick users: chart type access is identical across every tier, including Free. Paid plans only matter if you need more indicators per chart, more saved layouts, intraday data on premium exchanges, multi-monitor support, or alert volume.
Free
2 indicators per chart, 1 saved layout, 1 server-side alert, ads displayed. Candles, Hollow Candles, and Heikin Ashi all work. For traders charting one or two symbols at a time, Free is the correct tier.
Essential
5 indicators per chart, 2 charts per layout, 5 saved layouts, 20 alerts, no ads. The first tier where most active traders find Free limiting because of the 2-indicator cap.
Plus
10 indicators per chart, 4 charts per layout, 10 saved layouts, 100 alerts, custom timeframes and intraday Renko/Kagi/Point and Figure bars. The sweet spot for most swing traders.
Premium
25 indicators per chart, 8 charts per layout, unlimited saved layouts, 400 alerts, second-based intervals, and bar replay. Suitable for day traders watching multiple charts simultaneously.
Expert and Ultimate
Top-end tiers with the largest indicator and chart counts, longest data retention, and priority support. Positioned for prop traders and quants; most retail traders never need them.
If you want to test a paid tier before committing, see how to start a TradingView free trial, or read the full breakdown in how much is TradingView. You can also sign up for a TradingView account directly.
Get Your Free Trading Resources
Grab the free trading journal template plus the same tools we use to stay organized, consistent, and objective.
- Free trading journal template
- Custom indicators, watchlists, and scanners
- Access our free trading community
Enter your email below to get instant access.
No spam. Unsubscribe anytime.
Turning On Candlestick Pattern Indicators
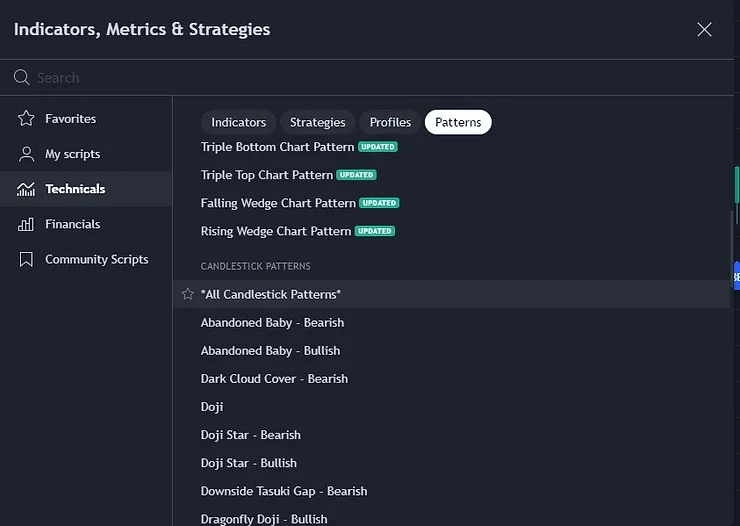
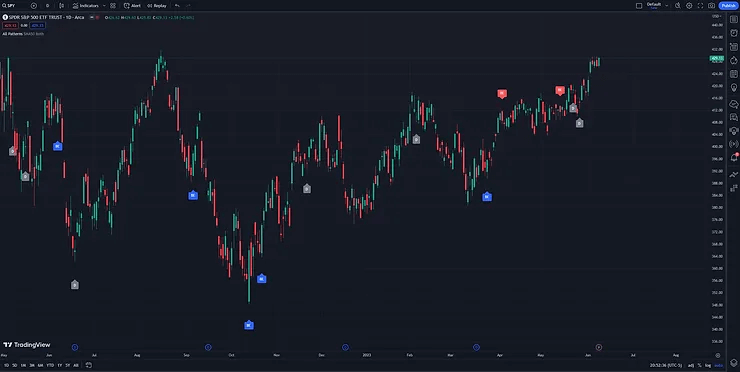
TradingView ships two built-in tools that auto-detect candlestick patterns on the chart. Open the Indicators panel (the fx icon in the top toolbar), search for them by name, and click to add.
- Candlestick Patterns. The official TradingView indicator. Detects 30+ standard patterns including engulfing, hammer, doji, morning star, evening star, harami, and three white soldiers. Each pattern is labeled directly on the chart at the bar where it triggered.
- All Candlestick Patterns. A community Pine script with broader coverage and more configuration options. Useful if you want to filter by bullish-only, bearish-only, or specific pattern subsets.
Both indicators tag patterns as they form, but tags alone are not a trade signal. Pattern recognition is most useful when paired with confluence: a hammer at a moving average support, an engulfing inside a known range, or a morning star at a prior swing low. For deeper pattern coverage and trade examples, see the best TradingView indicators roundup.
Once a pattern triggers and you decide to take the trade, log it. Tagging entries by pattern type, timeframe, and outcome is how you find out which patterns actually work on your strategy and which look great on a chart but lose money in real life. The Financial Tech Wiz Trading Journal handles the tagging and win-rate analytics automatically, or start with the free trading journal template if you want to log a few trades by hand first.
Frequently Asked Questions
How do I switch to candlesticks on TradingView?
Click the Bar Style toolbar icon at the top of the chart and select Candles. Your selection saves with the chart. To make it the default for every new chart, right-click the chart, choose Save as default, and TradingView will load candlesticks on every symbol going forward.
Why did my candles disappear on TradingView?
The four most common causes are an accidental switch to Bars or Heikin Ashi from the Bar Style menu, the chart accidentally set to range or renko mode, an indicator overlay positioned on top of the price chart hiding the candles, or a missing market data subscription for that symbol. Open the Bar Style menu and confirm Candles is selected, then check Indicators for any overlay you can hide or reorder.
How do I unhide candles on TradingView?
If candles are not showing, open the chart settings panel, go to the Symbol tab, and confirm the Body, Borders, and Wick toggles are all enabled. If they are enabled and candles are still missing, the chart may be in a non-OHLC mode (line, area, or baseline). Switch to Candles in the Bar Style menu.
Are candlestick charts free on TradingView?
Yes. Candlestick chart rendering is included on every TradingView tier including the Free plan. Paid plans (Essential, Plus, Premium, Expert, Ultimate) unlock more indicator slots, alerts, and intraday data resolution, but the chart type itself is identical across all tiers.
Does TradingView have a candlestick countdown timer?
Yes. Right-click the chart, open Settings, go to the Symbol tab, and enable Countdown to bar close. A small timer appears next to the most recent candle showing how long until that bar closes. Traders use this to time entries on the open of the next session.
Why are my TradingView candles green and red instead of white and black?
TradingView ships with green-and-red as the default. To change to white and black, hollow versus filled, or any custom palette, right-click the chart, open Settings, go to the Symbol tab, and recolor the up body, down body, borders, and wicks individually. Save as default layout so the change persists across symbols.
Heikin Ashi vs candlesticks: which should I use?
Use standard candlesticks for entry timing, stop placement, and reading actual session OHLC. Use Heikin Ashi when you want a smoothed view of trend direction with less noise. Heikin Ashi candles are calculated from averaged open and close values, so the prices shown are not real session prices and you cannot use them for exact entry execution.
�������������������������������������������������������������������������������������������������������������������������������������������������������������������������������������������������������������������������������������������������������������������������������������������������������������������������������������������������������������������������������������������������������������������������������������������������������������������������������������������������������������������������������������������������������������������������������������������������������������������������������������������������������������������������������������������������������������������������������������������������������������������������������������������������������������������������������������������������������������������������������������������������������������������������Get Your Free Trading Resources
Grab the free trading journal template plus the same tools we use to stay organized, consistent, and objective.
- Free trading journal template
- Custom indicators, watchlists, and scanners
- Access our free trading community
Enter your email below to get instant access.
No spam. Unsubscribe anytime.


