
Bearish Engulfing Pattern: How to Spot It, Confirm It, and Trade It

A bearish engulfing pattern is one of the few candlestick signals that tells you something concrete: a session opened higher than the last close and still finished below where the previous candle began. Sellers took the whole range back. The pattern itself is easy to find, which is exactly why it gets traded badly so often, because the setup is only worth taking when the context, the volume, and the follow-through all agree.
Key Takeaways
- A bearish engulfing pattern needs a real body that covers the previous candle’s body completely, and it only carries meaning after a genuine uptrend or into resistance.
- Confirmation matters more than the pattern: rising volume on the engulfing candle plus a lower close on the next candle separates the setups worth trading from the noise.
- The standard structure is entry below the engulfing candle’s low, stop above its high, and a first target at the nearest prior swing low or support shelf.
Track your pattern trades
Financial Tech Wiz Trading Journal
Candlestick patterns are a hypothesis until you have your own numbers on them. Log every engulfing setup you take, tag it in the Trades tab, and review win rate and P&L across your positions broken down by symbol and hold duration.
What a Bearish Engulfing Pattern Actually Is
A bearish engulfing pattern is a two-candle formation. The first candle is bullish, usually modest in size. The second candle is bearish and its real body completely engulfs the real body of the first: it opens at or above the prior close and closes at or below the prior open.
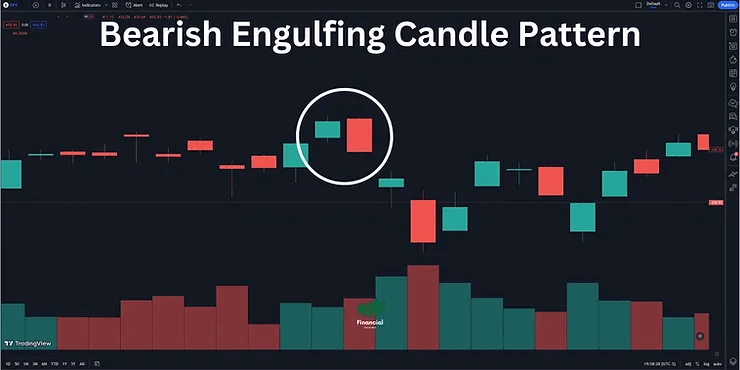
The word “engulf” refers to the bodies, not the wicks. This is the single most common mistake I see traders make with this pattern. A candle whose shadow extends past the previous candle’s high while its body sits inside the prior range is not an engulfing pattern. It is a wide-range bar, and it carries none of the same information. If the second body does not cover the first body from open to close, the setup does not qualify and you should move on.
Two more structural conditions separate a textbook example from a coincidence. The first candle should be a normal bullish candle, not a doji or a near-zero-body bar, because engulfing a body that barely exists proves nothing about seller strength. And the second candle should close near its low rather than mid-range, since a bearish candle that closes in the upper third of its own range is telling you buyers defended the session even as it printed red.
If you want the wider map of how this pattern sits alongside reversal structures like the head and shoulders or the double bottom, the chart patterns hub covers the full set and where each one belongs in a trading plan.
The Psychology Behind the Second Candle
The reason this pattern gets attention is that it compresses a complete shift in control into two bars. The market opens higher, which means buyers were still willing to pay up at the open. Then sellers absorb that demand, push price through the entire previous session’s body, and close it below where buyers started. Every trader who bought during the prior candle is now underwater, and every trader who bought the gap up is underwater by more.
That trapped-buyer dynamic is what creates follow-through when the pattern works. The next session opens with a pool of positions that need to exit, and their exits become supply. When the pattern fails, it is usually because that pool was too small to matter: the engulfing candle formed on light volume, in the middle of a range, with no crowd on the wrong side of it.
This is also why the pattern is far more reliable at the top of an extended move than anywhere else. The longer the uptrend that precedes it, the more late buyers exist to be trapped. A bearish engulfing candle in the third week of a grinding advance means something. The same candle on bar four of a sideways chop means almost nothing.
How to Spot a Bearish Engulfing Pattern on a Chart
Start with the chart type. You need standard Japanese candlesticks, not Heikin Ashi, not bars, not line. Heikin Ashi averages the open and close, so it will smooth an engulfing pattern out of existence or manufacture one that did not happen on real prices. If you need to switch your chart back, the walkthrough on how to set up candlestick charts on TradingView covers it in a couple of clicks.
Then scan in this order rather than hunting for red candles at random:
- Find the trend first. Mark the last few swing highs and lows. If price is not making higher highs into your candidate, stop.
- Check the location. The best candidates form at a prior swing high, a round number, a moving average the market has been respecting, or the upper edge of a range.
- Verify the bodies. Open of candle two at or above close of candle one, close of candle two at or below open of candle one. No exceptions.
- Read the close. The engulfing candle should finish in the lower third of its own range.
- Look at volume. Compare the engulfing candle’s volume to the twenty-bar average before you decide anything.
You can automate the first pass. Most charting platforms ship a built-in candlestick pattern recognition study, and TradingView has both a native engulfing detector and a deep community script library for it. Treat any automated flag as a candidate for step one of the list above, never as a signal in itself. The detector does not know whether the pattern formed in an uptrend or in the middle of nowhere.
Charting the pattern
TradingView
Candlestick pattern detection, volume overlays, and multi-timeframe layouts in one workspace, so you can check trend, location, and volume on a single screen before you take an engulfing setup.
The Four-Point Confirmation Checklist
The pattern alone is a coin flip. Confirmation is what turns it into a setup. Run all four checks before you commit size.
1. Trend context
There must be something to reverse. A bearish engulfing pattern is a reversal signal, and a reversal requires a prior move. Require at least three to five sessions of higher highs and higher lows, or a clear push into a level that has rejected price before.
2. Volume expansion
The engulfing candle should print above-average volume, ideally at least 1.5 times the twenty-bar average. Volume is the proxy for how many buyers actually got trapped. An engulfing candle on below-average volume usually means the move happened in thin conditions and will be given back.
3. Next-candle follow-through
The single most useful filter is also the simplest: wait for the candle after the pattern to close below the engulfing candle’s low. You give up a little of the move in exchange for eliminating a large share of the failures. If the following candle closes back inside the engulfing range, the sellers who created the pattern could not hold their ground.
4. An independent indicator
Use one, not five. Bearish RSI divergence into the high, price extended well above a 20-period moving average, or a stalling volume profile at the level all work. The point is a second, non-candlestick reason to think the move is exhausted. If you are choosing what to put on the chart, the roundup of the best TradingView indicators covers the ones worth the screen space.
Entry, Stop Loss, and Target Placement
The mechanics are deliberately mechanical, because the discretionary part of this trade is already spent on deciding whether the setup qualifies at all.
Entry has two accepted versions. The aggressive entry is a short at or just below the close of the engulfing candle, which gets you the best price and accepts a higher failure rate. The conservative entry is a sell stop one tick below the engulfing candle’s low, triggered on the following session, which costs you part of the move and filters out the patterns that immediately reverse. For most traders the conservative entry is the correct default.
The stop goes above the high of the engulfing candle. Not above the close, not at a fixed percentage: above the high, because that is the price that invalidates the pattern. If a subsequent candle trades through the engulfing candle’s high, the sellers who defined the setup have been overrun and the reason for the trade no longer exists. On volatile instruments add a small buffer, a few ticks or a fraction of the average true range, so a wick does not stop you out of a thesis that is still intact.
The first target is the nearest prior swing low or the top of the last consolidation shelf. That is where the previous supply came in and where buyers are most likely to step back. If the resulting reward-to-risk ratio is below roughly 2 to 1 measured from the stop above the engulfing high to that first target, skip the trade. A qualifying pattern with poor geometry is still a bad trade.
For anything held beyond the first target, trail the stop to the high of each subsequent lower high rather than to a fixed distance. The structure that produced the signal should be the structure that manages it.
What the Pattern Looks Like in Practice
The walkthrough below uses illustrative numbers to show how the rules fit together. It is not a recommendation and not a record of a real trade. Picture a stock that has run for eleven sessions off a base, gaining roughly 18%, with the last four candles getting progressively smaller as the advance loses momentum. It closes at 62.40 on a narrow bullish bar.
The next session gaps open to 62.90 on an analyst note, trades up to 63.10 in the first half hour, then sells off all day and closes at 61.15 on volume roughly double the twenty-day average. The body runs from 62.90 down to 61.15, which fully engulfs the prior body of 61.80 to 62.40. The close sits in the bottom fifth of the day’s range. That is a textbook bearish engulfing pattern, and it has all three of the conditions that matter: real trend behind it, real volume, and a weak close.
The conservative trade is a sell stop at 61.10, one tick below the engulfing low. The stop goes at 63.20, just above the high. The first target is the consolidation shelf at 56.50 from three weeks earlier. Risk is 2.10 per share and the first target sits 4.60 away, so the geometry clears the 2 to 1 filter with room. If the following session instead closes back above 62.00, the setup is void and there is no trade.
Bullish vs Bearish Engulfing: The Difference That Matters
The two patterns are structural mirrors. A bullish engulfing pattern has a bearish candle followed by a bullish candle whose body covers it, and it appears after a downtrend. A bearish engulfing pattern has the opposite sequence and appears after an uptrend.
The difference that actually affects your results is behavioral, not structural. Downtrends end in fear and tend to reverse quickly, so bullish engulfing patterns often resolve fast and violently. Uptrends end in complacency and tend to roll over gradually, so bearish engulfing patterns more often produce a slow topping process with several failed attempts before the real break. Practically, that means you should expect to sit through more chop after a bearish engulfing signal and you should be slower to add size on the first one you see.
Both patterns belong to the same family as the hanging man candle and the morning star pattern, and they are read the same way: location first, body structure second, volume third.
Where the Bearish Engulfing Pattern Fails
Four failure modes account for most of the losses on this setup, and all four are avoidable.
The first is trading it in a range. Inside a sideways band, engulfing candles print constantly at both edges and mean nothing beyond normal rotation. The pattern needs a trend to reverse.
The second is the gap illusion. When the first candle’s body is small, a wide opening gap up on the second session can satisfy the definition without much real selling behind it: price opens well above the prior close, drifts sideways, and closes a few ticks under the prior open. The body technically engulfs, but almost nobody got trapped and almost no supply was created. Check the intraday behavior before you trust the shape.
The third is counting wicks as engulfment. It is worth repeating because it is the most frequent misread. Bodies engulf bodies. Shadows are not part of the definition.
The fourth is fighting a dominant higher timeframe. A bearish engulfing pattern on a 15-minute chart inside a strong daily uptrend is usually a pullback entry for buyers, not a short. Check at least one timeframe above the one you are trading before you act, the same discipline that applies to reading doji candle types or any other single-bar signal.
Best Timeframes for Trading the Pattern
The pattern is timeframe-agnostic in theory and very much not in practice. Reliability scales with the number of participants whose decisions are represented in the bar.
Daily and weekly charts produce the cleanest signals. A daily bearish engulfing candle represents a full session of two-sided decision-making, and a weekly one represents five. These are the timeframes where the trapped-buyer logic genuinely holds, and they are where swing traders should be looking.
Four-hour and one-hour charts are usable with strict confirmation, particularly at session opens and at levels that already matter on the daily. Below fifteen minutes, treat the pattern as texture rather than signal: engulfing bodies appear dozens of times a day on a five-minute chart, and many of them are noise created by a single large order.
One practical rule from the same family of signals as the bullish green hammer candle: the higher the timeframe on which the pattern appears, the fewer confirmation filters you need, and the lower the timeframe, the more you need.
Track Every Engulfing Setup Before You Trust It
Published statistics on candlestick reliability are close to useless for an individual trader, because they average across instruments, timeframes, and market regimes you do not trade. The number that matters is what this pattern does on your symbols, on your timeframe, with your confirmation rules. Nobody can hand you that. You have to build it.
The method is straightforward. Log every bearish engulfing trade you take with the same fields each time: instrument, timeframe, trend context, volume ratio, whether you waited for follow-through, entry, stop, exit. After twenty or thirty entries you will be able to see which of the four confirmation checks is actually earning its place in your process and which one you can drop. Over my years of trading, that exercise has changed more of my rules than any book has.
If you are starting from nothing, the free trading journal template gives you a Google Sheets structure you can begin logging into today. When you want the tracking to happen automatically, the Financial Tech Wiz Trading Journal imports your fills from 25+ brokers and gives you win rate and P&L across your positions broken down by symbol and hold duration, plus an equity curve and AI-assisted review of what your own history says.
Find out if the pattern works for you
Financial Tech Wiz Trading Journal
Import your fills automatically, log the context behind each engulfing setup, and let your own results decide which confirmation rules stay in your process. $19 per month, or $9.91 per month billed annually.
FAQ
What is the success rate of a bearish engulfing pattern?
Published figures range from roughly 50% to the high 70s depending on the study, the market tested, and how the researcher defined a successful outcome, which is why they should be treated as trivia rather than as an edge. Unfiltered, the pattern is close to a coin flip. The variables that move the number are the ones you control: requiring a genuine prior uptrend, requiring above-average volume, and waiting for the next candle to close below the engulfing low. Measure it on your own logged trades rather than trusting a published percentage.
Is a bearish engulfing pattern good or bad?
It is neither on its own; it is information about who won a session. For a trader holding a long position it is a warning to tighten risk. For a trader looking for short entries at the end of an extended advance it is a candidate setup. For anyone looking at a sideways chart it is noise. The pattern’s meaning is entirely a function of where it appears.
What indicators confirm a bearish engulfing pattern?
Volume is the primary one: the engulfing candle should print meaningfully above its twenty-bar average. After that, bearish RSI divergence into the high, price stretched well above a 20-period moving average, and a volume profile showing thin acceptance at the highs are the three most useful secondary confirmations. Use one secondary indicator, not several, and always pair it with the next-candle close below the engulfing low.
Where do you put the stop loss on a bearish engulfing trade?
Above the high of the engulfing candle, with a small buffer on volatile instruments. That price is what invalidates the setup: if the market trades through it, the sellers who defined the pattern have been overrun and the reason for the trade is gone. Placing the stop at a fixed percentage or above the candle’s close instead of its high is the most common way traders end up being stopped out of a valid thesis or, worse, holding an invalidated one.
What is the difference between a bearish engulfing pattern and a dark cloud cover?
Both are two-candle bearish reversals that follow an uptrend, and both require the second candle to open above the prior close. The difference is how far down the second candle closes. Dark cloud cover closes below the midpoint of the first candle’s body but still above its open. A bearish engulfing pattern closes at or below the first candle’s open, taking the entire body. The engulfing version is the stronger of the two precisely because it leaves nothing of the prior session’s gain intact.
Get Your Free Trading Resources
Grab the free trading journal template plus the same tools we use to stay organized, consistent, and objective.
- Free trading journal template
- Custom indicators, watchlists, and scanners
- Access our free trading community
Enter your email below to get instant access.
No spam. Unsubscribe anytime.







