
Descending Triangle Pattern: Trading the Breakdown

Technical analysis is an essential part of trading, and the descending triangle is one of the more reliable bearish continuation patterns you will see on a chart: a flat support line getting tested repeatedly by a series of lower highs.
This guide covers how to spot a genuine descending triangle, when it can actually resolve bullish instead of bearish, and how to trade the breakdown (or the reversal) without getting caught in a false move. To visualize the concepts discussed in this article, consider using TradingView, a charting platform built for drawing pattern trendlines and confirming breakout volume.
Key Takeaways
- A descending triangle forms from a horizontal support line and a descending line of lower highs; it resolves bearish more often than not, but a breakout above the descending trendline signals a bullish reversal instead.
- A valid breakdown needs a close below support with volume expanding, not just a brief wick through the line; treat a low-volume break as a probable false breakout.
- The descending triangle is a distinct pattern from the falling wedge (two converging trendlines that both slope down); mixing the two up leads to the wrong bias on a trade.
Track the Breakdown
Financial Tech Wiz Trading Journal
Spotting the pattern is only half the trade. Tag every descending triangle setup, log your entry and stop, and see your real win rate and P&L on the pattern by symbol and hold duration, not just a gut feeling about how it usually plays out.
Start Tracking Your TradesWhat Is the Descending Triangle Formation
The descending triangle pattern is characterized by:
- A horizontal trend line connecting a series of price lows
- A descending trend line connecting lower highs
This formation signals a potential bearish continuation, often indicating a weakening of buying pressure. The convergence of these two trend lines creates the triangular shape for which the pattern is named.
The descending triangle is one of three triangle formations traders use, alongside the ascending triangle and the symmetrical triangle. The complete triangle chart pattern guide covers all three types side by side with breakout rules, stop placement, and measured-move target math. It is also one of several patterns covered in our full chart patterns hub, which organizes every pattern on the site by type.
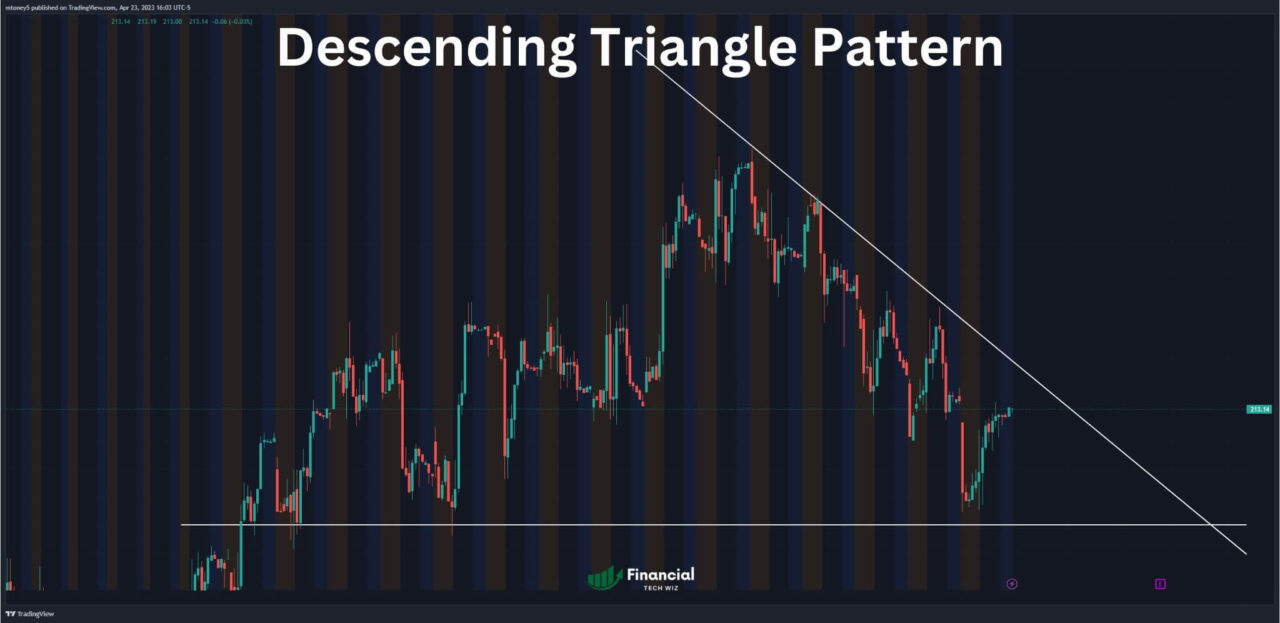
Chart It Yourself
TradingView
Spotting a descending triangle in real time takes a charting platform built for drawing trendlines and confirming volume on the breakout candle. TradingView is where I mark up these setups myself, with pattern-drawing tools and volume overlays that make a real breakdown, or a false one, obvious.
Try TradingViewKey Features and Psychological Implications
Understanding the psychology behind the descending triangle pattern is critical to recognizing its implications. Key features include:
- An established downtrend prior to the pattern’s appearance
- A descending upper trend line indicating increased selling pressure
- A horizontal lower trend line serving as a support level
As the price repeatedly tests the support level without breaking through, traders may become increasingly bearish, leading to a high-volume breakdown below the support.
Is the Descending Triangle Pattern Bullish or Bearish?
The descending triangle pattern is primarily viewed as a bearish continuation pattern, suggesting further declines in price. However, traders should remain alert to the possibility of a bullish reversal. If the price breaks out above the descending trend line on real volume, it may signal an uptrend reversal instead of a breakdown.
Descending Triangle vs. Falling Wedge
Traders often confuse the descending triangle with the falling wedge, but the two patterns send different signals. A descending triangle has one flat trendline (support) and one sloped trendline (descending resistance), and it typically behaves as a bearish continuation pattern. A falling wedge has two converging trendlines that both slope downward, and despite its downward slope, it usually behaves as a bullish reversal pattern once price breaks out above the upper trendline.
Mixing up the two patterns is a common way traders end up positioned against the actual signal. Before you act on either one, check whether the support line is genuinely flat (descending triangle) or also sloping down (falling wedge); that single detail changes the expected direction of the breakout.
Evaluating the Pattern’s Accuracy and Effectiveness
While descending triangles are known for their predictive capabilities, traders should consider the following:
- Percentage of successful breakouts: confirm the pattern’s reliability through historical data rather than assuming every triangle plays out the same way
- Potential false breakouts: remain cautious of premature entries, especially on low-volume breaks of support
- Complementary indicators: utilize moving averages and volume analysis for signal confirmation before sizing a position
Contrasting Descending and Ascending Triangles
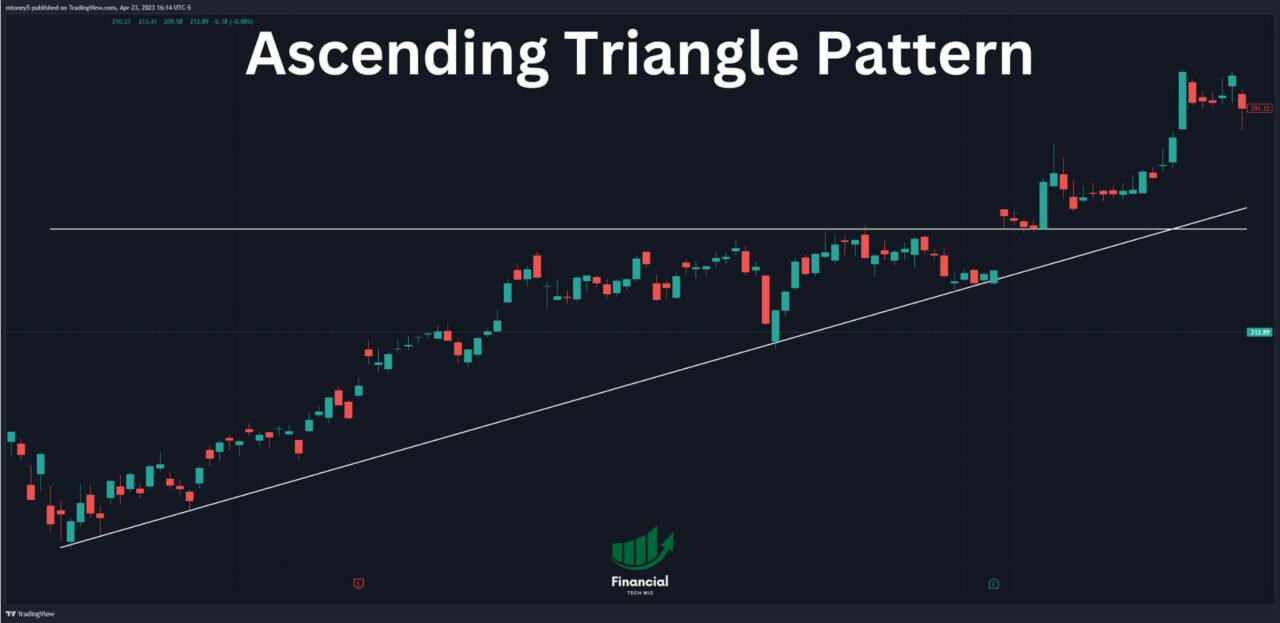
While the descending triangle pattern has a horizontal support and descending resistance, the ascending triangle exhibits a horizontal resistance and ascending support.
Both patterns are continuation patterns, with the ascending triangle typically viewed as bullish.
Strategies for Trading the Descending Triangle
Effectively trading the descending triangle pattern involves:
- Timing entries after a high-volume breakout below support
- Establishing price targets based on the height of the pattern
- Setting stop-loss levels above the descending trend line
For bullish reversal scenarios, consider entering long positions upon a breakout above the descending trend line, using the tools on our best TradingView indicators guide to confirm momentum before you commit size.
Leveraging the Descending Triangle in Your Trading Toolkit
In summary, the descending triangle pattern is a powerful tool for identifying potential bearish continuations and reversals. By understanding the pattern’s features and psychology, traders can capitalize on profitable opportunities.
As you continue your trading journey, consider exploring additional patterns such as the Cup and Handle, Volatility Contraction Pattern (VCP), and Doji Candle Types for a well-rounded approach.
Want a simple place to start logging your own descending triangle trades before committing to a full platform? Grab the free trading journal template below: a straightforward spreadsheet for traders who want to track entries, exits, and notes without any setup.
Get Your Free Trading Resources
Grab the free trading journal template plus the same tools we use to stay organized, consistent, and objective.
- Free trading journal template
- Custom indicators, watchlists, and scanners
- Access our free trading community
Enter your email below to get instant access.
No spam. Unsubscribe anytime.
Frequently Asked Questions
Can a descending triangle pattern be bullish?
Yes. A descending triangle is a bearish continuation pattern by default, but if price breaks out above the descending resistance line on real volume instead of breaking down through support, that is a bullish reversal signal. The pattern’s shape does not guarantee a bearish outcome; the direction of the confirmed breakout does.
What are the pros and cons of trading the descending triangle pattern?
The main advantage is a clearly defined support level and trend line that make entries, stops, and price targets easy to structure. The main drawback is the risk of a false breakout: price can wick below support and reverse, or grind sideways for longer than expected before resolving, so volume confirmation on the breakout candle matters more than the shape of the triangle itself.
What is the difference between a descending triangle and an ascending triangle?
A descending triangle has a flat horizontal support line and a descending line of lower highs, and it typically resolves bearish. An ascending triangle is the mirror image: a flat horizontal resistance line and a rising line of higher lows, and it typically resolves bullish. Both are continuation patterns, just with opposite directional bias.
Is a falling wedge the same as a descending triangle?
No. A descending triangle has one flat trendline and one descending trendline. A falling wedge has two trendlines that both slope downward and converge. Despite the similar downward slope, a falling wedge usually behaves as a bullish reversal pattern, while a descending triangle usually behaves as a bearish continuation pattern. Check both trendlines before assuming which pattern you are looking at.
Get Your Free Trading Resources
Grab the free trading journal template plus the same tools we use to stay organized, consistent, and objective.
- Free trading journal template
- Custom indicators, watchlists, and scanners
- Access our free trading community
Enter your email below to get instant access.
No spam. Unsubscribe anytime.







