Discover a comparison of VGK vs. VUG to determine which is best for you! Use the table below to compare their key characteristics.
VGK vs. VUG Key Characteristics
| Metrics | VGK | VUG |
|---|---|---|
| 1-Year Annual Return | 20.03% | 46.78% |
| 5-Year Annual Return | 9.19% | 19.17% |
| Expense Ratio | 0.11% | 0.04% |
| Dividend Yield | 2.87% | 0.52% |
| Number of Holdings | 1308 | 221 |
You can compare these funds in real time using the TradingView chart below. Ensure to click the “ADJ” button at the bottom right of the chart to adjust the data for dividends!
Overview of VGK
The Vanguard FTSE Europe ETF, trading under the ticker symbol VGK, is an exchange-traded fund (ETF) managed by Vanguard. It is designed to track the performance of the FTSE Developed Europe All Cap Index, which includes a broad range of stocks across all market capitalizations from developed European countries.
Overview of VUG
The Vanguard Growth ETF, VUG, is an exchange-traded fund managed by Vanguard. VUG is specifically designed to track the performance of the CRSP US Large Cap Growth Index, which comprises large U.S. companies exhibiting growth characteristics. While VUG offers exposure to growth segments of the large-cap market, this focus also entails specific risks associated with growth investing, such as higher price volatility and sensitivity to market cycles.
Performance Comparison of VGK vs. VUG
The total return performance including dividends is crucial to consider when analyzing different investment funds.
As of 1/15/2024, VGK has a one year annualized return of 20.03%, while VUG has a five year annualized return of 46.78%.
VGK vs. VUG Dividend Yield
Both VGK and VUG pay dividends to their shareholders from the earnings of their underlying stocks. The dividend yield is a measure of how much a company pays in dividends relative to its share price.
As of 1/15/2024 the dividend yield of VGK is 2.87%, while the dividend yield of VUG is 0.52%.
VGK vs. VUG Expense Ratios
The expense ratio is a measure of how much an ETF charges its investors for managing the fund. It is expressed as a percentage of the fund’s assets per year.
The expense ratio is one of the most important factors to consider when choosing an ETF because it directly affects your returns over time. The lower the expense ratio, the more money you get to keep from your investment.
As of 1/15/2024 VGK has an expense ratio of 0.11%, while VUG has an expense ratio of 0.04%.
VGK vs. VUG Holdings
A fund’s holdings are the basket of individual securities that it owns and tracks. It is crucial for investors to analyze a fund’s holdings because they are effectively what you are investing in by purchasing the fund.
As of 1/15/2024 VGK holds 1308 securities, while VUG holds 221.
ETF Comparison Tool
I created an ETF comparison tool you can use with the chart below. Simply search for multiple ETFs or mutual funds to easily compare the key metrics of over 2,000 funds.
Mutual Funds vs. ETFs
When comparing investment funds, you may be confused about the difference between an ETF and a mutual fund. Keep in mind, an index fund is a specific type of mutual fund. ETFs are tradeable during the stock market hours, while mutual funds only update once per day.
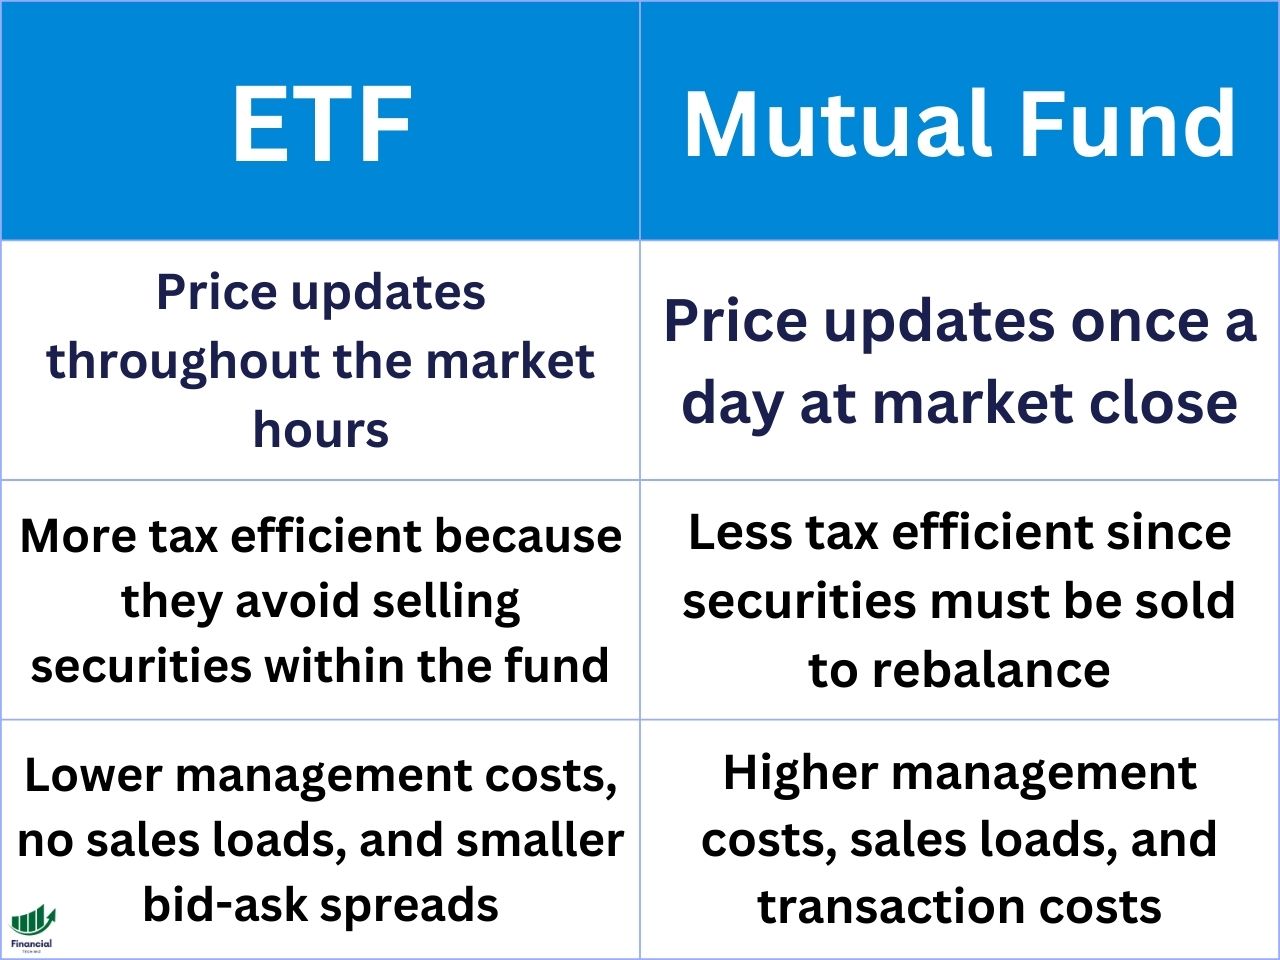
Mutual funds are pooled investment vehicles that are managed by a fund company or an investment advisor. They issue and redeem shares directly to investors at the end of each trading day based on their net asset value (NAV). Investors can buy and sell mutual fund shares through the fund company or a broker.
ETFs are also pooled investment vehicles that are managed by a fund company or an investment advisor. However, they trade like stocks on an exchange throughout the trading day at market prices that may differ from their NAV. Investors can buy and sell ETF shares through a broker.
Some of the advantages and disadvantages of mutual funds vs ETFs are:
- Mutual funds may offer more convenience and flexibility for investors who want to invest a fixed amount of money or set up automatic investments or withdrawals.
- Mutual funds may require a larger minimum investment.
- ETFs may incur bid-ask spreads and premiums or discounts to their NAV, which can affect their trading efficiency and performance.
- Mutual funds may be less tax-efficient than ETFs, as they may distribute more capital gains to their shareholders due to their redemption mechanism.
- ETFs may be more tax-efficient than mutual funds, as they may avoid realizing capital gains through their creation and redemption mechanism.
VGK vs. VUG - Bottom Line
Ultimately, both VGK and VUG are solid investment choices. The choice between the two ultimately depends on the exposure you want and the amount of risk you are willing to take.
Hopefully, the information in this article helps you decide which is better for your portfolio. To continue your research, check out our other fund comparison articles as well!
Comparing ETFs With TradingView
When comparing ETFs, it is crucial that you are comparing the total return to include dividend payments. TradingView allows you to compare several stocks and ETFs at once on a single chart adjusted for dividends.
You can simply sign up for a free TradingView account and type the stock ticker you want to compare.
TradingView Limited Time Offer!
Exclusive Deal: 30-Day FREE Premium Access + Bonus Credit
Don't Miss Out - Sign up for TradingView Now!
- Advanced Charts
- Real-Time Data
- Track all Markets
Next, click the plus sign next to the ticker at the top left of the chart to add symbols to compare.
Finally, ensure you click the ‘ADJ’ at the bottom to adjust the returns for dividends!
As you can see in the TradingView chart below, you can compare multiple funds and ETFs on a single chart, making your research much easier. Feel free to compare any ETFs you'd like using the widget. Alternatively, sign up for a free TradingView account and use the main website for a better experience.
Other ETF Comparisons
VOO vs VTV
VTV vs VWO
ITOT vs VIMAX
SCHB vs VXUS
FZROX vs VXF