Free Trading Journal Template for Google Sheets and Excel
Get instant access to the Financial Tech Wiz free trading journal template for Google Sheets and Excel. Log every trade, measure your real win rate and edge, and benchmark your portfolio performance against the S&P 500 automatically. Works for stocks, options, crypto, forex, and futures. Used by 1,300+ active traders. Sign up below for free instant access.
Get Your Free Trading Resources
Grab the free trading journal template plus the same tools we use to stay organized, consistent, and objective.
- Free trading journal template
- Custom indicators, watchlists, and scanners
- Access our free trading community
Enter your email below to get instant access.
No spam. Unsubscribe anytime.
What’s Inside the Free Trading Journal
Everything you need to measure your edge and stop trading blind.
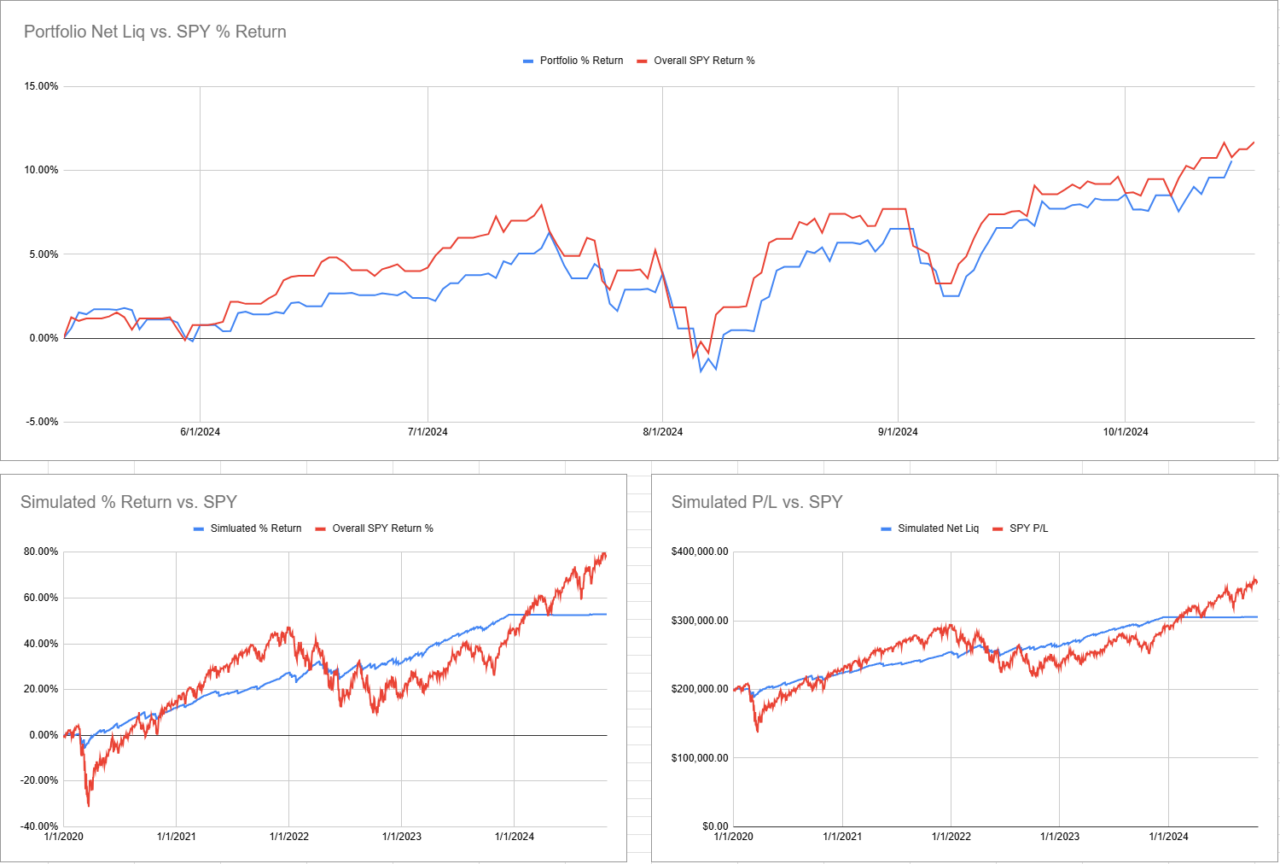
Benchmark Performance Charts
Automatically compare your portfolio returns against the S&P 500 or any benchmark. Know whether you are generating real alpha or just riding the market.
Win Rate and Trade Metrics
Win rate, average win and loss, reward-to-risk ratio, average holding period, and more, all calculated automatically as you log trades.
All Asset Classes
Stocks, options, crypto, forex, and futures. Log any trade in any market from a single spreadsheet.
Fully Customizable
Every formula is editable. Add columns, build new calculations, or restructure it around your specific strategy and risk management rules.
Google Sheets and Excel
Use it on any device. Access your journal from any browser or desktop without installing software.
The Spreadsheet Gets You Started. The App Takes It Further.
When you are ready to go beyond manual tracking, the Financial Tech Wiz Trading Journal adds automation, AI analysis, and live risk data that no spreadsheet can replicate. See how the full app works.
AI Daily Insights
One button generates a personalized performance update based on all your closed trades. No manual review needed.
AI Trading Coach
Chat with an AI that has full access to your trade history. Ask about win rate, risk habits, or what went wrong in a specific trade.
Live Risk Tracking
Your total portfolio risk from all active stop losses is calculated in real time. Always know your max loss before a position moves.
Deep Analytics
Performance broken down by ticker, setup, session, and more. Know exactly where your edge is strongest and where it leaks.
Trading Calendar
Your P&L across every day, week, and month at a glance. Spot patterns in your best and worst periods and drill into what drove them.
Works on Mobile
Log trades, check stats, and read AI insights from your phone. No spreadsheet fighting, no desktop required.
Start Free Trial
Your free Sheets journal imports directly into the app. No re-entry required.
“Financial Tech Wiz is a great swing-trade focused community. Community members are knowledgeable and always willing to help. I would highly recommend anyone from beginner to intermediate to check it out.”Beadsta · Verified Whop Review, March 2025 · ★★★★★
How It Works
Get your free template in three steps.
Enter Your Email Above
Sign up and receive the free trading journal template and full resource pack by email immediately.
Start Logging Trades
Make a copy in Google Sheets or download for Excel. Log your first trade and let the template calculate the rest.
Try the App When Ready
Explore the Financial Tech Wiz Trading Journal free for 7 days. Your Sheets data imports directly, no re-entry.
Watch: How the Trading Journal Works
A quick walkthrough of the template, how to log trades, read the charts, and interpret your metrics.

Frequently Asked Questions
Common questions about the free template and the full app.
Is the trading journal template actually free?
Yes. The Financial Tech Wiz trading journal template for Google Sheets and Excel is completely free. Enter your email and you will receive instant access by email with no subscription required.
Does the trading journal template work in Excel and Google Sheets?
Yes. The template works in both Google Sheets and Microsoft Excel. You can make a copy in Google Sheets to use it in your browser on any device, or download the Excel version for desktop use.
What asset classes does the free trading journal support?
The free trading journal template supports stocks, options, crypto, forex, and futures. You can log trades for any asset class in a single spreadsheet.
What is the difference between the free template and the Financial Tech Wiz Trading Journal app?
The free template is a Google Sheets and Excel spreadsheet for manual trade logging with automatic performance charts and metrics. The Financial Tech Wiz Trading Journal is a full web app that adds AI daily insights, an AI trading coach, live risk tracking from active stop losses, automated analytics by ticker and setup, and a trading calendar. The app starts at $9.91 per month billed annually with a 7-day free trial. Your Sheets journal data imports directly into the app.
Can I import my spreadsheet data into the Financial Tech Wiz Trading Journal app?
Yes. If you use the free Financial Tech Wiz Google Sheets trading journal, you can bulk import your trade history directly into the app so you are not starting from scratch.
Ready to Know What’s Actually Working in Your Trading?
Start with the free spreadsheet. Upgrade to AI-powered analytics when you are ready.
7-day free trial · No obligation · Free spreadsheet always available
The trading journal and all related tools are provided for educational purposes only and are not intended as financial advice. Always conduct your own research and make your own trading decisions.
How to Use This Free Trading Journal Template
Getting started takes about five minutes. Here is the exact setup sequence I recommend.
Step 1: Make a copy for yourself
After signing up, you will receive a link to the Google Sheets version and an Excel download. In Google Sheets, go to File > Make a copy. Rename it with your name and the starting month so you always know which version is current. The original is view-only, so every trader gets their own clean copy.
Step 2: Enter your account details at the top
The template has a small account settings area at the top of the sheet. Fill in your starting account balance. This is what the performance benchmarking calculations use to measure your returns against the S&P 500. If you trade multiple accounts, make a separate copy for each one.
Step 3: Log your first trade
Every trade gets one row. Work left to right: date, ticker or symbol, setup type, entry price, exit price, position size, and result. The template automatically calculates your P&L, R-multiple, and running win rate as soon as you fill in those columns. No formulas needed.
Step 4: Add your notes in the Notes column
This is the column most traders skip, and it is the most valuable one. Write one sentence about why you took the trade and one sentence about what actually happened. After 30 or 40 trades, patterns start to show up. You will notice which setups you actually execute well and which ones you consistently lose money on despite thinking you should take them.
Step 5: Review your stats weekly
The template has a summary tab with win rate, average winner, average loser, and profit factor. Spend ten minutes on Sunday reviewing the past week before you look at anything else. That review habit is what separates traders who improve from traders who repeat the same mistakes.
What to Track in Your Trading Journal
A lot of traders ask which columns actually matter. Here is what to include and why each one earns its place.
Date and time
This gives you context. Over time, you may notice that your best trades happen in the first hour of the market open or that your Friday afternoon trades consistently underperform. You cannot see those patterns without timestamps.
Ticker and asset class
Stocks, options, futures, forex, and crypto all go in the same journal. Tag the asset class so you can filter later. Most traders discover early on that they have a strong edge in one or two specific markets and mediocre results everywhere else.
Setup type
Name your setups consistently. “Breakout above resistance,” “VWAP reclaim,” “oversold bounce,” or whatever you actually trade. Use the same label every time. After 50 trades, you can filter the sheet by setup type and see your win rate and average R for each one. That is the most actionable data in the entire journal.
For a complete list of named setups to standardize your entries, see the chart patterns guide.
Entry price, exit price, and position size
These three columns calculate everything else. The template uses them to compute gross P&L, R-multiple, and return on the position automatically.
R-multiple
This is the ratio of what you won or lost relative to what you risked. A 1R trade means you made exactly your initial risk amount. A 3R trade means you made three times your risk. Tracking R-multiples removes the distorting effect of different position sizes and lets you see your true expectancy across all trades.
Result and running P&L
The template keeps a running P&L total and plots it as an equity curve on the summary tab. The shape of that curve tells you more than the final number. A smooth curve that climbs steadily indicates consistency. A volatile curve with big swings indicates size or risk-management problems regardless of whether the final P&L is positive.
Notes
One sentence per trade, written right after you close it. What was the setup? Did it execute as planned? If it was a loser, where did the thesis break down? Notes are the bridge between raw data and actual learning.
Free Trading Journal Spreadsheet vs. a Dedicated App
This template is the right starting point for most traders. It costs nothing, runs in Google Sheets or Excel, and covers the core tracking needs. But it has limitations worth knowing before you build a habit around it.
A spreadsheet requires manual entry for every trade. If you make five to ten trades a day, that is fifteen to thirty minutes of data entry in the evening. Many traders skip it when they are tired, and a journal that doesn’t get filled in doesn’t help anyone.
Spreadsheets also don’t connect to your brokerage. There is no automatic import, no live P&L sync, and no way to pull trade data from your broker without manual effort. If you have months of trade history to review, a spreadsheet makes that slow.
If you are trading actively, using options strategies, or managing multiple accounts, you will eventually hit the ceiling of what a spreadsheet can do. That is when a dedicated tool makes sense. For more context on how the options compare, see the best trading journals guide.
Ready to Go Further
Financial Tech Wiz Trading Journal
Connect your brokerage, import your full trade history automatically, and get AI-powered insights on your edge, win rate, and P&L. Built for active stock, options, and futures traders. $19/month or $9.91/month billed annually.
Try the Financial Tech Wiz JournalAlso see: if you trade options specifically, the free options trading journal template covers options-specific columns including expiration date, contract count, and premium.
FAQ
What is included in the free trading journal template?
The template includes a trade log tab with columns for date, ticker, setup, entry price, exit price, position size, P&L, R-multiple, and notes. A summary tab automatically calculates your win rate, average winner, average loser, profit factor, and a running equity curve. Both Google Sheets and Excel versions are included when you sign up.
Does the free template work for options trades?
Yes. You can log any asset class including options, stocks, futures, forex, and crypto. For options-specific tracking with columns for expiration date, contract count, and net premium, see the free options trading journal template, which is a separate download designed specifically for options traders.
How is this different from a paid trading journal app?
The free template requires manual trade entry and runs offline in Google Sheets or Excel. A paid journal app like the Financial Tech Wiz Trading Journal connects to your broker, imports trades automatically, and adds AI performance analysis. The template is the right starting point for most traders. If you want automatic imports and deeper analytics, the app handles that.
What does R-multiple mean and why does it matter?
R-multiple is the ratio of what you made or lost to what you initially risked on the trade. A 1R result means you made back your risk. A 2R means you made twice your risk. Tracking R-multiples standardizes your results across trades of different sizes so you can calculate your true expectancy, which is the single most actionable metric for knowing whether your edge is real.
Can I use this template to calculate my profit factor?
Yes. The summary tab automatically calculates your profit factor, which is the ratio of total gross winnings to total gross losses. A profit factor above 1.5 is generally considered a healthy edge. The template also plots your equity curve so you can see the smoothness of your returns over time, not just the final number.