
Financial Tech Wiz Trading Journal: The Complete Setup and Analytics Guide

The Financial Tech Wiz Trading Journal turns the trades you already place into a clear picture of what is working and what is quietly costing you. This guide walks through every part of the app, from your first net liquidity entry to the AI insights that read your closed trades back to you. By the end you will know exactly how to log, import, and analyze your trading in one place.
Key Takeaways
- Set your starting net liquidity first, then log it daily so your equity curve and calendar stay accurate.
- Import trades automatically from 25+ brokers through SnapTrade, or log them manually with notes and tags you can search later in the Trades tab.
- Use the Analytics and Statistics tabs to see win rate and P&L across your positions, broken down by symbol and hold duration, with daily AI insights layered on top.
Track your trades
The Financial Tech Wiz Trading Journal
A structured performance tracker for serious traders: daily net liquidity, automatic import from 25+ brokers, and AI insights on every closed trade. $19/month, or $9.91/month billed annually.
Open the Trading Journal
What Makes the Financial Tech Wiz Trading Journal Different
Most journals only record closed trades. The Financial Tech Wiz Trading Journal also tracks your daily net liquidity, so you watch your whole account move, not just the trades you remember to log. That single difference is what turns a trade log into a real equity curve and a performance calendar.
Three things set it apart for active traders. First, automatic import: connect any of 25+ brokers through SnapTrade and pull your full trade history by date range, then keep logging manually for anything you trade off-platform. Second, the AI layer: Daily AI Insights summarize what your recent trades are telling you, and the AI Trading Coach answers questions about your own history. Third, the analytics depth: win rate and P&L across your positions, broken down by symbol and hold duration, plus the risk and efficiency metrics most spreadsheets never calculate.
It is built as a structured performance tool for serious traders, not a beginner spreadsheet. If you are not ready for the paid app yet, the free trading journal template is the accessible starting point, and you can compare the app against the field in our best trading journals roundup.
Getting Started: Initial Setup
Entering Your Starting Net Liquidity
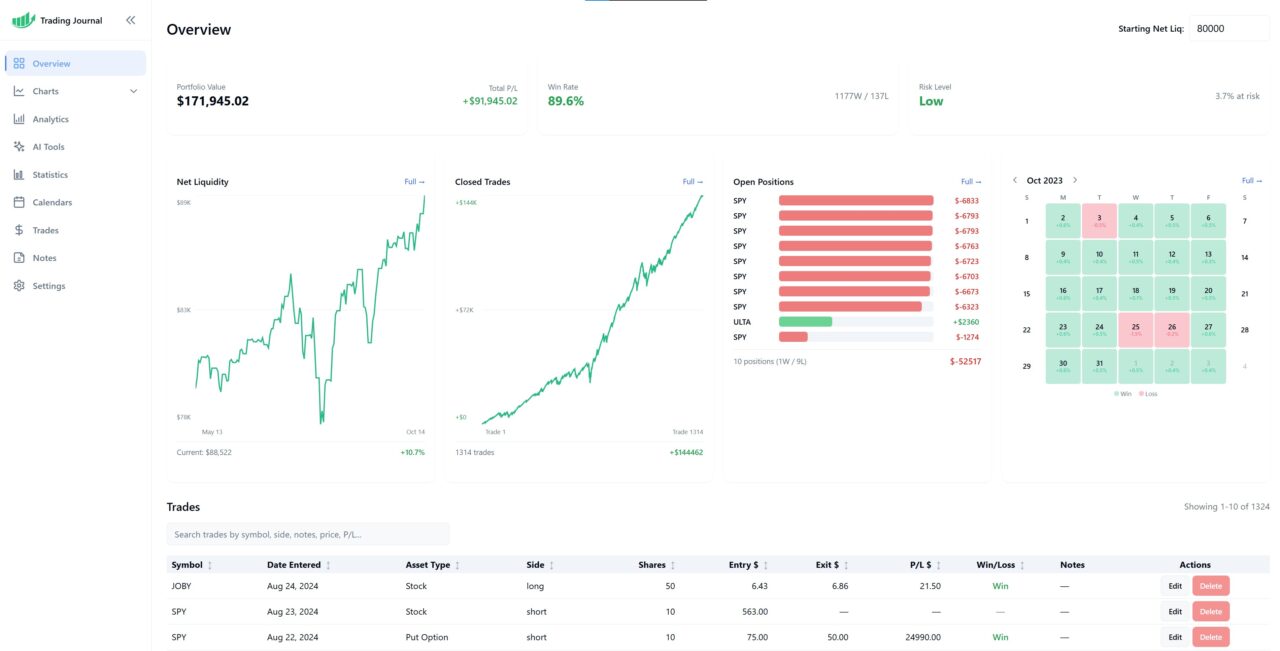
The first and most important step is entering your Starting Net Liquidity.
You will find the Starting Net Liquidity input box on the Overview tab. This value should reflect your total portfolio value on the day you decide to begin logging trades inside the journal.
This number represents Day One of your journal. It is the baseline that powers many of the journal’s calculations and charts.
Your starting net liquidity is used for:
- Closed trades P/L charts
- Open P/L percentage calculations
- Allocation percentage metrics
- Stop loss risk percentage calculations
Because this value feeds directly into performance metrics across the app, accuracy is critical. An incorrect starting value will cause downstream metrics to be distorted, including allocation percentages, risk exposure, and portfolio performance calculations.
Logging Daily Portfolio Value (Net Liquidity)
Daily Net Liquidity Tracking
Once your starting net liquidity is set, the next step is logging your daily net liquidity.
Daily net liquidity is entered under the Portfolio Performance tab. For each trading day, simply:
- Select the date
- Enter your total portfolio value for that day
Tracking daily net liquidity allows you to see how your portfolio performs on a marked-to-market basis, not just based on closed trades.
This enables:
- Mark-to-market performance tracking
- Portfolio performance comparisons against benchmarks such as the S&P 500
- Accurate total return calculations
This step is essential for traders who want to understand true account performance instead of relying solely on closed trade results.
Matching Day One Values
Your first daily net liquidity entry must match your Starting Net Liquidity.
This establishes the correct performance baseline and tells the journal exactly when trade logging began. If these values do not match, calculations throughout the app can become inaccurate.
Skipping this step or entering mismatched values can cause portfolio charts, return calculations, and benchmark comparisons to break or display misleading data.
Bulk Importing Net Liquidity Data
For traders transitioning from the Financial Tech Wiz Google Sheets Trading Journal, daily net liquidity can be imported in bulk.
To do this:
- Copy Column A for Net Liquidity
- Copy Column B for Date
- Use the Bulk Import button inside the Portfolio Performance page
This allows you to move historical portfolio data into the app quickly without manual re-entry.
Logging Trades in the Trading Journal
Accessing the Trades Page
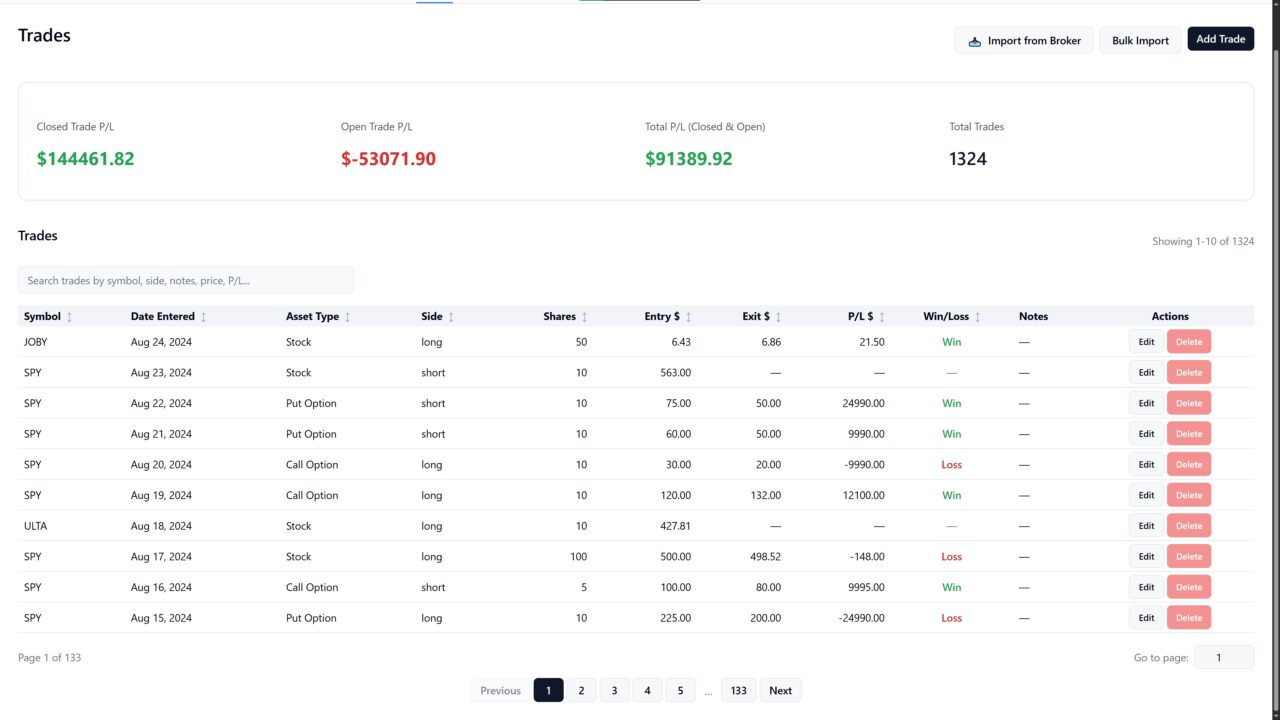
All trade entries are handled inside the Trades page, which can be found in the left-hand sidebar. This page controls the logging, editing, and tracking of every trade in your journal.
Trade Entry Fields Explained
When entering a trade, you can input:
- Symbol
- Date entered
- Time entered (in 24 hour format)
- Time exited (in 24 hour format)
- Date exited, or leave blank if the trade is still open
- Long or short position
- Number of shares or quantity for other asset types
- Entry price
- Exit price if the trade is closed
- Fees if applicable
- Notes
The notes field is highly recommended. It can be used to tag strategies, record trade rationale, or add post-trade reflections.
In addition to trade-specific notes, there is also a separate Notes page where you can store general notes and screenshots for future reference.
Using the Notes Field Effectively
Consistently using notes helps with:
- Organizing trades by strategy
- Reviewing performance later
- Identifying patterns in behavior and execution
Over time, notes become one of the most valuable tools for improving decision-making and can be used to filter specific trades from the search bar in the trades page.
Bulk Importing Trades
For traders switching from the free Financial Tech Wiz Google Sheets Trading Journal, trades can be imported in bulk.
To do this:
- Copy Cells A3 to X3 and all rows below for all of your trades from the Trade Log tab in the Sheets journal
- Paste directly into the bulk import feature inside the trading journal app
This allows for a seamless transition without losing historical trade data.
Internal Resource Reference
There is a dedicated blog post that explains trade logging in greater detail here.
Viewing Performance Charts
Portfolio Performance Charts
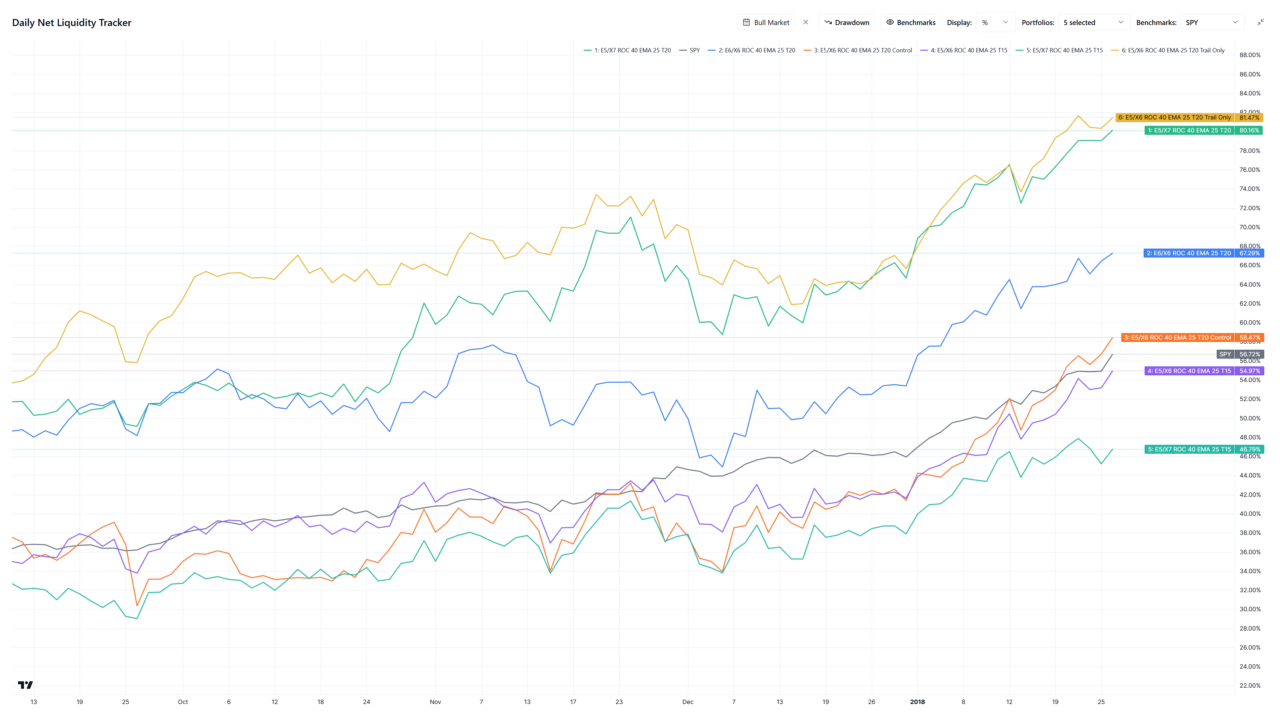
Under the portfolio performance tab, you can view portfolio performance based on daily net liquidity. This shows how your account value changes over time and allows comparison against benchmarks such as the S&P 500, and as many portfolios as you want. You can create several accounts to compare different strategies, and its also great for comparing backtests here. You can import backtests and portfolios from several different brokers, or use the Financial Tech Wiz MCP server to import them for you.
This view reflects true marked-to-market portfolio performance and requires you to input your portfolio balance each day, or export it from your broker as a CSV to import.
Closed Trades Performance Charts
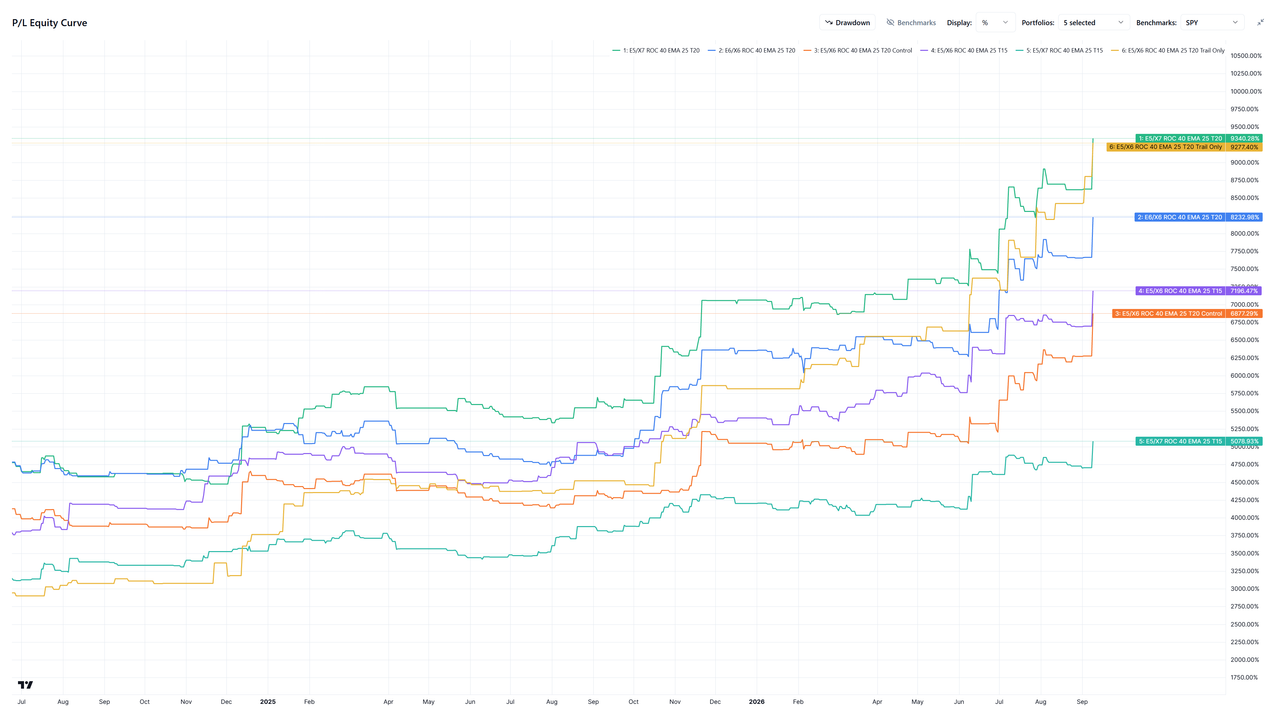
Closed trades performance charts display results from completed trades only. These charts use line visualizations and can also be compared against a benchmark to evaluate strategy effectiveness over time.
Open Trades Performance Charts
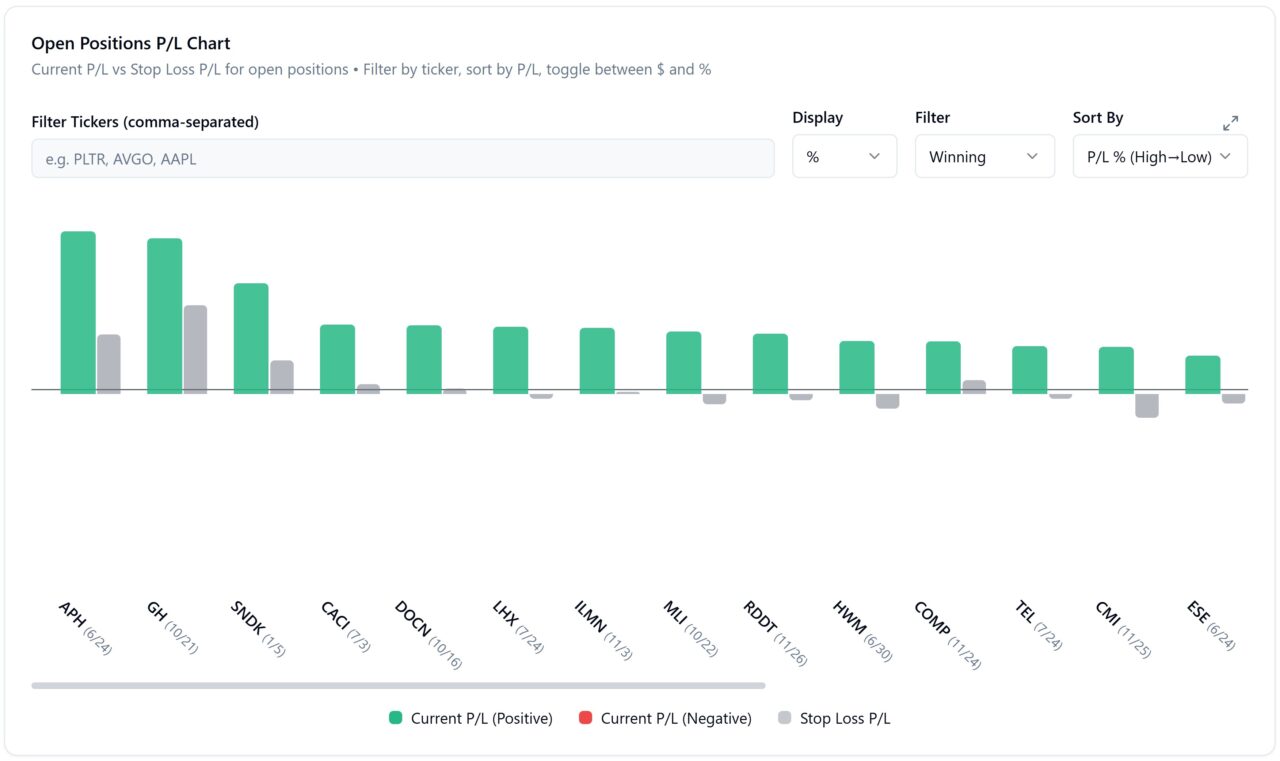
Open trades charts pull live stock data to show:
- Real-time open P/L
- How far each trade is from entry
- Stop loss risk levels if a stop loss was entered
An open positions chart displays both P/L and stop loss exposure, while a separate line chart shows closed trade performance compared to a benchmark.
Analyzing Trades and Performance
Analysis via the Charts Tab
Trades can be analyzed visually through:
This gives a high-level view of how capital and strategies are performing.
Analytics Page Breakdown
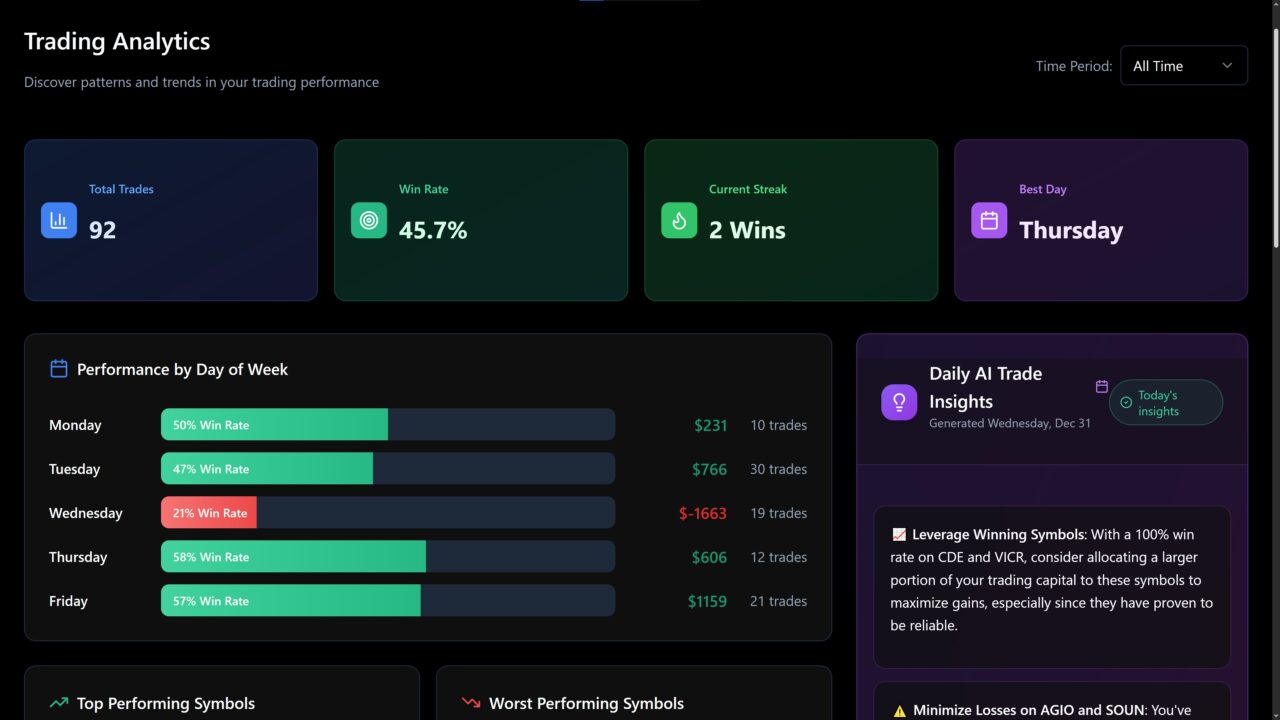
The Analytics page allows deeper performance analysis, including:
- Performance by day of week
- Top-performing symbols
- Worst-performing symbols
- Performance by trade duration
- Monthly performance breakdown
- Performance by asset type such as stocks, options, and crypto
These insights help identify strengths, weaknesses, and patterns across different dimensions of trading behavior.
AI-Powered Tools
Daily AI Insights
The AI Tools page provides daily AI insights based on closed trade performance. These insights summarize what is happening in your trading and highlight trends worth paying attention to.
AI Trading Coach

The AI Trading Coach is a chat-based assistant with access to all of your trade data.
You can ask questions such as:
- Which symbols are performing best
- How win rate can be improved
- What patterns exist in losing trades
This tool supports trade review, self-analysis, and continuous improvement using your actual data.
Not ready for the app?
Start with the free trading journal template
A free Google Sheets journal to build the habit before you upgrade. Log trades, track your equity, and see your numbers in one place.
Get the free templateStatistics Tab Overview
The Statistics tab provides a complete numerical breakdown of trading performance.
Core Performance Metrics
- Closed trade P/L
- Open P/L
- Total P/L including open and closed trades
- Total fees paid
Trade Outcome Metrics
- Win rate
- Number of winning trades
- Number of losing trades
- Total trades taken
- Average win in dollars and percentage
- Average loss in dollars and percentage
Risk and Efficiency Metrics
- Profit factor
- Reward-to-risk ratio
- Total stop loss risk in dollars and percentage
- Total P/L if all stop losses were hit
Position and Allocation Metrics
- Number of long trades
- Number of short trades
- Average days in trade
- Total dollar amount allocated
- Percentage of portfolio allocated to open positions
Calendar Views
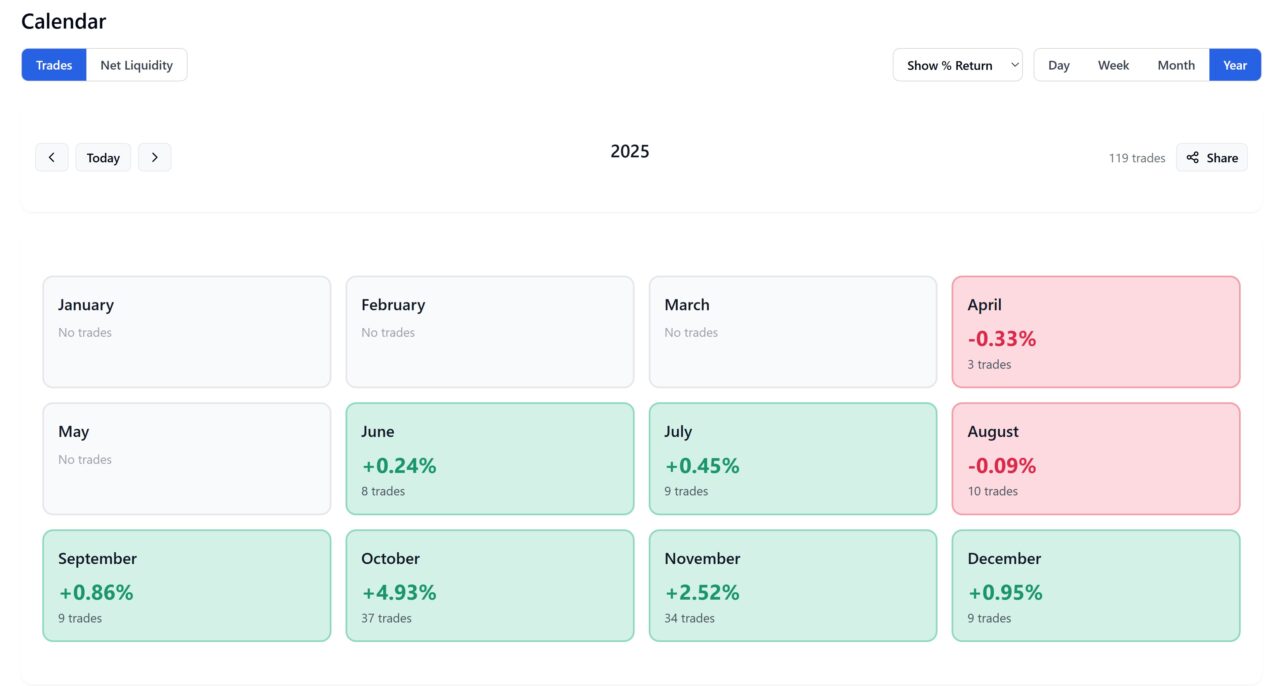
Trades Performance Calendar
The Trades calendar displays daily, weekly, monthly, and yearly views based on actual trades. It shows open and closed trades but is not marked to market.
This view is ideal for reviewing trading activity by date.
Net Liquidity Calendar
The Net Liquidity calendar is based on daily portfolio value and reflects true account performance. This is the most accurate measure of how much your trading is actually making or losing over time.
Sharing Performance
For both portfolio and trade performance, you can click the share button on any:
- Day
- Week
- Month
- Year
This generates a shareable social image for performance over that timeframe.
Overview Dashboard
Purpose of the Overview Page
The Overview tab serves as a central dashboard that combines all major data points into a single view.
What the Overview Includes
The Overview page shows:
- Portfolio value based on starting net liquidity plus total P/L
- Win rate
- Stop loss risk exposure
- Portfolio performance chart
- Closed trade performance chart
- Real-time open positions
- Mini performance calendar
- Trades table
This dashboard is designed for quickly checking overall performance at a glance.
Notes Tab
The Notes page allows you to:
- Attach screenshots
- Select a note category such as general, strategy, trade ideas, market analysis, lessons learned, or watchlist
- Write and store notes for future reference
This feature helps organize qualitative insights alongside quantitative data.
Settings Page
Data Management
Inside the Settings page, you can:
- Wipe all net liquidity data
- Wipe all trades data
This is useful when resetting the journal or starting a new tracking period.
Display Preferences
You can also switch between light mode and dark mode to match your preferred viewing experience.
FAQ
Is the Financial Tech Wiz Trading Journal free?
No. It is a paid app at $19 per month, or $9.91 per month billed annually. If you want to start for free, the free trading journal template is a Google Sheets version you can use before upgrading.
Which brokers can I import trades from?
You can import from 25+ brokers through SnapTrade. During import you pick the date range, so you can pull your full history, not just trades going forward. Anything you trade off a connected broker, you log manually.
Does it work for options traders?
Yes. You get win rate and P&L across your options positions, broken down by symbol and hold duration. Multi-leg spreads imported through SnapTrade come in as individual contracts, so for structures like iron condors it is cleanest to log the spread manually with the total credit or debit and a tag. The free trading journal for options is a good companion if you want a template first.
Can I track my account value, not just individual trades?
Yes. Logging your daily net liquidity builds an equity curve and a net liquidity calendar, so you see how your whole account moves over time, not only your closed trades.
How is it different from a spreadsheet?
Automatic broker import, AI insights on your own trades, and built-in analytics you would have to build by hand in a sheet. See how it compares to other tools in our best trading journals guide.
Closing Section
The Financial Tech Wiz Trading Journal App is built around a simple but powerful workflow:
- Set your starting net liquidity
- Track daily portfolio value
- Log every trade
- Analyze performance using charts, analytics, statistics, and AI insights
Consistency and accuracy are what unlock the real value of a trading journal. When used correctly, the Financial Tech Wiz Trading Journal gives you a clear, data-driven view of your trading and helps you make better decisions over time.
If you are ready to take control of your trading performance, the next step is to sign up and start logging your trades inside the Financial Tech Wiz Trading Journal.
Get Your Free Trading Resources
Grab the free trading journal template plus the same tools we use to stay organized, consistent, and objective.
- Free trading journal template
- Custom indicators, watchlists, and scanners
- Access our free trading community
Enter your email below to get instant access.
No spam. Unsubscribe anytime.







