Heikin-Ashi Candles: A Comprehensive Guide
Heikin-Ashi candlesticks have emerged as a go-to technical trading tool for traders around the globe. Designed to represent and visualize market price data, Heikin-Ashi candlesticks are known for their ability to filter out market noise and provide traders with a clear picture of market trends and direction.
In this article, we’ll take a deep dive into this fascinating technique, exploring its origins, calculations, and practical applications.
A Glimpse into the Heikin-Ashi Technique
The Heikin-Ashi technique hails from Japan and is a modified form of traditional candlestick charts. The term “Heikin-Ashi” is derived from the Japanese words “Heikin,” meaning “average,” and “Ashi,” meaning “bar.” As the name suggests, Heikin-Ashi candlesticks use average price data to create a smoothed chart, making it easier for traders to spot trends and reversals.
Decoding Heikin-Ashi Calculations
To create Heikin-Ashi candles, traders use a specific formula to calculate the modified open, high, low, and close (OHLC) values:
- HA-Close = (Open + High + Low + Close) / 4
- HA-Open = (HA-Open (previous) + HA-Close (previous)) / 2
- HA-High = Maximum of (High, HA-Open, HA-Close)
- HA-Low = Minimum of (Low, HA-Open, HA-Close)
These values are then used to generate Heikin-Ashi candlesticks that provide a clearer representation of market trends.
Identifying Market Trends with Precision
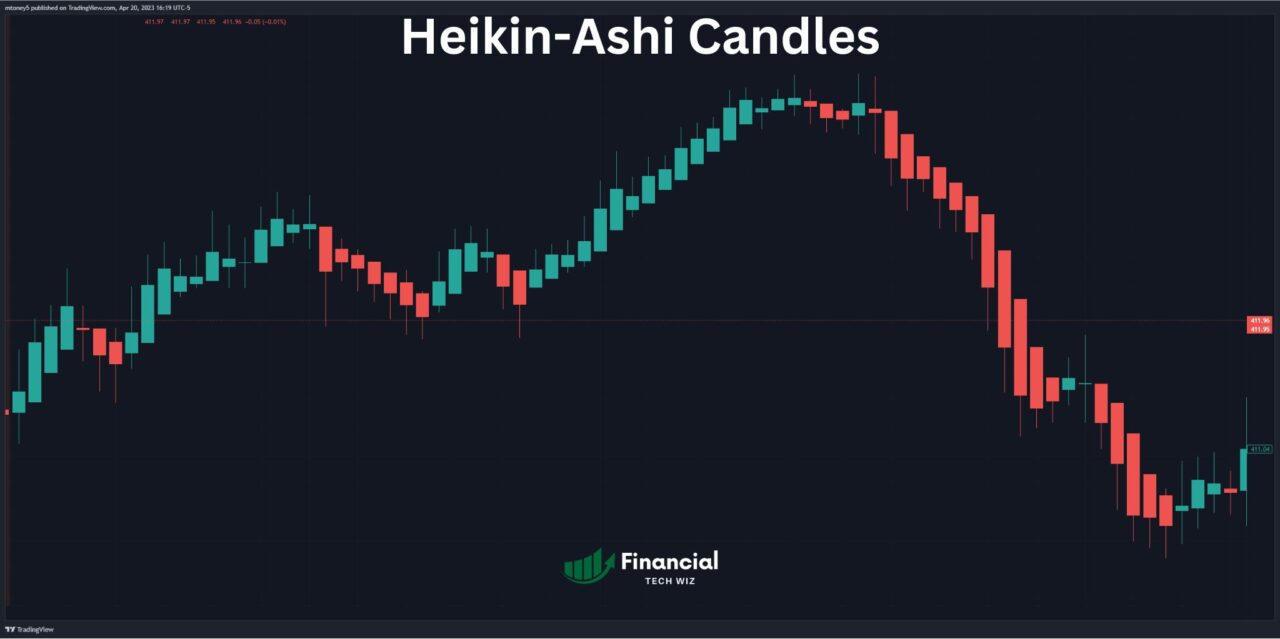
Heikin-Ashi charts simplify the task of identifying market trends. Traders can easily spot uptrends and downtrends by observing the color of the candlesticks:
- Uptrend: Characterized by consecutive green candlesticks.
- Downtrend: Characterized by consecutive red candlesticks.
The presence of multiple consecutive bars of the same color indicates a strong trend, allowing traders to make informed decisions.
Spotting Trend Reversals with Confidence
Heikin-Ashi charts also provide valuable signals for potential trend reversals. Key reversal signals include:
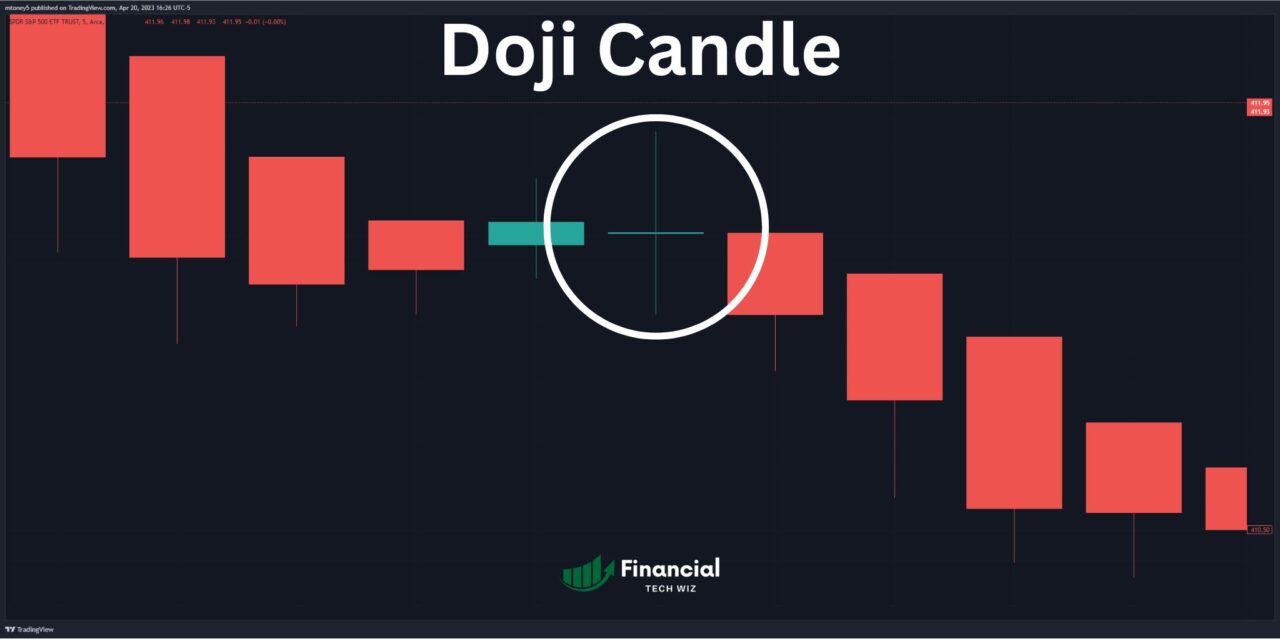
- Doji Candlestick: A candlestick with a small body and long shadows, signaling uncertainty and a possible trend reversal.
- Wedge Patterns: Rising and falling wedges can indicate trend reversals based on the direction of the breakout.
Traders should exercise caution when interpreting small-bodied candles, as they may signal a trend pause rather than a reversal.
Advantages and Drawbacks of the Heikin-Ashi Technique
Advantages
- Accessibility: Easily available on most trading platforms.
- High Chart Readability: Enables easy interpretation of market trends.
- Reliability: Provides accurate results using historical data.
- Noise Filtering: Filters out market noise for clearer trend identification.
Drawbacks
- Time Gap: Use of historical data may result in a delay in real-time trading signals.
Practical Tips for Mastering Heikin-Ashi
To maximize the potential of Heikin-Ashi in trading, consider the following tips:
- Combine Heikin-Ashi with other technical indicators for comprehensive analysis.
- Use a trailing stop to capitalize on a strong trend.
- Pay attention to candlestick color changes, as they may signal a trend reversal.
Explore the best TradingView indicators to enhance your trading strategies and take advantage of the discount and 30-day free trial on TradingView.

Final Thoughts
Heikin-Ashi candles have proven to be a powerful and versatile tool for traders seeking to navigate the dynamic world of financial markets. With their ability to filter out market noise and provide a clear depiction of market trends, Heikin-Ashi charts have become a staple in the toolbox of technical traders.
Whether you’re a seasoned professional or a budding enthusiast, incorporating Heikin-Ashi candlesticks into your trading strategy can enhance your decision-making process and boost your ability to capitalize on market movements. So, as you venture forth into the markets, remember to keep an eye out for those average bars and embrace the insights they have to offer.
This article contains affiliate links I may be compensated for if you click them.
Get Your Free Trading Resources
Grab the free trading journal template plus the same tools we use to stay organized, consistent, and objective.
- Free trading journal template
- Custom indicators, watchlists, and scanners
- Access our free trading community
Enter your email below to get instant access.
No spam. Unsubscribe anytime.


