If you are looking for a low-cost way to invest in the top 500 companies on the stock market, you might be interested in comparing VFIAX vs. VOO.
Overview of VFIAX vs. VOO
VFIAX and VOO are both index funds that aim to replicate the performance of the S&P 500 index. However, they differ in their structure and how they are traded.
VFIAX is a mutual fund, which means that it is a pool of money from many investors that is managed by a fund manager. You can buy or sell shares of VFIAX directly from Vanguard at the end of each trading day based on the net asset value (NAV) of the fund.
VOO is an exchange-traded fund (ETF), which means that it is a collection of securities that trade on an exchange like a stock. You can buy or sell shares of VOO throughout the day at any price that the market determines, which may be higher or lower than the NAV of the fund.
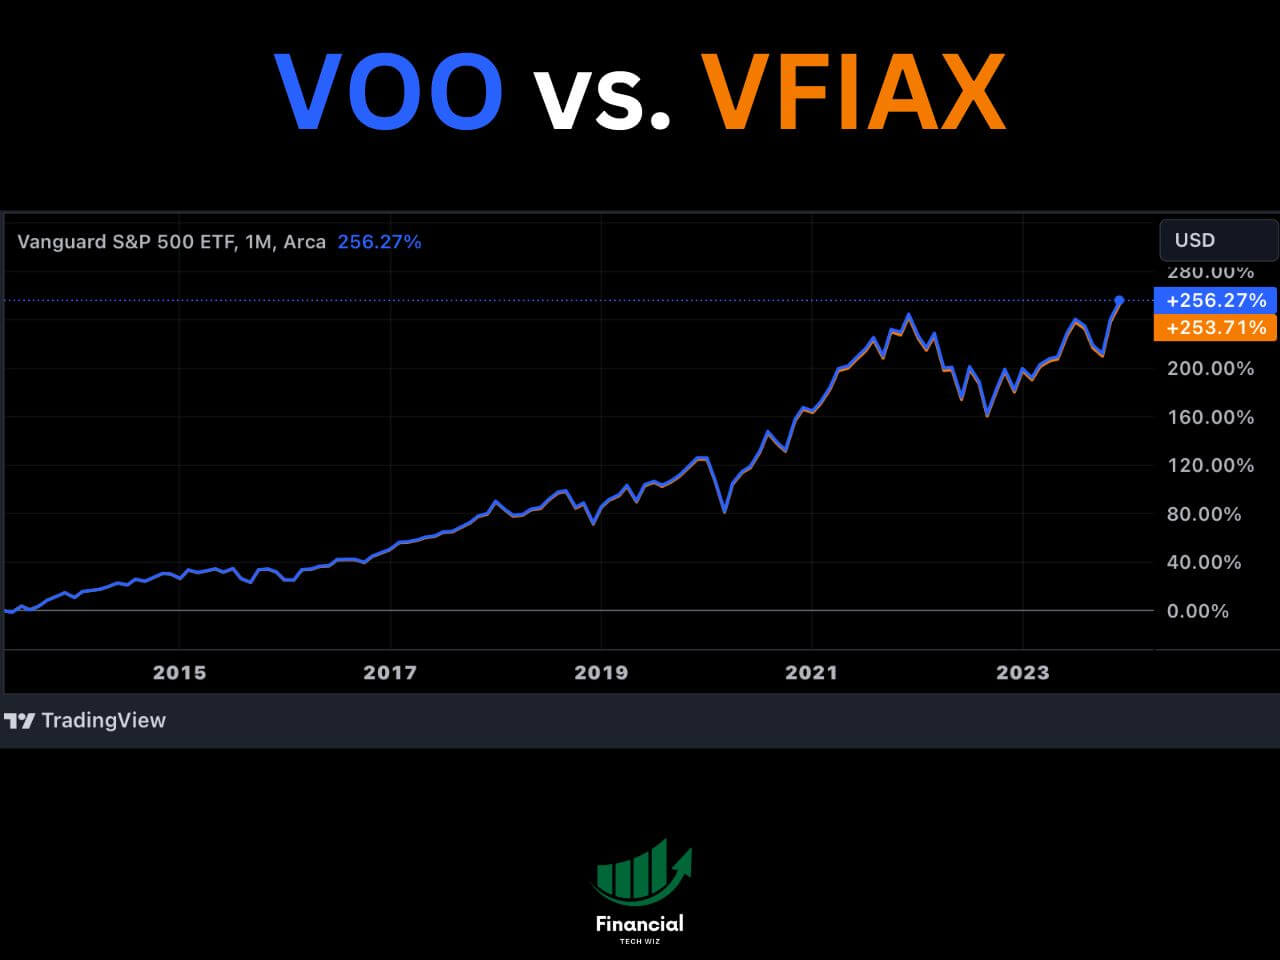
As you can see in the TradingView comparison chart above, VOO and VFIAX provide nearly the same exact total returns.
Comparing ETFs With TradingView
When comparing ETFs, it is crucial that you are comparing the total return to include dividend payments. TradingView allows you to compare several stocks and ETFs at once on a single chart adjusted for dividends.
You can simply sign up for a free TradingView account and type the stock ticker you want to compare. Next, click the plus sign next to the ticker at the top left of the chart to add symbols to compare.
Finally, ensure you click the ‘ADJ’ at the bottom to adjust the returns for dividends!
As you can see in the TradingView chart below, you can compare multiple funds and ETFs on a single chart, making your research much easier. Feel free to compare any ETFs you’d like using the widget.

VFIAX vs. VOO Dividend Yield Compared
The dividend yield of VFIAX and VOO are essentially identical, making it not a significant factor when comparing the two funds.
The dividend yield of VFIAX is 1.55%, while VOO is 1.56%.
Mutual Funds vs. ETFs Explained
VFIAX is a mutual fund, while VOO is an ETF. ETFs are more efficient investing vehicles for most investors due to their structure, taxation, and how they are traded.
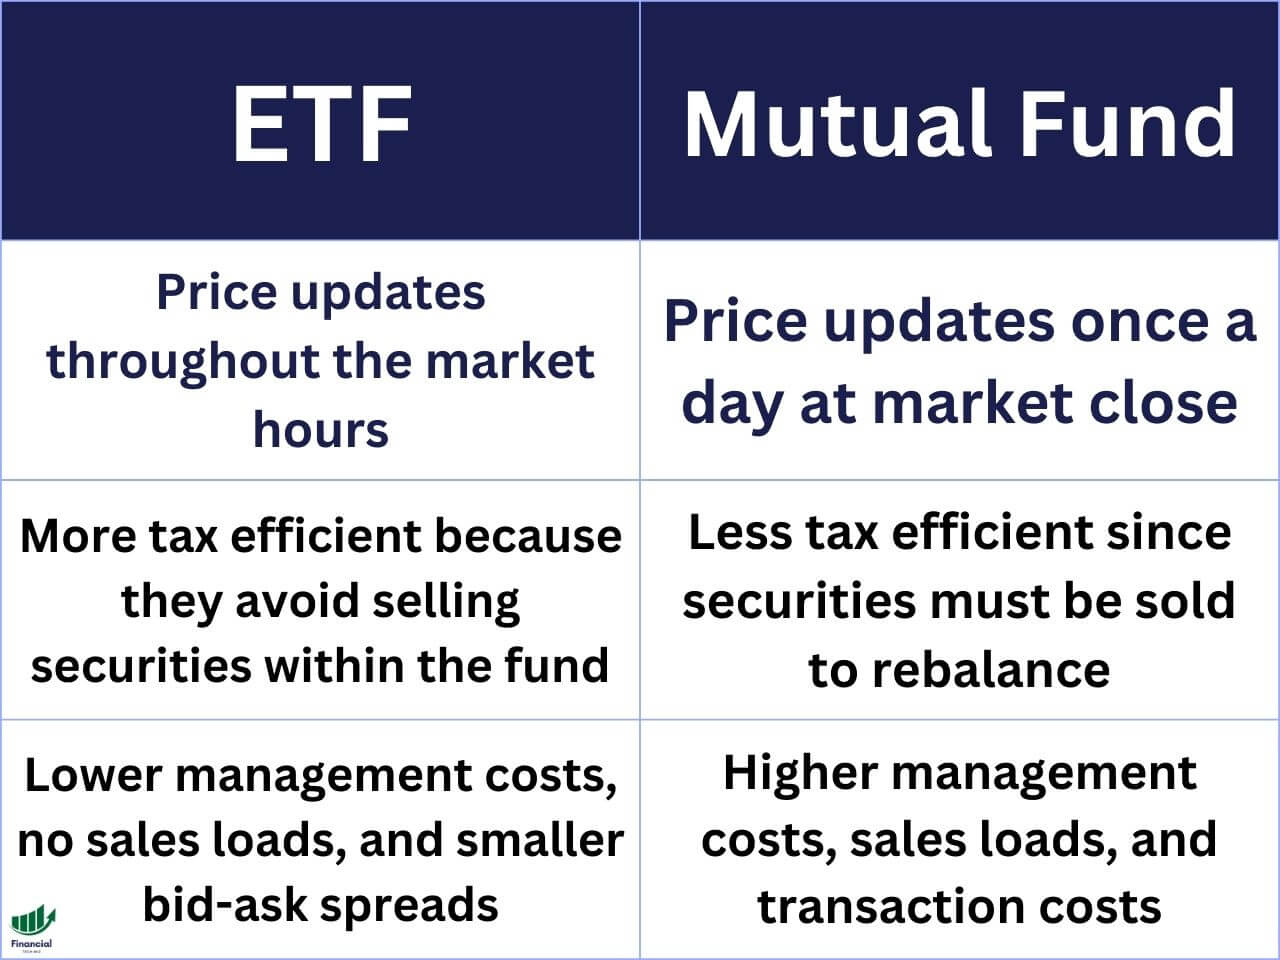
- Structure: ETFs are traded on stock exchanges like individual stocks, while mutual funds are bought and sold directly from the fund company or a broker. Mutual funds, on the other hand, have to sell securities to meet redemptions or rebalance the portfolio, which can result in taxable events for the shareholders.
- Taxation: ETFs are generally more tax-efficient than mutual funds, especially for investors who hold them in taxable accounts. Due to the structure mentioned in the first bullet, anytime an investor sells a mutual fund, the fund manager must sell securities, which triggers taxable events for the fund. However, both ETFs and mutual funds are subject to capital gains taxes when the investor sells the fund for a profit.
- Trading: ETFs can be bought and sold throughout the day at the market price, which may differ from the net asset value (NAV) of the fund. ETFs also have bid-ask spreads, which are the differences between the prices at which buyers and sellers are willing to trade. Mutual funds are only traded once a day at the end of the day, based on the NAV of the fund. Mutual funds do not have bid-ask spreads, but they may have sales loads, which are fees charged by the fund company or the broker for buying or selling the fund.
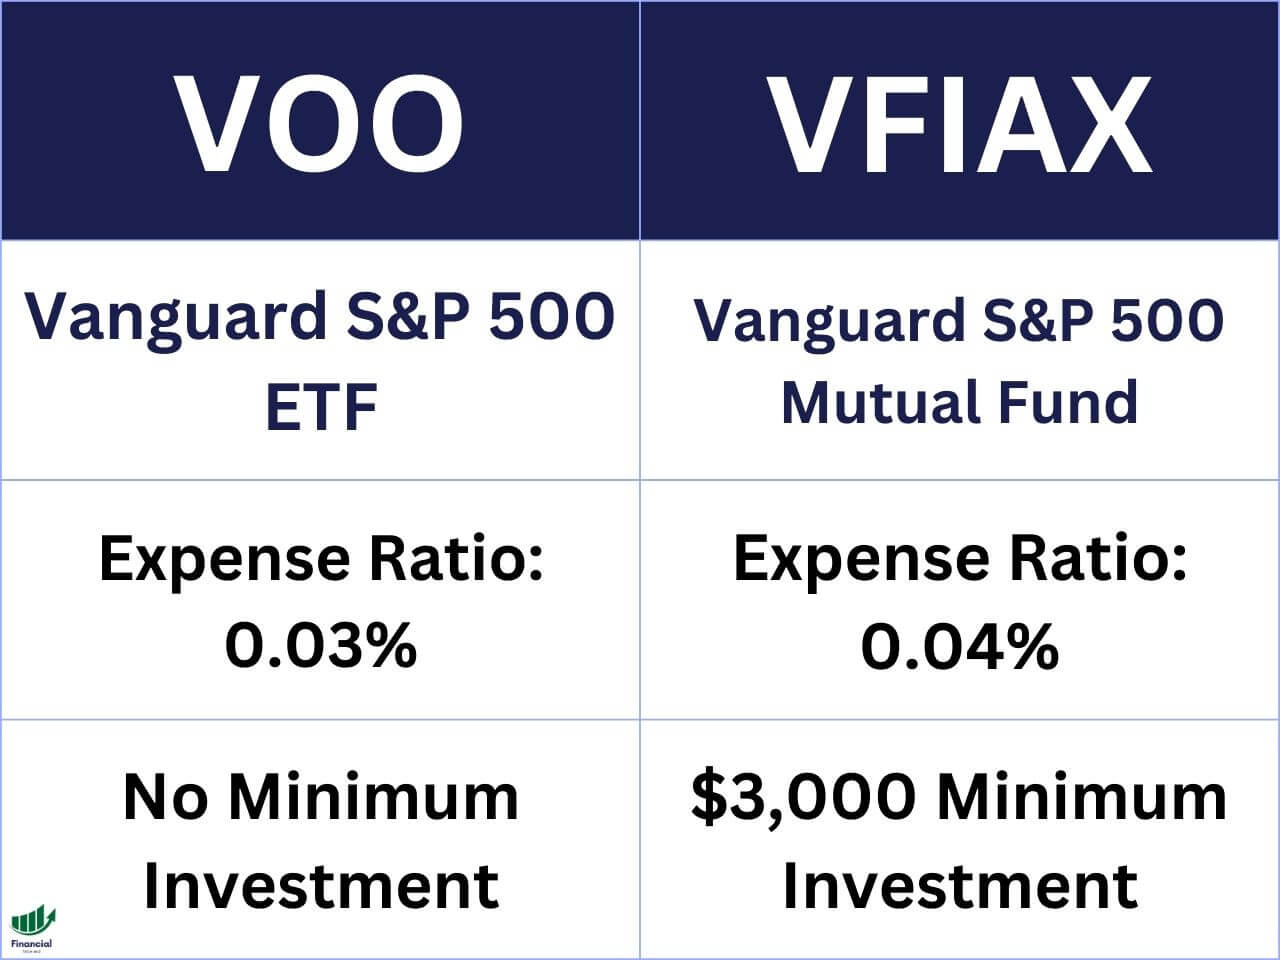
VFIAX vs. VOO Minimum Investment
One of the drawbacks of investing in VFIAX is that it has a minimum investment requirement of $3,000. This means that you need to have at least $3,000 to open an account with Vanguard and buy shares of VFIAX.
VOO, on the other hand, has no minimum investment requirement. This means that you can buy as many or as few shares of VOO as you want, depending on your budget and goals. If you use a broker that allows you to buy fractional shares, such as tastytrade, you can invest in VOO with just a few bucks!
VFIAX vs. VOO Expense Ratios
| Fund | Expense Ratio |
| VFIAX | 0.04% |
| VOO | 0.03% |
The expense ratio of VFIAX is 0.04%, while the expense ratio of VOO is 0.03%. This means that for every $10,000 you invest in VFIAX, you pay $4 in fees per year, while for every $10,000 you invest in VOO, you pay $3 in fees per year.
While this difference may seem small, it can add up over time and make a noticeable difference in your long-term returns.
VFIAX vs. VOO Holdings Comparison
The holdings of VFIAX and VOO are essentially identical since they both track the S&P 500 index.
However, this difference is negligible and does not affect the overall performance or risk of the funds.
VFIAX vs. VOO Returns Comparison
The returns of VFIAX and VOO have been nearly identical since both funds track the S&P 500 index, but VFIAX has a slightly higher expense ratio, making it cost more to invest in.
Therefore, the difference in returns between VFIAX and VOO is very small, but it favors VOO slightly due to its lower expense ratio.
VFIAX vs. VOO | This One is Better!
Based on our comparison of VFIAX vs. VOO, we can conclude that overall, VOO is the best option for most people as ETFs are more liquid, the expense ratio is lower, and there is no minimum investment.
VOO offers you the same exposure to the S&P 500 index as VFIAX but with more flexibility and lower costs. You can buy or sell shares of VOO anytime during the day, pay less in fees, and invest as much or as little as you want.
VFIAX may be a good option for some people who prefer mutual funds over ETFs, have at least $3,000 to invest, and don’t mind paying a slightly higher expense ratio. However, for most people, these advantages are not worth giving up the benefits of VOO.
The Financial Tech Wiz ETF Comparison Tool
You can use the ETF comparison tool below to compare over 2,000 ETFs and mutual funds with data I manually collected:
Other ETF Comparisons
If you enjoyed this article on VFIAX vs. VOO, you might also like to check out our other ETF comparisons, such as: