If you are looking for a low-cost way to invest in the US stock market, you might have come across two popular exchange-traded funds (ETFs) from Vanguard: VOO and VUG.
Both of these funds offer exposure to large-cap US companies, but they have different investment objectives and strategies.
In this article, we will compare VUG vs. VOO in terms of their dividend yield, expense ratio, total return performance, holdings, and more. By the end of this article, you should have a better idea of which fund is best suited for your portfolio and risk profile.
Overview of VUG and VOO
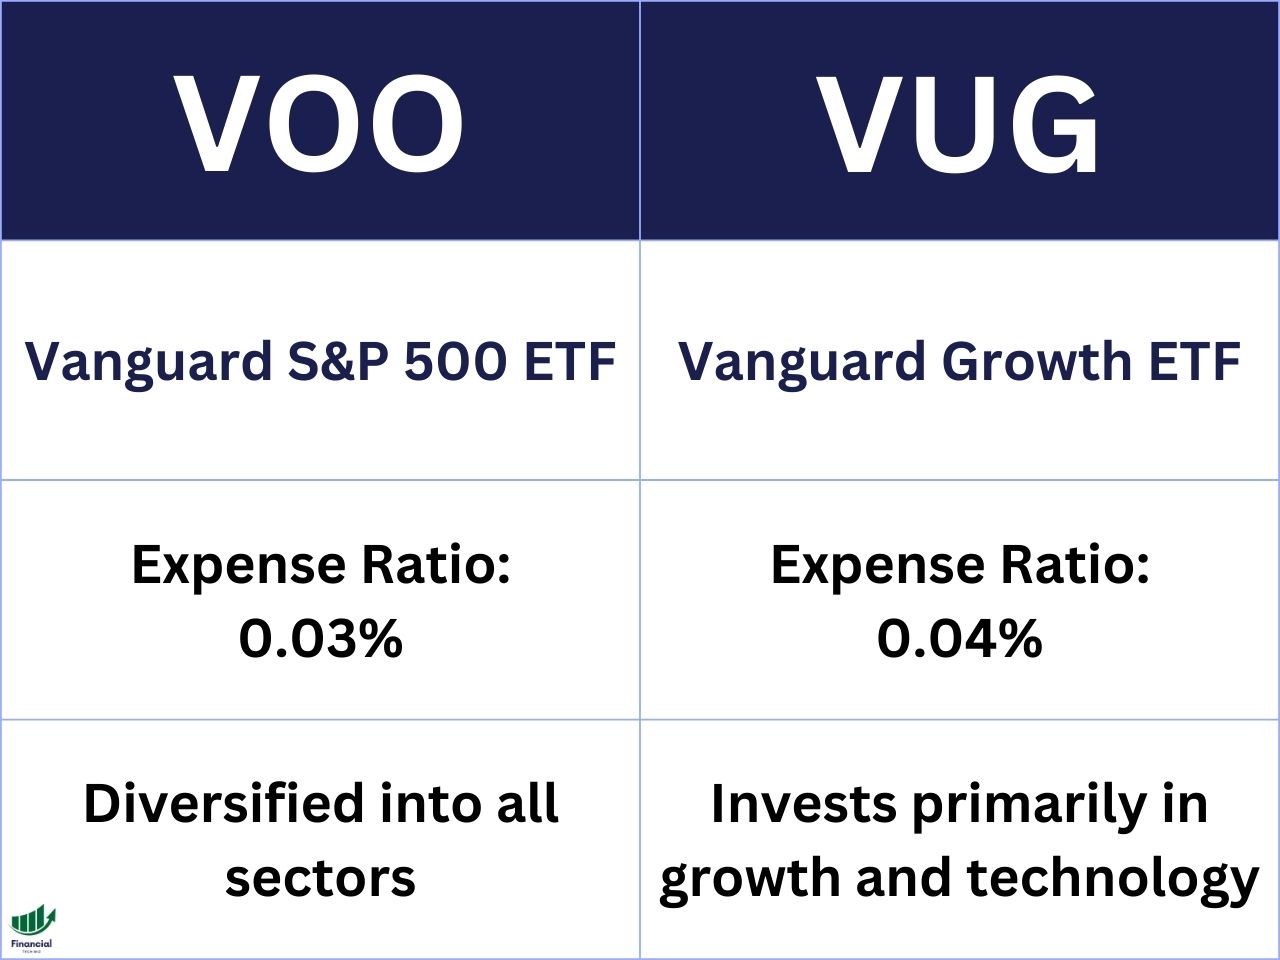
VOO and VUG are both ETFs that are managed by Vanguard, one of the largest and most reputable investment companies in the world. VOO stands for Vanguard S&P 500 ETF, while VUG stands for Vanguard Growth ETF.
VOO tracks the performance of the S&P 500 Index, which is widely regarded as the best representation of the US stock market. The S&P 500 Index consists of 500 of the largest and most influential companies in the US across various sectors and industries.
VOO aims to replicate the index by holding all or a representative sample of its constituents with similar weights and proportions. VOO is great for investors who want to diversify their portfolio into 500 of the best US companies and benefit from their long-term growth potential.
VUG tracks the performance of the CRSP US Large Cap Growth Index, which is a subset of the CRSP US Large Cap Index. The CRSP US Large Cap Growth Index consists of large-cap US companies that exhibit above-average growth characteristics, such as high earnings growth, high sales growth, high return on equity, and high expected earnings growth.
VUG aims to replicate the index by holding all or a representative sample of its constituents with similar weights and proportions. VUG is best suited for investors who are looking for higher returns but also higher volatility, as growth stocks tend to outperform value stocks in bullish markets but underperform in bearish markets.
VUG vs. VOO Total Return Performance
Perhaps the most important factor to consider when comparing VUG and VOO is their total return performance. Total return is the change in value of an investment over a given period of time, including any dividends or capital gains distributions, expressed as a percentage. Total return is an indicator of how much an investment has grown or shrunk over time.
VUG has a total return (including dividends) of around 76% over the past five years, while VOO has a total return of around 60%. This means that VUG has outperformed VOO by around 16 percentage points in the past five years.
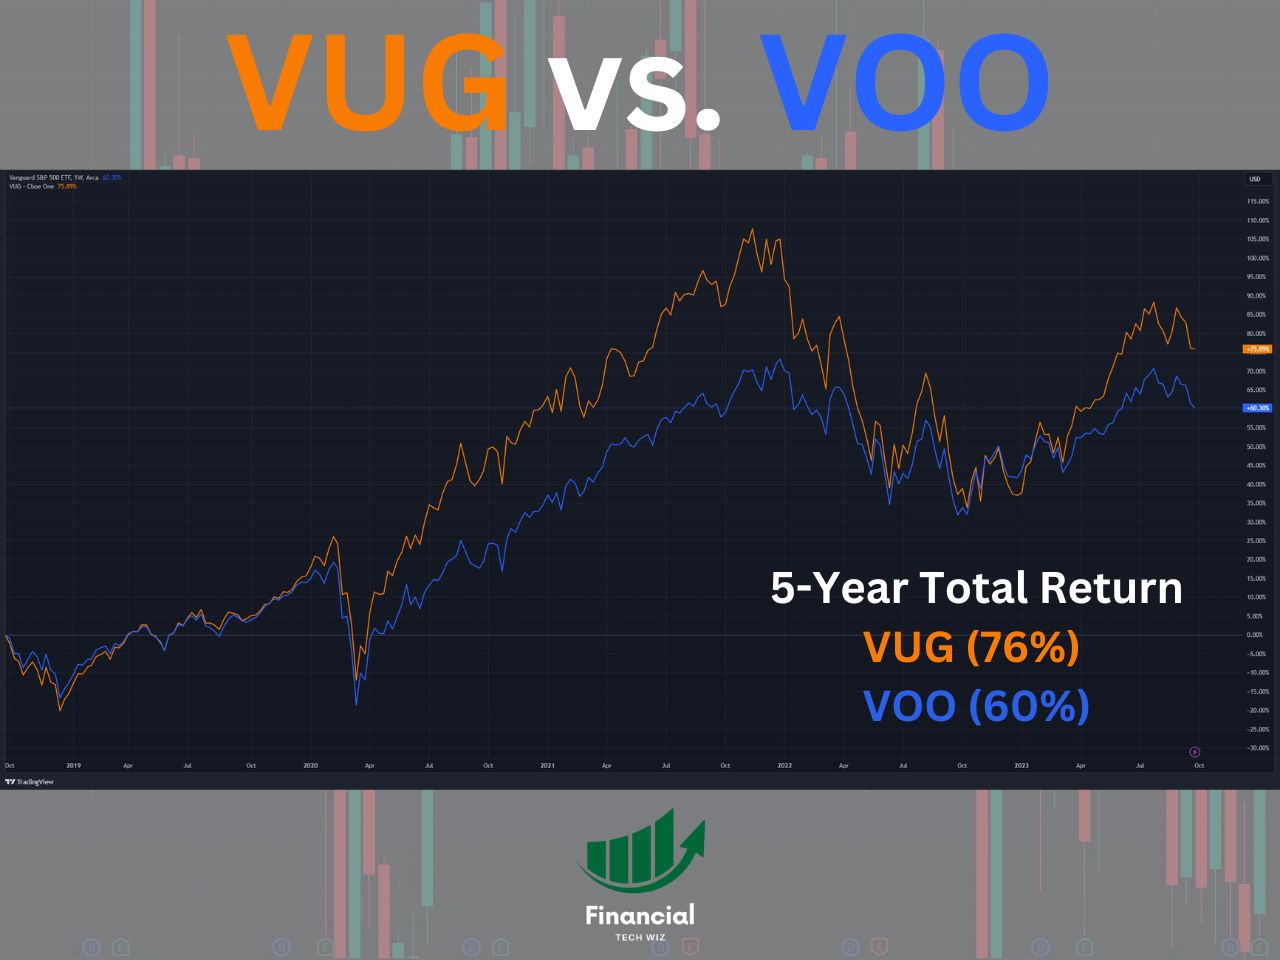
The reason why VUG has outperformed VOO is that the past five years have been extremely bullish for tech stocks, which make up more than half of VUG’s holdings. Tech stocks have benefited from the rapid growth of e-commerce, cloud computing, social media, artificial intelligence, and other disruptive technologies that have changed the way we live and work.
VOO, on the other hand, has a more balanced portfolio that includes companies from various sectors and industries, such as health care, consumer staples, financials, and energy.
However, this does not mean that VUG will always outperform VOO in the future. VOO will likely perform better than VUG in sideways and down markets, as it holds more companies that are less sensitive to economic cycles and market fluctuations. VOO also offers more diversification and lower risk than VUG, as it holds more than twice the amount of companies.
The chart above compares the total return performance of VUG and VOO over the past five years using data from TradingView. TradingView is a powerful platform that allows you to easily compare several ETFs on a single chart and even adjust the data for dividends so you can see the total return and not just the price return.
You can get a TradingView free trial when you use our link to sign up, but you can compare ETFs with a free account as well.
VUG vs. VOO Dividend Yield
| ETF | Dividend Yield |
| VUG | 0.56% |
| VOO | 1.48% |
One of the main differences between VUG and VOO is their dividend yield. Dividend yield is the ratio of annual dividend payments to the current share price, expressed as a percentage. Dividend yield is an indicator of how much income an investor can expect to receive from holding a fund.
VOO has a dividend yield of 1.48%, which means that for every $100 invested in VOO, an investor can expect to receive $1.48 in dividends per year. VUG has a dividend yield of 0.56%, which means that for every $100 invested in VUG, an investor can expect to receive $0.56 in dividends per year.
The reason why VOO has a higher dividend yield than VUG is that VOO invests in more mature and stable companies that tend to pay higher dividends to their shareholders, while VUG invests in more growth-oriented companies that tend to reinvest their earnings back into their business for future expansion and innovation.
VUG vs. VOO Expense Ratios
| ETF | Dividend Yield |
| VUG | 0.04% |
| VOO | 0.03% |
Another important factor to consider when comparing VUG and VOO is their expense ratio. The expense ratio is the annual fee that a fund charges its investors for managing their assets, expressed as a percentage of the fund’s net assets. The expense ratio is an indicator of how much a fund costs to operate and maintain.
VOO has an expense ratio of 0.03%, which means that for every $100 invested in VOO, an investor pays $0.03 in fees per year. VUG has an expense ratio of 0.04%, which means that for every $100 invested in VUG, an investor pays $0.04 in fees per year.
Both VOO and VUG have very low expense ratios compared to the average expense ratio of US equity ETFs, which is around 0.44%. This means that both funds are very efficient and cost-effective ways to invest in the US stock market. Keeping expenses low is one of the reasons why Vanguard is so successful.
VUG vs. VOO Holdings
Another factor to consider when comparing VUG and VOO is their holdings. Holdings are the individual stocks that make up a fund’s portfolio. Holdings can reveal a lot about a fund’s investment strategy, risk profile, sector exposure, and diversification.
VOO is more diversified than VUG, as it holds 508 companies, while VUG holds 234 companies. This means that VOO has a lower concentration risk than VUG, as it spreads its assets across more companies and reduces the impact of any single company on its performance.
More than half of VUG’s holdings are within the technology sector, while VOO has around 28% allocated to technology. This means that VUG has a higher sector risk than VOO, as it depends more on the performance of one sector and is more vulnerable to any sector-specific shocks or trends.
Comparing ETFs With TradingView
When comparing ETFs, it is crucial that you are comparing the total return to include dividend payments. TradingView allows you to compare several stocks and ETFs at once on a single chart adjusted for dividends.
You can simply sign up for a free TradingView account and type the stock ticker you want to compare. Next, click the plus sign next to the ticker at the top left of the chart to add symbols to compare.
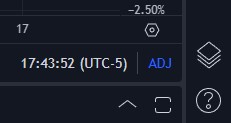
Finally, ensure you click the ‘ADJ’ at the bottom to adjust the returns for dividends!
As you can see in the TradingView chart below, you can compare multiple funds and ETFs on a single chart, making your research much easier. Feel free to compare any ETFs you’d like using the widget.
Explore Other ETF Comparisons
If you are interested in comparing other ETFs, you can check out our other articles such as:
- VOO vs. SPY: Which S&P500 ETF is Better?
- VUG vs. QQQ: Which Growth ETF is Better?
- VOO vs. QQQ: Which ETF is Better for Tech Exposure?
- QQQ vs. VTI: Which ETF is Better for Total Market Exposure?
- VOO vs. SCHD: Which ETF is Better for Dividend Income?
- VTI vs. VOO: which broad market ETF is best?
- VFIAX vs. VOO: Which is best for you?
The Financial Tech Wiz ETF Comparison Tool
You can use the ETF comparison tool below to compare over 2,000 ETFs and mutual funds with data I manually collected:
VUG vs. VOO | Bottom Line
VUG and VOO are both excellent ETFs that offer exposure to large-cap US companies, but they have different investment objectives and strategies.
VUG is best suited for investors who are looking for higher returns but also higher volatility, as it invests in growth stocks that tend to outperform value stocks in bullish markets but underperform in bearish markets.
VOO is great for investors who want to diversify their portfolio into 500 of the best US companies and benefit from their long-term growth potential and stable dividends.
Both VUG and VOO have very low expense ratios, which makes them very efficient and cost-effective ways to invest in the US stock market. However, they also have different dividend yields, total return performance, holdings, and sector exposure, which can affect their risk-reward profile and suitability for different investors.
Ultimately, the choice between VUG and VOO depends on your personal preference, risk tolerance, time horizon, and investment goals. You can also combine both funds in your portfolio to achieve a balance between growth and value or diversify into other ETFs that cover different market segments or regions.
If you want to easily track and compare all these ETFs and more, you can sign up for a TradingView free trial using our affiliate link.

TradingView is a powerful platform that allows you to access real-time data, charts, indicators, tools, and community insights for all markets from a single platform.
You can also create your own custom watchlists, alerts, strategies, and more. TradingView is compatible with any device and browser, so you can always stay on top of your investments wherever you are.