TrendSpider Raindrop Charts: How They Work and How to Read Them
Raindrop charts are a TrendSpider-original chart type that blends price action with the volume profile of each period into a single visualization. They show what candlesticks cannot: where in a period the volume actually traded, and which way that volume pushed price. This guide walks through how raindrops are rendered, what each color and shape signals, the patterns worth memorizing, and how to enable them inside the TrendSpider charting platform.
Key Takeaways
- Raindrops compress price, volume, and VWAP into one shape. Width tells you where volume traded; color tells you which half of the period was stronger.
- Three core colors: green (right VWAP higher than left, buyers dominated), red (left VWAP higher, sellers dominated), blue (the VWAPs match, indecision).
- Best read on the daily timeframe and used alongside named patterns (Balloons, Flips, Blue raindrops), which present volume-weighted chart observations worth reviewing in context with trend and market conditions.
Try It Yourself
TrendSpider
Raindrop charts come included on every TrendSpider plan, alongside multi-timeframe analysis, automated chart pattern recognition, and dynamic alerts. Use coupon code FTW25 for 25% off any plan.
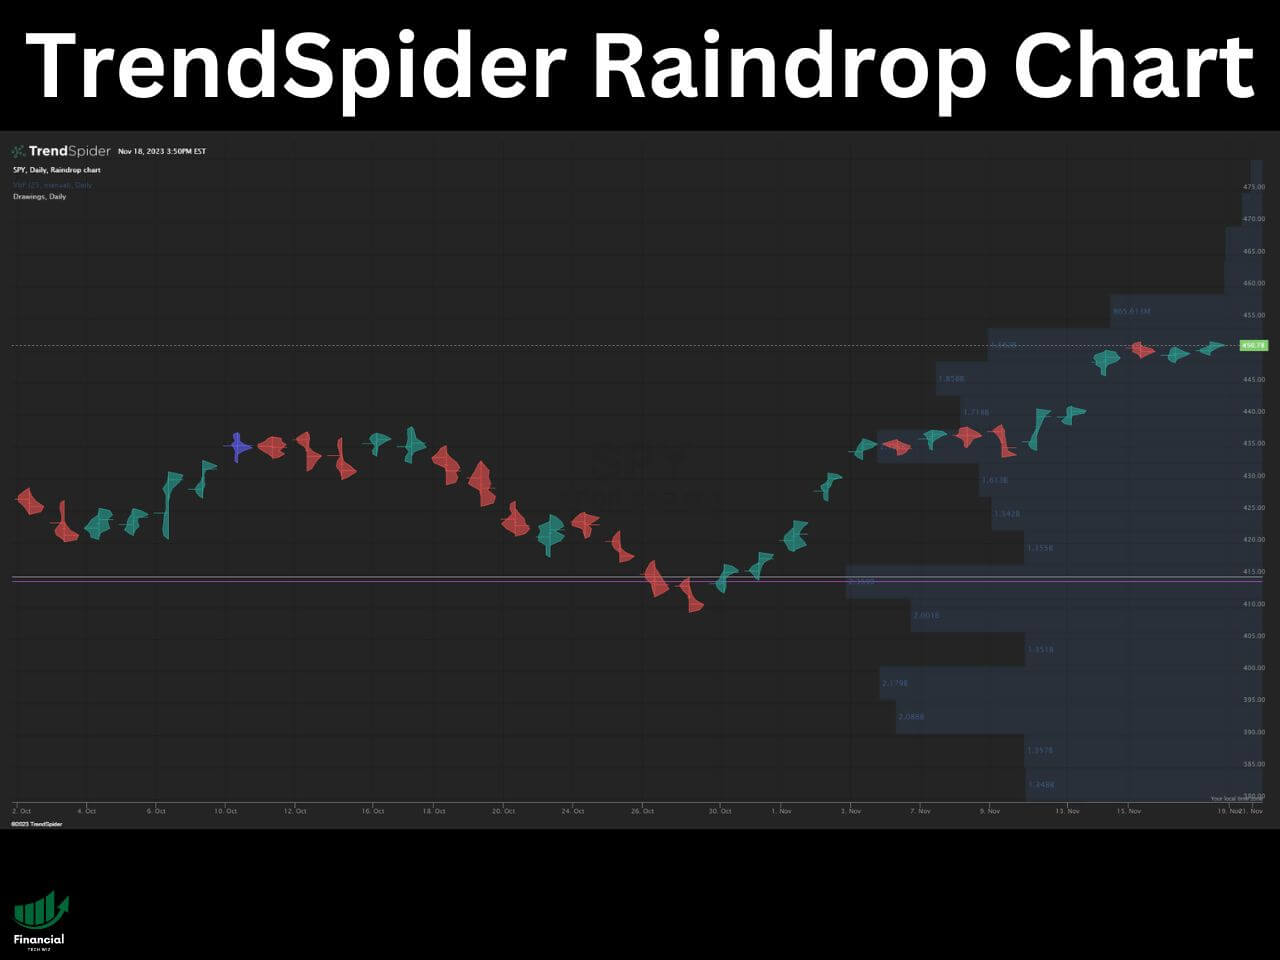
Try TrendSpiderHow Raindrop Charts Are Rendered
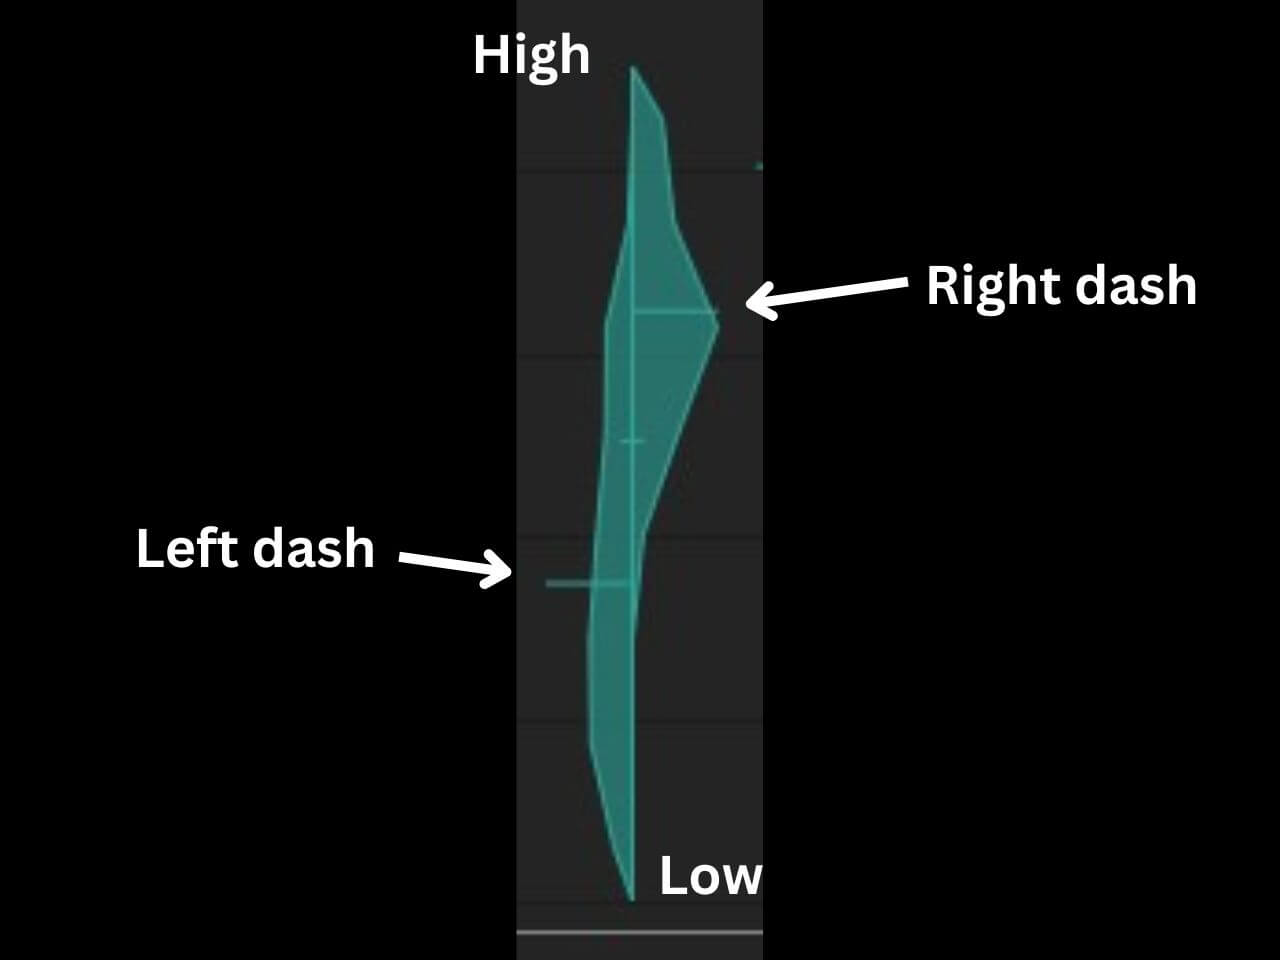
Each raindrop is built from the same OHLCV data as a candlestick but discards the open and close prices in favor of two VWAPs. The first half of the period gets a left VWAP, drawn as a tick on the left side of the body. The second half gets a right VWAP, drawn as a tick on the right. The shape between those two ticks is a sideways volume profile: the wider the body at any given price, the more volume traded at that price during the period.
The high and low of the period set the top and bottom of the raindrop. The result is a single shape that simultaneously communicates price range, volume distribution, and intra-period sentiment shift. A candlestick tells you where price opened and closed; a raindrop tells you where the average dollar of volume actually traded and how conviction shifted across the session.
Reading Raindrop Color and Shape
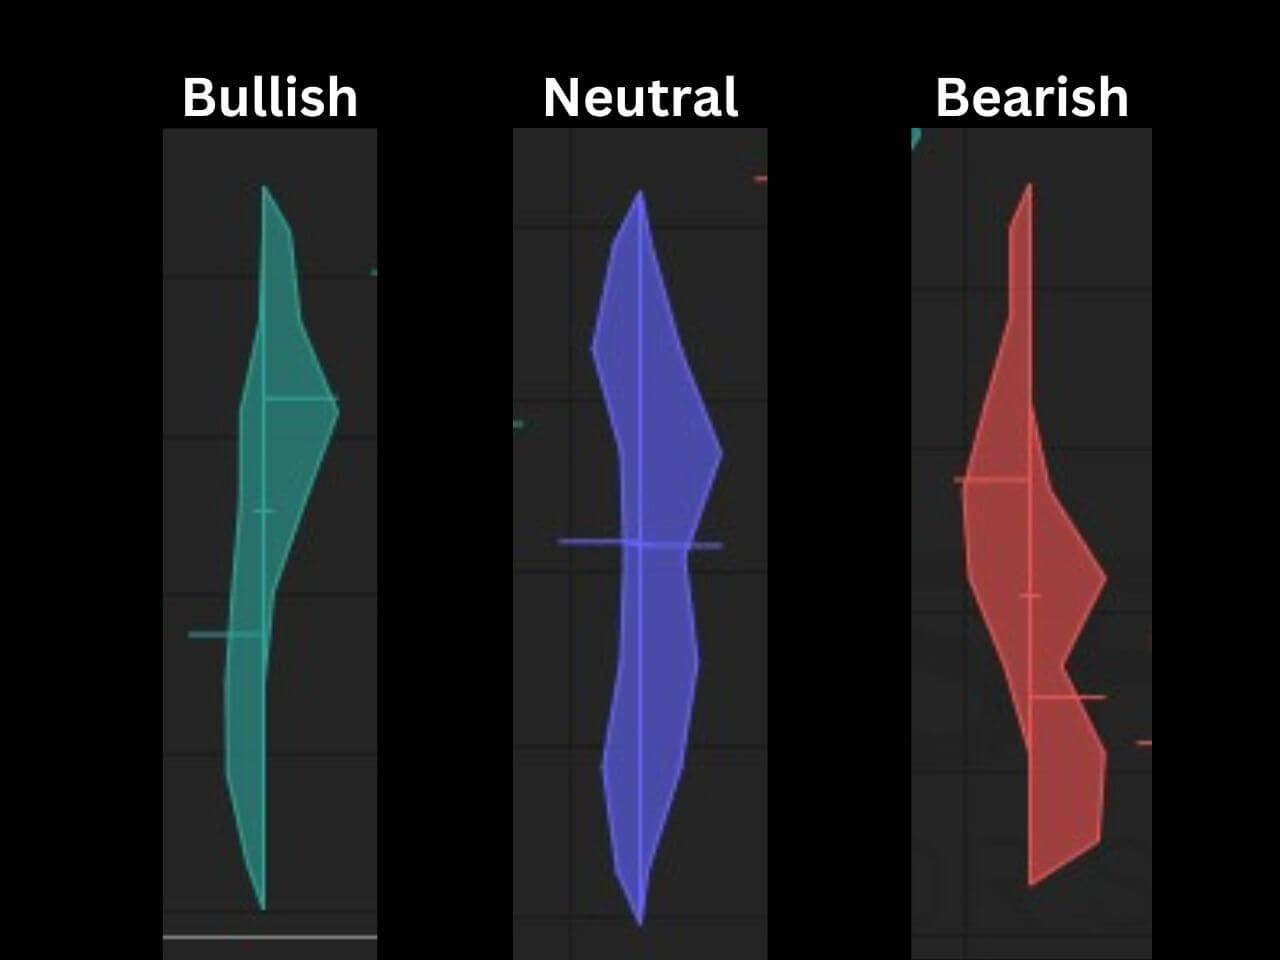
Color is set by the relationship between left VWAP and right VWAP. A green raindrop means the second-half VWAP is higher than the first-half VWAP: buyers were stronger as the period closed. A red raindrop means the second-half VWAP is lower; sellers were stronger into the close. A blue raindrop is rare: it appears when the two VWAPs are equal, signaling indecision.
Width is set by volume distribution. A bulged middle means most of the period’s volume traded at the median price. A bulged top or bottom means volume concentrated near the extremes of the range, which is context that a candlestick body cannot communicate on its own. Combining color (sentiment direction) with shape (volume concentration) gives you more information per bar than a standard candlestick or bar chart.
Named Raindrop Patterns
Three named patterns recur on TrendSpider’s documentation and are worth memorizing before you add raindrop charts to a live workflow.
Named Raindrop patterns can help users organize volume-weighted chart observations, but they should be reviewed in context with trend, volume, market conditions, and the user’s broader research process.
Balloons form when both VWAPs sit above 60% of the body and at least 80% of volume traded in the upper portion. A balloon-shaped raindrop shows a period where most volume traded near the upper range, with buyers in control as the session closed. The inverse (volume concentrated below) shows sellers in control. Balloons indicate a volume-backed directional move worth reviewing alongside trend and broader market conditions.
Flips form when the left VWAP and the right VWAP separate by at least 50% of the body height. Flips display a meaningful intra-period sentiment swing: buyers and sellers traded control in a dramatic way during the period. A flip from green to red (right VWAP dropping hard below left VWAP) on above-average volume shows a notable shift in intra-period conviction worth reviewing in context with trend and volume.
Blue raindrops form when the left and right VWAPs are equal. They are uncommon and show periods where the two halves of a session closed at the same volume-weighted average price, indicating a balance of buyer and seller activity during the period. Traders sometimes use blue raindrops as a volume-weighted context indicator alongside trend and broader market conditions. Raindrop charts are included on every TrendSpider plan; for the current tier breakdown, see the TrendSpider pricing page.
Track Your Raindrop Setups
Financial Tech Wiz Trading Journal
Tag every trade you take off a raindrop read and watch which patterns (Balloons, Flips, Blue raindrops) actually produce winning setups for your account. Performance analytics, AI insights, and equity-curve tracking starting at $9.91/month billed annually.
Try It FreeRaindrops vs. Japanese Candlesticks
A candlestick body is bounded by open and close. A raindrop body is bounded by two VWAPs and weighted by volume distribution. The practical difference: candlesticks tell you where price started and ended; raindrops tell you where the average dollar of volume actually traded and how conviction shifted across the session.
On low-conviction days, a candlestick can suggest a strong move that the underlying volume profile does not support, and the raindrop will visibly correct that impression. On high-conviction days, both tell the same story, but the raindrop adds context about whether buyers or sellers were stepping in late. If you are weighing whether to switch chart engines entirely, the TrendSpider vs. TradingView breakdown compares the two on indicators, scanners, and chart-type coverage.
Best Timeframes for Raindrop Charts
Raindrops shine on the daily timeframe because each daily raindrop summarizes a full session of volume distribution. On intraday timeframes (5-minute, 15-minute), raindrops still work but the volume profile per period is thinner, so the geometry conveys less. TrendSpider supports raindrop charts on any timeframe its charting tool offers, but the most common use case is replacing daily candlesticks with daily raindrops for swing trading and position trading research.
Day traders watching micro structure tend to switch back to candlesticks or footprint charts for intraday execution. The raindrop layer is most useful for higher-timeframe context: understand where volume supported price over the prior sessions, then drop down to your execution timeframe to manage entries. If you want a broader view of the platform before subscribing, the TrendSpider review walks through pricing, indicators, and how the chart engine compares to TradingView.
How to Enable Raindrop Charts on TrendSpider
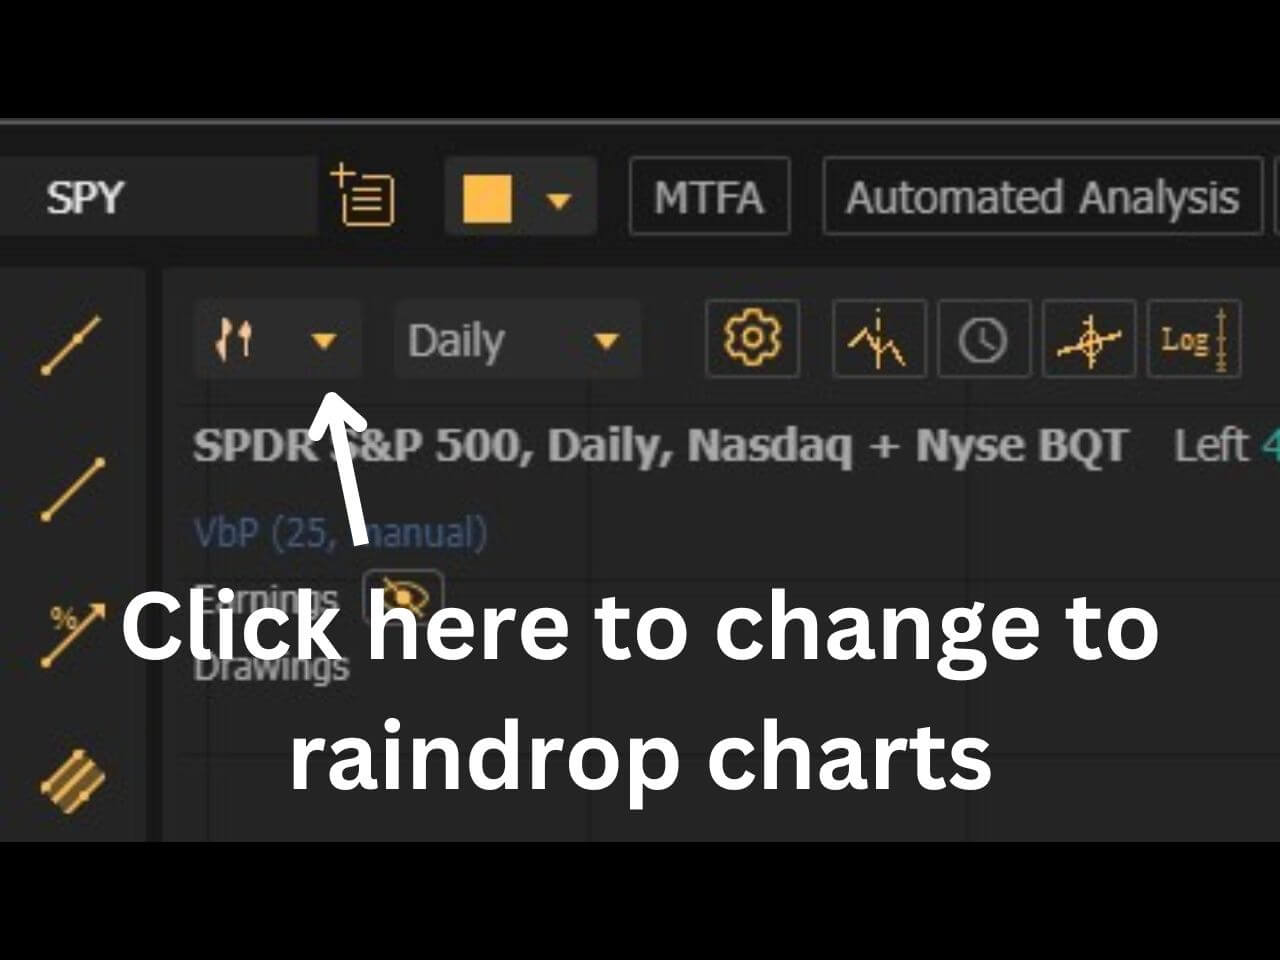
On the TrendSpider chart toolbar (top-left of the chart, immediately to the right of the timeframe selector), click the chart-type icon. A dropdown appears with chart types including Candlestick, Line, Bar, Heikin Ashi, and Raindrop. Select Raindrop. The chart re-renders with raindrops at whatever timeframe is currently active.
To switch back to candlesticks, repeat the dropdown selection. Raindrop styling (color choice, body fill, opacity) is configurable from the chart-settings panel. You can save 25% on any TrendSpider plan with coupon code FTW25.
Raindrop Charts are one slice of TrendSpider’s broader market research surface. The platform also runs a Market Scanner and Smart Watch Lists for systematic ticker discovery, a Strategy Tester and Strategy Bots for backtesting and forward-running tested logic, Sidekick AI for natural-language platform tasks, dynamic and multi-factor cloud-based alerts, options tools, and alternative market data.
Who Raindrop Charts Work Best For
Swing traders and position traders who already use volume-by-price logic in their analysis benefit most from raindrop charts. Traders who base decisions primarily on patterns, opening price levels, or order-flow logic may find raindrops add little to their workflow. The third group worth flagging is anyone running multi-timeframe analysis: pulling raindrops on the daily and candlesticks on the 30-minute is a common configuration that combines volume-weighted higher-timeframe context with traditional intraday execution charts.
Logging the trades you set up off raindrop reads is what turns the chart insight into a measurable edge. The Financial Tech Wiz Trading Journal tags every trade by symbol, hold duration, and outcome so you can see whether raindrop-driven setups actually outperform your other strategies. If you want to test the raindrop workflow before committing to a paid journal app, the free trading journal template for Google Sheets covers the basics.
Get Your Free Trading Resources
Grab the free trading journal template plus the same tools we use to stay organized, consistent, and objective.
- Free trading journal template
- Custom indicators, watchlists, and scanners
- Access our free trading community
Enter your email below to get instant access.
No spam. Unsubscribe anytime.
Frequently Asked Questions
What is a raindrop chart?
A raindrop chart is a TrendSpider-original chart type that blends price action with volume profile into one shape. Each raindrop is built from the same OHLCV data as a candlestick but uses two VWAPs (one for the first half of the period, one for the second half) and weights its body by volume distribution.
Are raindrop charts only available on TrendSpider?
Yes. Raindrop charts are a TrendSpider-original feature and are not currently offered on TradingView, thinkorswim, or other major charting platforms. Approximations using volume profile plus VWAP overlays exist on other platforms, but the integrated raindrop visualization is exclusive to TrendSpider.
What does a blue raindrop mean?
A blue raindrop appears when the left VWAP equals the right VWAP, meaning the first-half average and second-half average of the period landed on the same price. Blue raindrops mark indecision and frequently appear at levels where price reverses or breaks out, similar to the way doji candles flag turning points.
What timeframe is best for raindrop charts?
The daily timeframe is the most common use case because each daily raindrop summarizes a full session of volume distribution. Raindrops also work on lower timeframes but convey less because each period contains less volume to distribute. Most TrendSpider users keep raindrops on the daily for swing-trading research and switch to candlesticks for intraday execution.
Can raindrop charts replace candlestick charts?
Raindrops do not replace candlesticks; they complement them. Candlesticks remain the easier read for open and close levels and pattern recognition, while raindrops add a layer of volume context that candlesticks miss. Most experienced TrendSpider users keep both available and switch between chart types based on the question they are trying to answer.
Get Your Free Trading Resources
Grab the free trading journal template plus the same tools we use to stay organized, consistent, and objective.
- Free trading journal template
- Custom indicators, watchlists, and scanners
- Access our free trading community
Enter your email below to get instant access.
No spam. Unsubscribe anytime.


