TradingView Market Profile (2026): TPO Charts Explained
The market profile turns a trading day into a structured statistical distribution: where price was accepted, where it was rejected, and where the auction is unfinished. On TradingView, the same logic shows up as a TPO (time price opportunity) chart, with letters marking 30-minute time blocks stacked at the price levels they touched.
This guide is the practical version. We will walk through how to enable market profile on TradingView, how to read POC, value area, single prints, and distribution shape, how to use the initial balance, and how all of it fits inside auction theory. By the end you should be able to look at a TPO chart and tell whether the auction is balanced, one-sided, or unfinished, and trade accordingly.
Key Takeaways
- Market profile and TPO charts visualize a session as a distribution: the Point of Control is the price with the most TPO letters, the Value Area holds 70% of activity, and the shape (D, P, b, B, trend) tells you which time frame controlled the auction.
- TradingView builds this in the chart-type menu (TPO) plus an optional Volume Profile overlay; the default 30-minute block size, 70% value area, and “Each” multi-session preset are the standard starting points.
- Use the Initial Balance to anchor the first hour, treat single prints and weak highs/lows as unfinished auctions to retest, and journal value-area-high and value-area-low touches over time so the read-throughs compound.
Tag every market-profile entry with the value-area touch, POC reaction, or distribution shape that triggered it, then review which read repeats and which is noise. Auto-imports from 25+ brokers via SnapTrade, AI insights surface what is working without you sorting spreadsheets.
Try the Trading JournalHow Does the Market Profile Work?
The time price opportunity chart on TradingView consists of several components that work together to show where the auction found acceptance and where it was rejected. Understanding each component individually is the prerequisite for reading the profile as a whole.
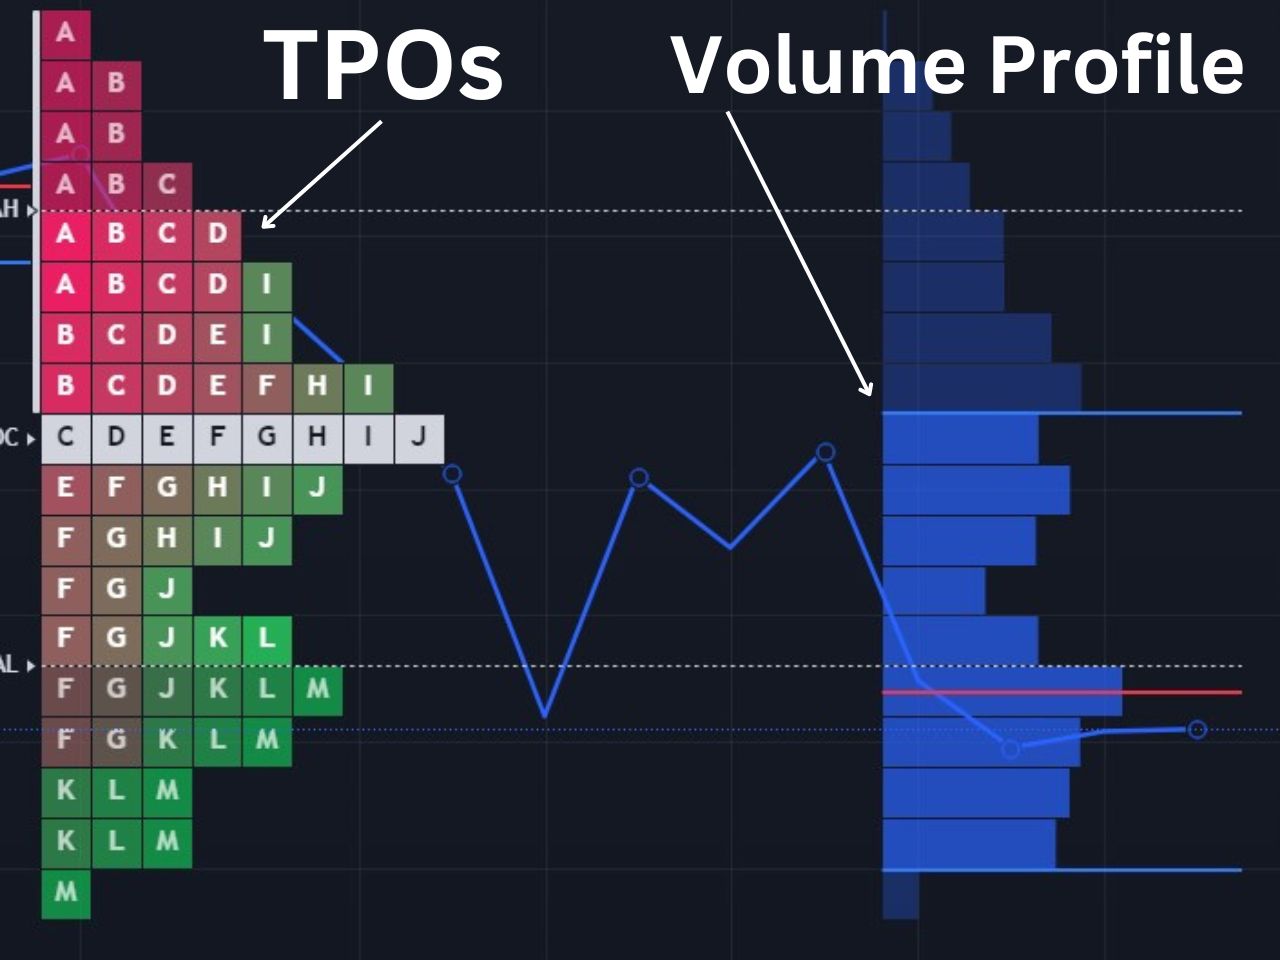
Time Price Opportunities (TPOs)
Each of the blocks in the image are TPOs, which stack based on how much time is spent at a specific price level. Each letter represents a specific time period, which is usually set to 30 minutes, as recommended by the founders of the market profile. For example, A would be the first 30 minutes of the market, and any price level an A is present, the asset traded at within the first 30 minutes.
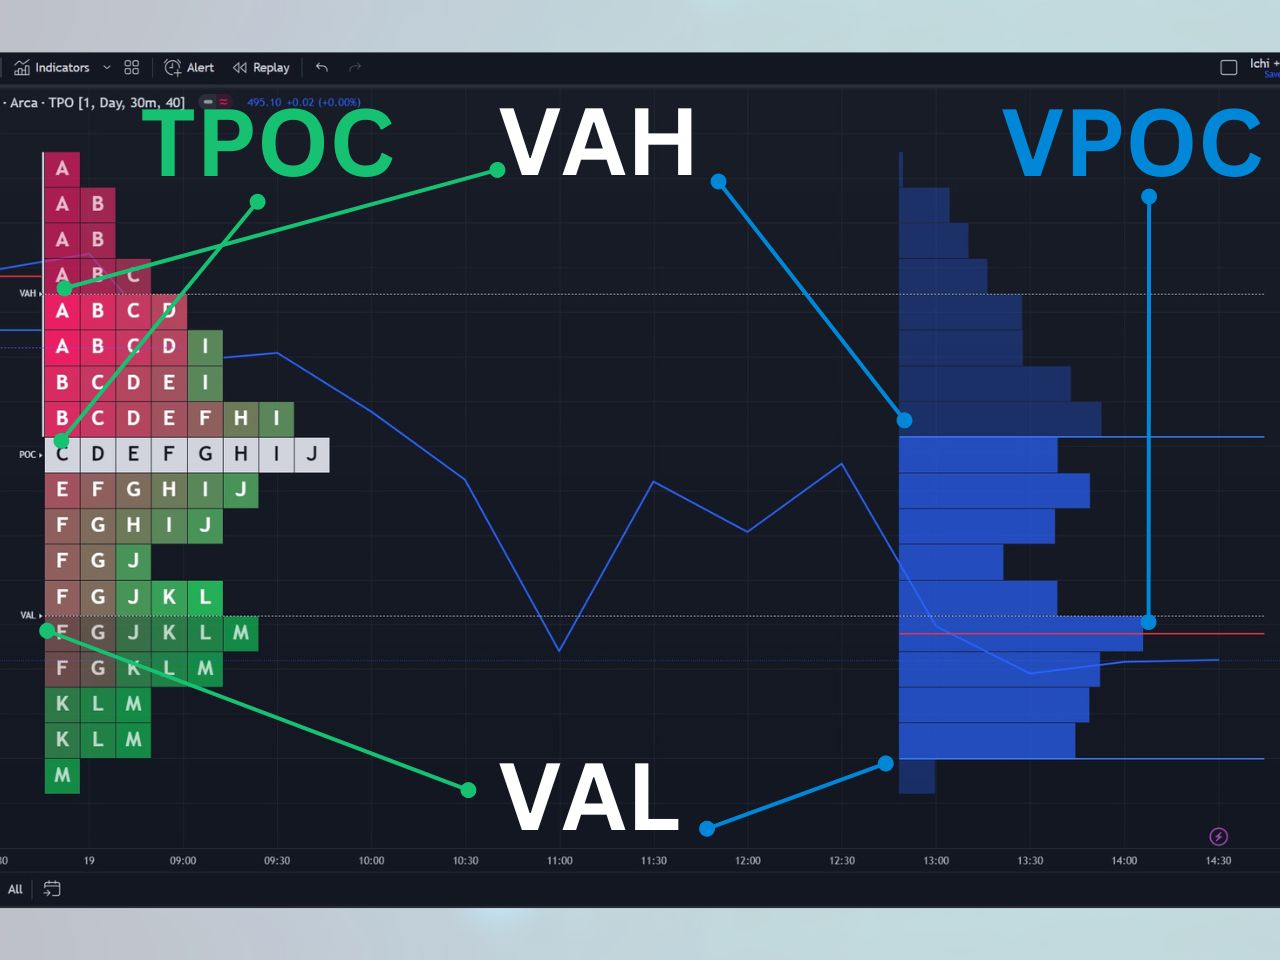
Point of Control (POC)
The point of control is the price level which the price has spent the most time at. It is essentially the level where the most TPOs exist, meaning the price has traded there for longer than any other price for that session. Traders treat POC as a magnet for future sessions: when price drifts away from it, the auction often pulls it back; when price breaks through it on heavy volume, that prior fair-value level often flips to support or resistance.
Value Area, VAH, VAL
The value area consists of the price levels in which 70% of the time spent has occurred. The top of the value area is referred to as the value area high (VAH), and the bottom is the value area low (VAL). The 70% threshold is not arbitrary: it comes from J. Peter Steidlmayer’s observation that markets spend roughly 70% of their time in a balanced, two-sided range and 30% in directional probes at the extremes. A session that closes inside the prior day’s value area is generally considered acceptance; a session that closes outside it is considered a potential trend move. Watching VAH and VAL as reference levels the following session is one of the most common market-profile trade triggers.
Volume Profile Overlay on TPO
The volume profile is an optional overlay within the market profile and consists of mostly the same components, except it is based on volume rather than time. The volume profile is set on the right side of the price action on TradingView, while the time price opportunity chart is on the left side. Key volume profile levels include the Volume Point of Control (VPOC), the volume value area high, and the volume value area low. When the time-based POC and volume-based POC align at the same price, that level tends to carry stronger support or resistance than either measure alone.
Single Prints
A single print is any part of the market profile that is only a single TPO wide. The idea with a single print is that very little time is spent at these price levels, indicating rapid directional movement. Single prints act as structural weakness: when future sessions return to those price levels, the auction is doing the work it did not complete the first time. Single prints at the high or low of a session are a key component of excess and poor high/low identification.
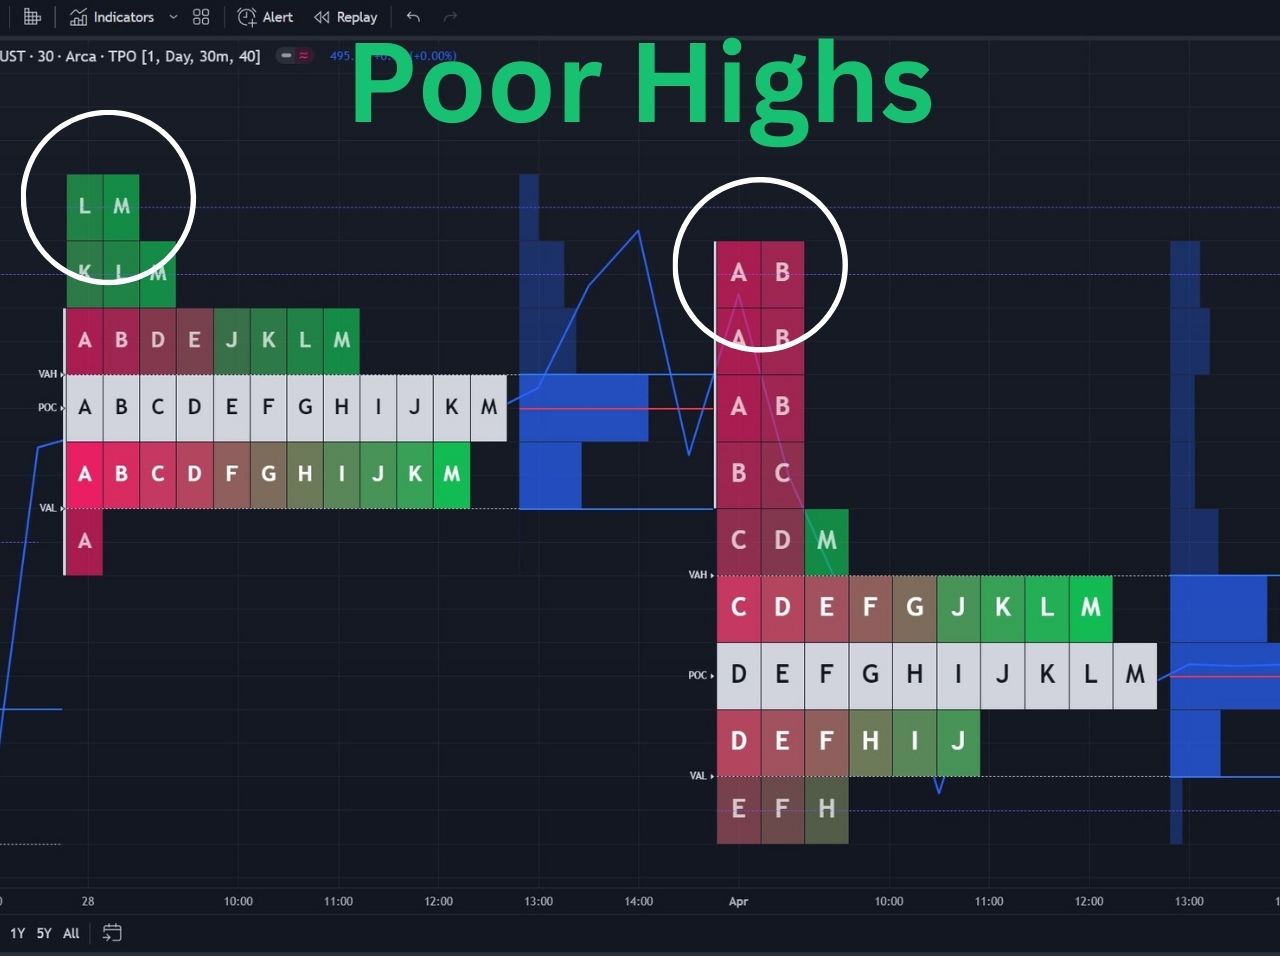
Poor High and Poor Low
A poor high occurs when the market reaches the high of a trading day but pulls back at least twice, with two different TPO periods at the top. The result is two or more TPO letters at the high rather than single prints, forming a flat-looking top. A poor low is the mirror image: the market reaches the session low, returns there within a different TPO period, and forms a flat-looking bottom. Both conditions signify an unfinished auction. When a future session revisits a poor high, there is strong structural pressure to break higher and repair it; when it revisits a poor low, the structural pressure is to break lower. You can toggle poor high and poor low detection on in TradingView’s TPO settings, where they appear as dotted purple lines extended forward.
Excess High and Excess Low
An excess high is when there are at least two single prints at the high of the market profile structure. Excess forms when price moves up aggressively and comes back down quickly: the auction probed too far, met strong opposing interest, and reversed. On a candlestick chart, this typically produces a long upper wick. An excess low is the same logic at the bottom: two or more single prints at the session low, quick rejection, and a long lower wick on the candle chart. Excess is the completed version of what poor highs and poor lows are not. When you see excess, the auction finished its work at that extreme; when you see a poor high or poor low, it did not.
Initial Balance
The Initial Balance (IB) is the price range traded during the first hour of the regular session. On a 30-minute TPO chart that means the high and low of the first two letter blocks, A and B (or whatever block-size labeling you have). On TradingView the IB range can be displayed as a vertical line to the left of the profile via the Lines and Labels settings.
Why traders watch it: the IB often defines the structural extreme of a balanced day. A break above IB high tends to invite continuation buyers; a break below IB low tends to invite continuation sellers. On a trend day the IB gets violated cleanly and never gets revisited, which is itself a tell. On a balanced day the IB caps both extremes and the rest of the session rotates inside. Combine this with the distribution shape (next section) and you get a fast read on whether to fade the extremes or trade with the breakout.
Distribution Shapes: D, P, b, B, and Trend Days
The shape of the day’s TPO distribution tells you who was in control of the auction. Five shapes do most of the work:
D shape: the most balanced distribution. Roughly even buying and selling on either side of the value area, with excess at both extremes. D days are textbook: the higher-time-frame buyers and sellers met, agreed on a fair-value range, and went home. Trade them by fading the value-area extremes.
P shape: a vertical buying excess off the open, then a smaller balanced distribution at the top. The single prints under the value area never get revisited. This usually means an aggressive higher-time-frame buyer entered early and the rest of the day rotated inside the new range. Continuation longs above the value-area high have edge; the unfilled prints below are weak structure to revisit on a future day.
b shape (lowercase): the inverse of P. Vertical selling off the open, balanced distribution at the bottom. Same logic as P, applied short. Continuation shorts below the value-area low; the unfilled prints above are weak structure.
B shape (uppercase): two separate balanced distributions stacked vertically with thin trade in the middle. Often a higher-time-frame regime change inside the same day. The thin section in the middle is the structural weakness; price tends to use it as both support and resistance during the same session.
Trend day: an elongated profile with no meaningful value area, often with single prints stacked through the middle. The auction is one-sided and self-reinforcing. Trade with the trend, journal the open and the IB, and resist the urge to fade.
Identifying the shape early matters. By the time letter D or E prints (90 to 120 minutes into the session) you usually have enough structure to pick a side.
Auction Theory and the TPO Chart
Market profile is the visual layer; auction theory is the conceptual layer underneath it. J. Peter Steidlmayer’s insight from the Chicago Board of Trade in the 1980s was that all markets, regardless of asset class, run on the same auction process: the auction seeks fair value by rotating between extremes, attracting buyers when price drops below fair value and sellers when price rises above it.
On a TPO chart this rotation is visible directly. The value area is the price range where the auction agreed on fair value. POC is the agreed-on midpoint. Excess at the extremes (two or more single prints) is the auction completing: price went too far, met enough opposing interest, and rotated back. Poor highs and poor lows are unfinished auctions: price reached an extreme but did not produce excess, so the auction is structurally vulnerable to retest.
The takeaway: when you see a poor low form on a TPO chart, you are not reading a chart pattern. You are reading an unfinished auction that, in theory, should resolve when a future session retests it. If you want the deeper conceptual primer on this framing, I wrote a separate piece on auction market theory that walks through the mechanics with examples.
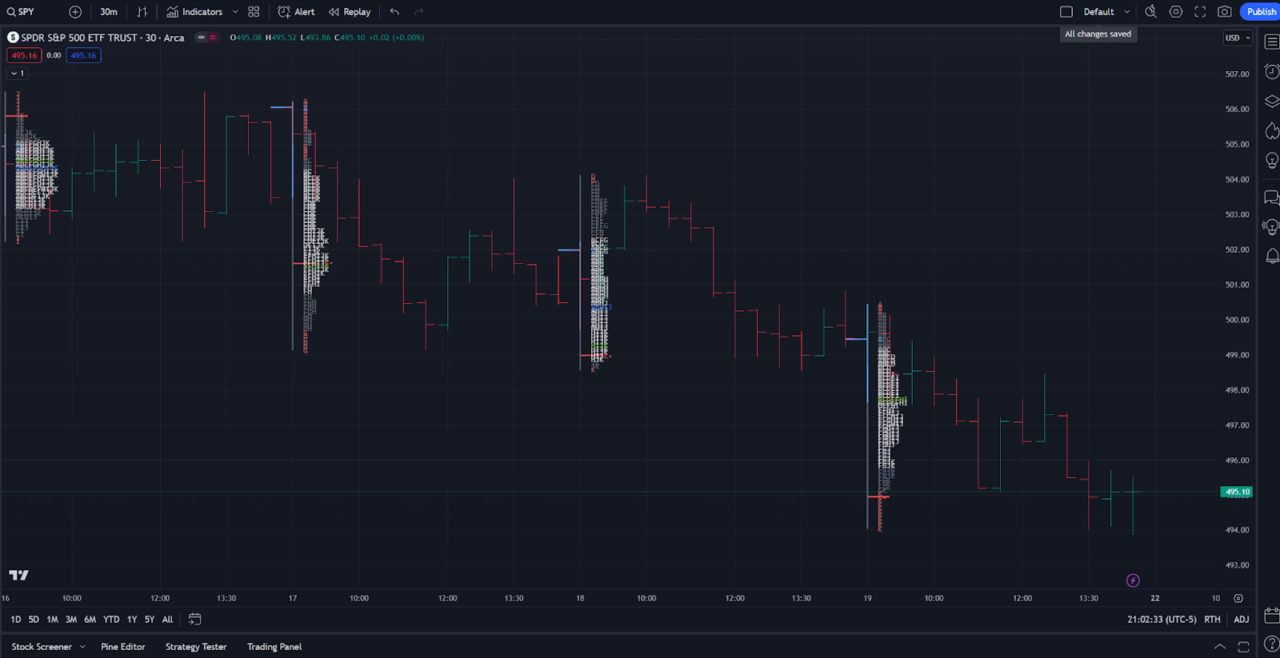
How to Access the TPO Charts on TradingView
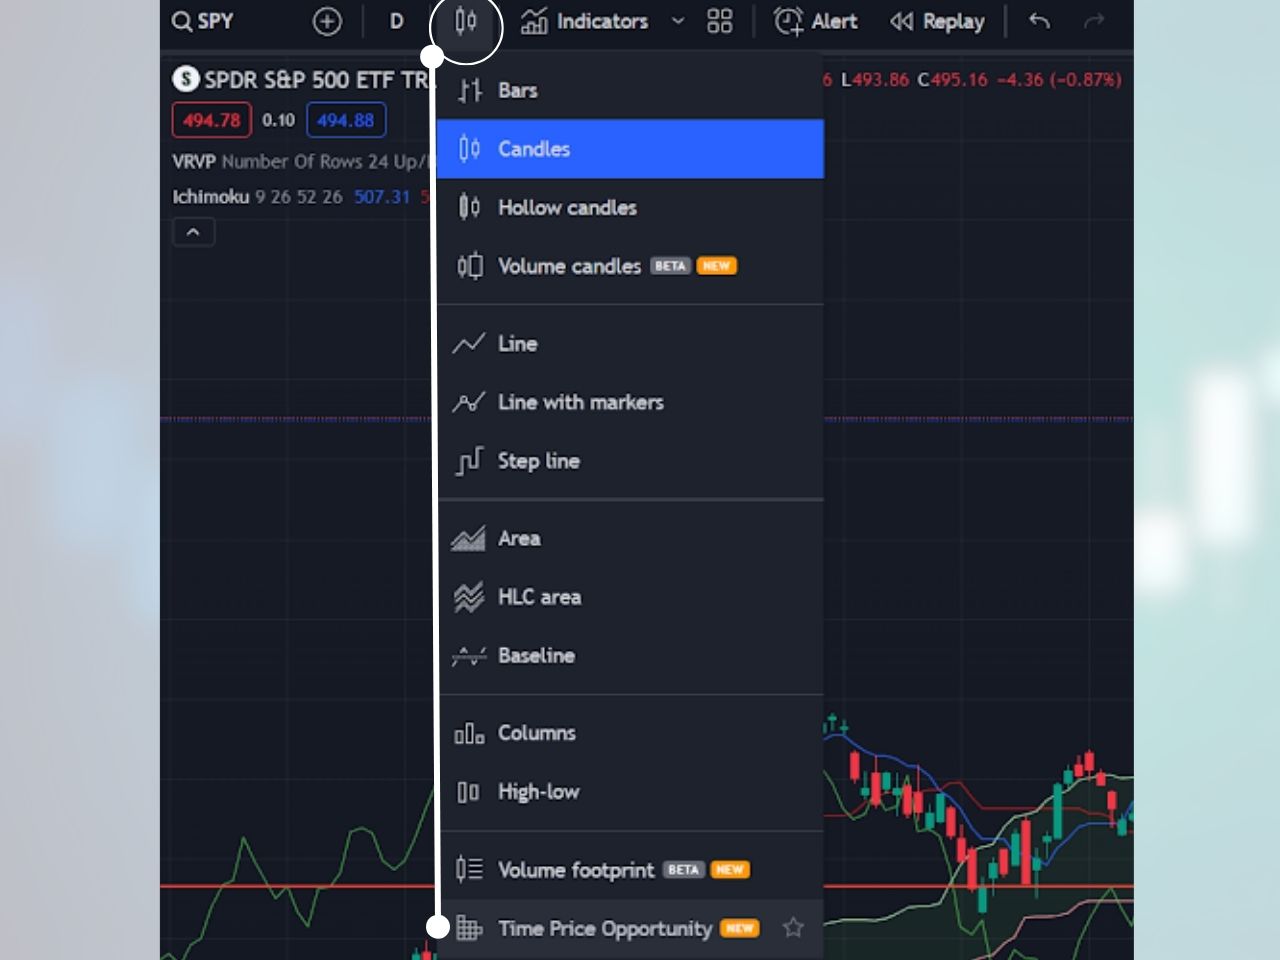
The market profile on TradingView is a chart type called “Time Price Opportunity.” Here is how you can add it to your chart:
1- Click on the chart type at the top left of a TradingView chart, right to the left of indicators
2- Click “Time Price Opportunity,” and the market profile will be added to your chart
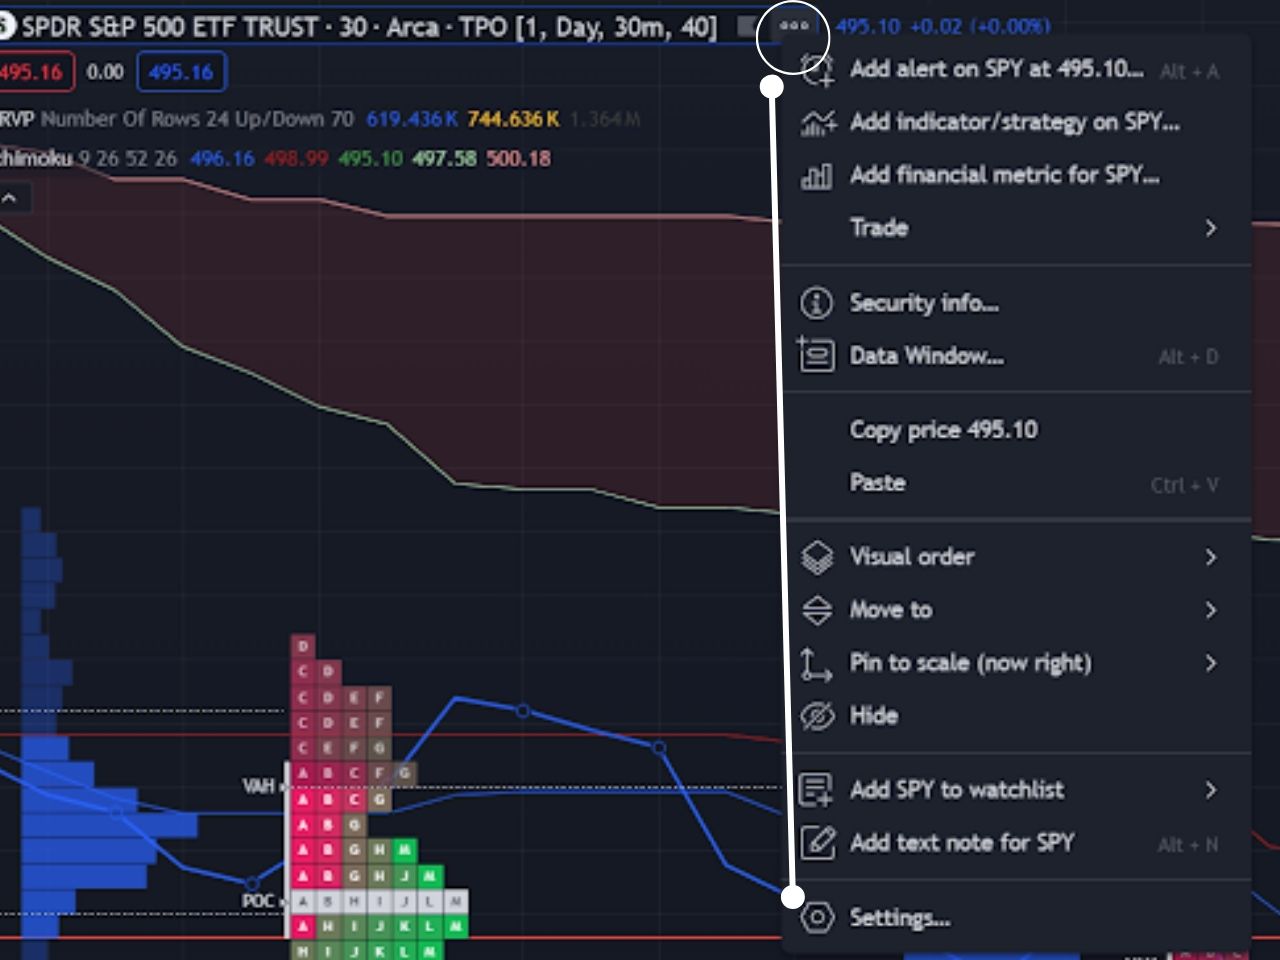
Customizing the Market Profile Settings on TradingView
You can customize many aspects of the market profile by hovering over the symbol at the top left corner, clicking the three dots, and then clicking settings in the drop-down menu. You can customize the period length, block size, row size, value area, and more.
The Time Price Opportunity chart is only available for Premium members and up, but you can get a TradingView free trial using my affiliate link to test it out for free before you pay.
Exclusive Deal: 30-Day FREE Premium Access + Bonus Credit
Don’t Miss Out – Sign up for TradingView Now!
- Advanced Charts
- Real-Time Data
- Track all Markets
Multi-Session Profiles and Custom Sessions
TradingView’s TPO chart supports multi-session profiles when the Period parameter is set to one day. The Session dropdown gives you presets for All (one continuous profile), Each (separate profiles for pre-market, market, and post-market), and Custom (manually defined intervals, up to five).
For US equities, “Each” is the most common starting point: it builds three distributions per day so you can see whether the regular session ratified the pre-market profile or fought it. For futures and crypto, “Custom” is more useful: you can define overlapping windows like 04:00-20:00 (extended) and 09:30-16:00 (regular) to compare how active and inactive participants shaped the same data. Overlapping custom sessions are split automatically at their intersection points, so you get a clean per-segment profile rather than mashed-together blocks.
TPO Alerts on TradingView
TradingView added native TPO alerts in 2025 and they are the cleanest way to track key profile levels without staring at the chart. Six conditions are supported on completed (not in-progress) profiles: price crossed extended POC, extended VAH, extended VAL, extended poor high, extended poor low, and extended single print.
Two practical notes: first, only extended levels (the lines pushed forward into future sessions) can trigger alerts, so you have to enable the relevant “Extend” toggle in Lines and Labels first. Second, the in-progress profile is intentionally excluded to avoid false signals, so an alert on today’s TPO will not fire until the session closes and the profile finalizes.
Reading the Market Profile
Once you understand the individual components covered above (POC, value area, single prints, poor highs and lows, excess, and the initial balance), reading the profile is a matter of combining them into a story about who controlled the session and what business is unfinished. Consider watching the video below for a visual walkthrough of how these elements come together on a live chart:

For even finer-grained order flow context alongside your TPO chart, footprint charts break each 30-minute block into individual buy and sell prints at the tick level, which can confirm or contradict what the profile shape is suggesting.
Market Profile vs. Volume Profile
Market profile (TPO) and volume profile are related but distinct tools. Market profile measures time spent at each price level; volume profile measures volume traded at each price level. They often agree on POC and value area, but on a one-sided session they can diverge: market profile rewards prices the session sat at, volume profile rewards prices the session traded at heavily.
Many traders run both overlays simultaneously on TradingView (TPO chart type with the volume profile overlay toggled on in settings) so the divergences themselves become a signal. When the time-based POC and the volume-based POC land at different prices, that gap tells you something about who was passive and who was aggressive in the session. When they agree, the consensus level carries more structural weight. Pairing market profile with VWAP on TradingView adds a third institutional reference: where the profile built its value area relative to the volume-weighted average price of the day reveals whether the session was a clean acceptance or a contested one.
Practical Applications for Traders
The market profile is a versatile tool that works across time frames and asset classes. Common applications include:
- Day Trading: use VAH, VAL, POC, and the initial balance as intraday reference levels. Fade value-area extremes on balanced (D-shape) days; trade breakouts on trend days.
- Swing Trading: use prior-day and prior-week profiles to define macro value areas and identify where unfinished auctions (poor highs, poor lows) sit relative to current price.
- Journaling setups: tagging each trade with the profile condition that triggered it (VAH fade, POC magnetic pull, IB breakout, single-print fill) builds a database of what works across market conditions. The Financial Tech Wiz Trading Journal lets you attach custom tags to every trade and review performance by tag over time.
For a broader toolkit of indicators that complement market profile work, the best TradingView indicators roundup covers volume delta, order flow, and VWAP tools that pair naturally with TPO charts. For a platform comparison suited to market profile traders, see TradeStation vs. Tradovate.
If you are not ready to subscribe, the free template gets you to a structured P&L log, value-area-touch tagging, and a daily review in under five minutes. Drop in below and you will get the link in the next email.
Get Your Free Trading Resources
Grab the free trading journal template plus the same tools we use to stay organized, consistent, and objective.
- Free trading journal template
- Custom indicators, watchlists, and scanners
- Access our free trading community
Enter your email below to get instant access.
No spam. Unsubscribe anytime.
How to Use the Market Profile for Free on TradingView
Since the time price opportunity chart on TradingView requires a premium subscription, you can check out the RS Market Profile custom indicator to access a similar feature for free. It offers many of the same benefits of the native indicator, but it is much less intuitive.
History of the Market Profile
The origins of market profile can be traced back to the trading floors of the Chicago Board of Trade (CBOT). It was here that J. Peter Steidlmayer developed this charting technique in the early 1980s. Made public in 1985, the market profile quickly garnered acclaim for its ability to provide traders with unique insights into market behavior. The core insight was that markets are auctions, and all auctions seek fair value. That principle flows directly into auction market theory, which explains why price rotates, when it trends, and what structural signals (poor highs, poor lows, excess) tell you about unfinished business in the auction.
The Bottom Line: Mastering Market Profile Trading Strategies
The market profile is a highly complex indicator, and not many traders completely understand its full potential. The pioneers of the market profile chart are J. Peter Steidlmayer, Steven B. Hawkins, and Jim (James) Dalton. I recommend the following books if you want to go deeper:
- Steidlmayer on Markets: Trading with Market Profile, 2nd Edition by J. Peter Steidlmayer
- Markets and Market Logic by J. Peter Steidlmayer
- Markets in Profile by Jim Dalton
- Mind Over Markets by Jim Dalton
Video resources worth watching:
Join for FREE: Access tons of free educational material!
Don’t miss out – Join now and start learning!
- Free Educational Material
- Community for Like-Minded Traders
- Personalized Trading Education
FAQ
What is the difference between a TPO chart and a candlestick chart?
A TPO chart aggregates a session into stacked time blocks at each price level, so the X-axis is not time but visited time per price. A candlestick chart shows OHLC for each fixed interval. TPO charts surface where price was accepted (long stacks) and where it was rejected (single prints); candlestick charts surface direction and momentum but not duration of acceptance.
Is TPO charting the same as market profile?
Yes. Time Price Opportunity is the chart-type name TradingView uses; market profile is the older industry term originating from J. Peter Steidlmayer’s work at the Chicago Board of Trade. Same construction, same components (POC, value area, single prints), same statistical-distribution logic.
How do I add the market profile to TradingView?
Open the chart-type dropdown next to the symbol (the candle icon) and select TPO. The default 30-minute block size and 70% value area work for most US equity sessions. To add the volume profile overlay, open the TPO settings and toggle “Show volume profile” under the Volume Profile tab.
What is the difference between market profile and volume profile?
Market profile (TPO) measures time spent at each price; volume profile measures volume traded at each price. They often agree on POC and value area but can disagree on a one-sided session: market profile rewards prices the session sat at, volume profile rewards prices the session traded at. Many traders run them together on the same chart so the divergences themselves become a signal.
What does the Point of Control (POC) tell you?
POC is the price level with the most TPO letters in the session, which is the price at which the most time-based agreement happened between buyers and sellers. Traders treat POC as a magnet: when price drifts away from it, the auction often pulls it back; when price breaks through it on heavy volume, that prior fair-value level often flips to support or resistance.
Are TPO charts useful for stocks or only futures?
TPO charts are most popular among futures traders because the futures session has a clean continuous structure, but they work on any liquid asset including individual stocks, ETFs, forex, and crypto. The lower the liquidity the noisier the profile, so single-name small caps with thin volume produce TPO charts that are mostly noise.
Get Your Free Trading Resources
Grab the free trading journal template plus the same tools we use to stay organized, consistent, and objective.
- Free trading journal template
- Custom indicators, watchlists, and scanners
- Access our free trading community
Enter your email below to get instant access.
No spam. Unsubscribe anytime.


