April CPI Hit 3.8%: What the Inflation Shock Means for Traders
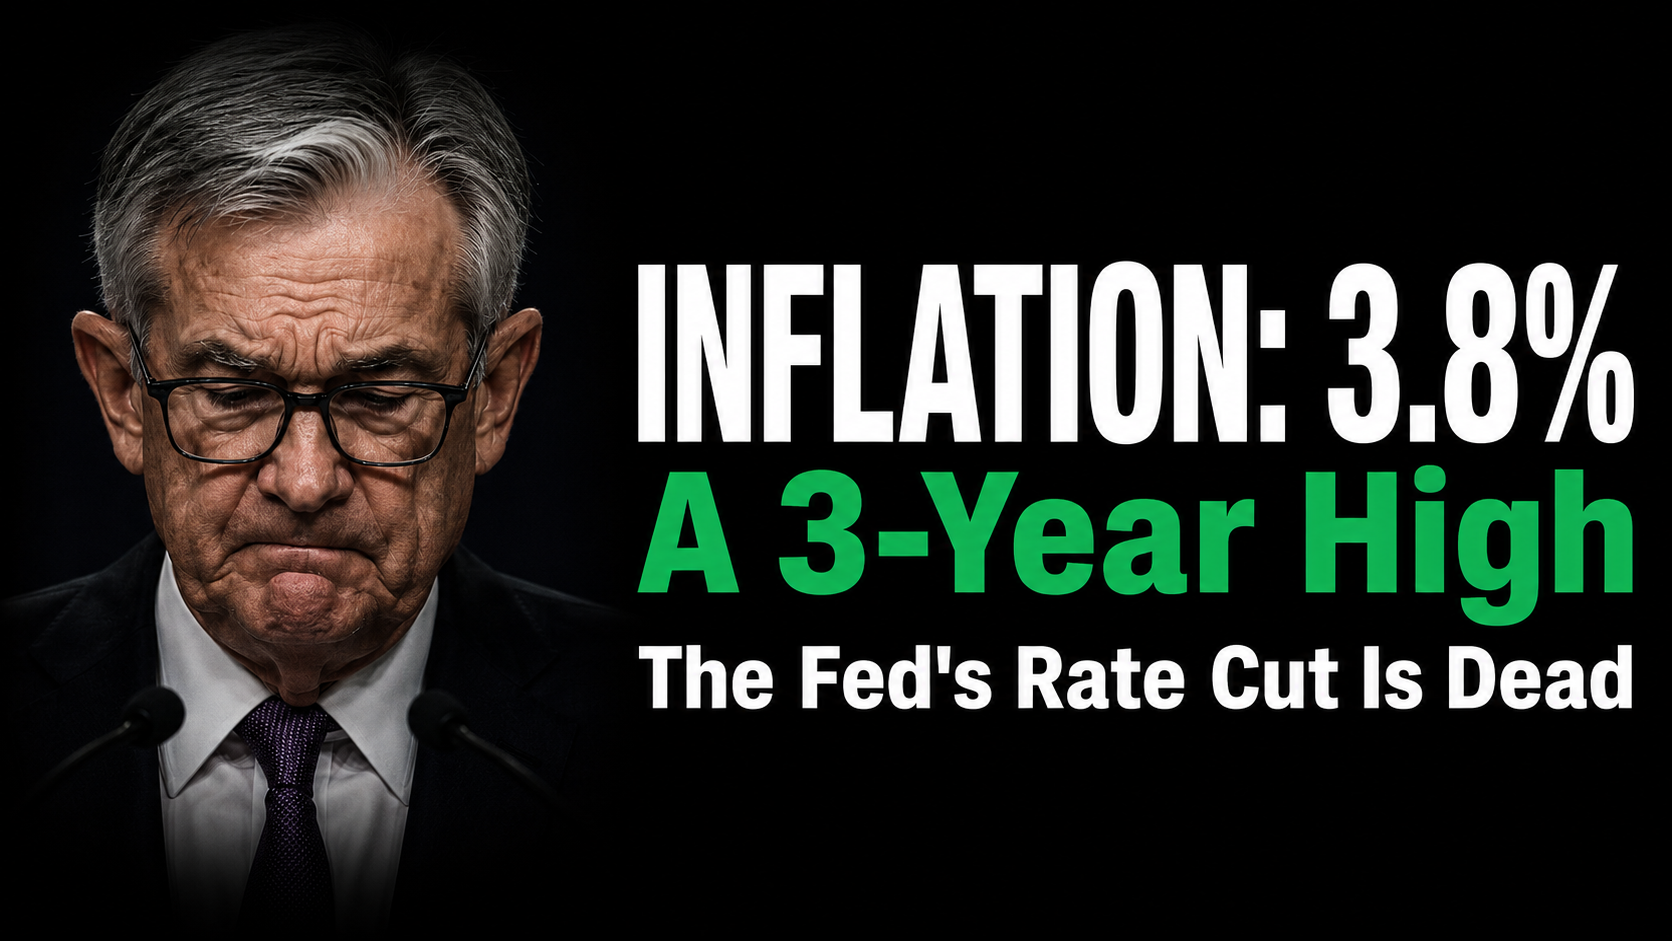
April CPI came in at 3.8% year-over-year, a 3-year high that beat estimates across every single metric. Core CPI MoM printed 0.4% against a 0.3% estimate, an annualized pace approaching 5%. The rate-cut window did not narrow. It closed.
What Happened
April’s inflation report was a clean sweep in the wrong direction. Headline CPI hit 3.8% YoY (est. 3.7%), Core CPI YoY came in at 2.8% (est. 2.7%), and Core CPI MoM printed 0.4% against a 0.3% estimate. The only in-line number was headline MoM at 0.6%, and even that represents an uncomfortable acceleration. Every data point came in at or above expectations.
Key Takeaways
- Core CPI MoM at 0.4% annualizes near 5%. That is the pace of inflation, not just the level, and it is moving in the wrong direction.
- Services inflation is the sticky component. Fed Governor Goolsbee said it directly: “Drift upward in services inflation is a worry.” Services prices do not fall fast.
- Rate cuts are off the table for the foreseeable future. Markets had priced in cuts; that pricing is getting unwound now.
Financial Tech Wiz Trading Journal
Track How Your Portfolio Responds to Macro Events
On a day like this, knowing exactly how each of your positions reacted to the CPI print is the difference between learning and guessing. The Financial Tech Wiz Trading Journal imports your trades automatically from 25+ brokers and tracks P&L, win rate, and hold duration across all your positions.
Start Tracking Your TradesWhat It Means for Traders
The 30-year Treasury yield breached 5% following the print. That single number matters more than the CPI headline for most equity traders. When long yields spike, the math on high-multiple growth stocks gets worse immediately. Future earnings get discounted harder. Valuations that looked justified under a rate-cut scenario no longer hold.
Semiconductors took the hardest hit. MU, INTC, AMAT, and LRCX all dropped roughly 9% on the day. These are capital-intensive businesses with stretched valuations that get repriced when the discount rate moves up. If the 30-year stays above 5%, these names face continued pressure regardless of their fundamentals. It is a rates story, not a semiconductor story.
Healthcare held up as the classic defensive rotation kicked in. This is the same playbook every time rate expectations shift: capital moves out of growth and tech and into healthcare, utilities, and consumer staples. Not because those sectors are suddenly better businesses, but because they are far less sensitive to changes in the discount rate.
One thing worth noting: the Iran-Hormuz energy shock is pushing headline CPI higher, which makes the number look worse than the underlying trend. But services inflation is rising independently of energy. Fed Governor Goolsbee flagged this specifically. Seeing services inflation go up is not a transitory energy story. It is a structural one, and that is the part the Fed has the least power to dismiss.
How to Track Your Positions Through a Volatile Tape
Macro events like this are where a structured trading journal earns its keep. SPY swung nearly $6 intraday on the CPI print. Positions that looked fine pre-market were underwater by midday. If you are not logging your entry rationale, your position sizing, and how each trade responded to the macro catalyst, you are missing the data you need to improve.
The Financial Tech Wiz Trading Journal connects to 25+ brokers via SnapTrade and pulls your full trade history automatically. You get a clear view of your P&L, win rate, and hold duration across all your positions. On a day like this, that context is the difference between reacting and actually understanding what happened.
If you are not ready for a paid tool yet, start with the free trading journal template. It is a Google Sheets baseline you can use to start logging trades and tracking your own responses to market events like today.
Free Tool
Start Logging Your Trades for Free
Not ready for a paid journal? The free Financial Tech Wiz trading journal template gives you a Google Sheets baseline to track every trade, your entry rationale, and how macro events hit your positions.
Get the Free TemplateFAQ
What does the April CPI number mean for the Fed’s rate cuts in 2026?
The April CPI print effectively closes the rate-cut window for the near term. With Core CPI YoY at 2.8% and the MoM pace annualizing close to 5%, the Fed has no data-based justification to cut rates. “Higher for longer” is back as the baseline operating assumption, and markets are unwinding rate-cut pricing in real time.
Why did semiconductor stocks fall so hard after the CPI data?
Semiconductors are capital-intensive businesses with high valuations that rely on a low-rate environment to justify their multiples. When the 30-year Treasury yield spikes above 5%, investors reprice the future earnings of high-multiple names by discounting them more aggressively. MU, INTC, AMAT, and LRCX all dropped roughly 9% as rate-cut expectations came apart.
What is services inflation and why does the Fed care about it more than energy prices?
Services inflation measures price changes in things like housing, healthcare, insurance, and wages rather than physical goods or energy. It is considered “sticky” because it does not fall quickly in response to Fed rate hikes. Energy prices can spike and reverse. Services prices tend to stay elevated once they rise. Core CPI strips out food and energy specifically to isolate this underlying trend, making it the Fed’s primary inflation benchmark.
Get Your Free Trading Resources
Grab the free trading journal template plus the same tools we use to stay organized, consistent, and objective.
- Free trading journal template
- Custom indicators, watchlists, and scanners
- Access our free trading community
Enter your email below to get instant access.
No spam. Unsubscribe anytime.


