
Bear Trap Pattern: How to Spot, Avoid, and Trade It

Few things sting like shorting a stock right as it bottoms. A bear trap does exactly that: it fakes a breakdown below support, pulls short sellers in, then reverses hard and leaves them trapped in a losing position. This guide breaks down how bear traps form, the signals that expose them, and how to flip the setup from a trap you fall into to one you can trade.
Key Takeaways
- A bear trap is a false bearish breakdown: price slips below a support level, lures shorts in, then reclaims the level and squeezes them out.
- The clearest confirmation signals are weak volume on the breakdown, a fast reclaim of the broken level, and bullish divergence on RSI or MACD.
- You beat bear traps with confirmation (wait for a candle close, not just a wick), disciplined stops above structure, and a trade log that shows where you keep getting faked out.
Track your setups
Stop guessing whether you keep falling for bear traps
The Financial Tech Wiz Trading Journal logs every short and reversal, then shows your win rate and P&L by symbol and hold duration so you can see exactly where false breakdowns are costing you.
Start tracking your tradesWhat Is a Bear Trap?
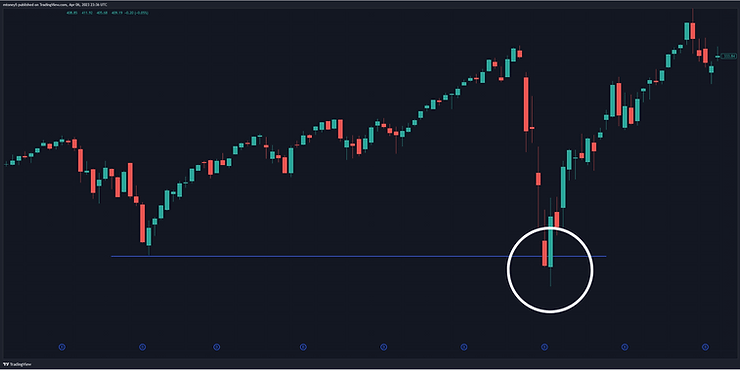
A bear trap is a technical pattern where a stock (or index, future, or crypto) breaks below a clear support level, signaling more downside, and then quickly reverses back above that level. The trap is sprung on bearish traders: anyone who shorted the breakdown or sold their position now watches price climb back, turning what looked like a clean short into a loss. Bear traps appear on every timeframe, from one-minute scalps to weekly charts, and they show up most often near widely watched levels where a lot of stop orders sit. The key idea is that the breakdown was never backed by real selling pressure, so the move had nothing to sustain it. If you are new to reading price formations, our chart patterns guide covers the broader set of setups this one belongs to.
How a Bear Trap Works, Step by Step
First, price approaches an obvious support level that many traders are watching. Second, it dips below that level, often on a sharp candle, which triggers stop-loss orders and tempts breakout-short traders to pile in. Third, the selling dries up fast because there were no committed sellers behind the move, only stop orders and reactive shorts. Fourth, buyers step in at the discount and price reclaims the broken level, frequently with a strong candle. Fifth, the reclaim forces shorts to cover, and that buying accelerates the reversal. By the time most traders realize the breakdown was fake, price is already back inside the prior range.
A quick worked example makes the sequence concrete. Say a stock has held the $50 level three times over two weeks, so every chart-watcher has a line drawn there. On the fourth test it prints $49.40 on a fast red candle. Stop orders parked just under $50 fire, breakout-short traders sell the break expecting $46, and for a few minutes the chart looks decisively bearish. Then volume fades, a buyer absorbs the supply, and the next candle closes back at $50.30. The breakdown lasted one bar. Every short that entered between $49.40 and $50 is now underwater, and as they buy to cover, price pushes toward $52. That single failed test below $50 is the entire bear trap in miniature.
What Causes Bear Traps?
Bear traps are usually manufactured by a mix of mechanics rather than one cause. Stop-loss hunting is the big one: large players know where retail stops cluster (just under support) and a brief push through that level fills those orders cheaply. Low liquidity amplifies it, because thin order books let a small amount of selling drag price through a level it could not break in normal conditions. Negative news or a scary headline can spark the initial dip, only for the market to decide the reaction was overdone. And heavily shorted names are especially prone, because a reclaim can trigger a short squeeze that turns a modest bounce into a violent reversal.
It helps to separate the spark from the fuel. The spark is whatever pushes price below support in the first place: a stop cascade, an algo probing for liquidity, a news headline, or simple end-of-day positioning. The fuel is everything that makes the reversal violent once the spark fizzles: trapped shorts that must buy back, sidelined buyers who saw a discount, and momentum traders chasing the reclaim. When the fuel is large relative to the spark (a heavily shorted, thinly traded name on a minor news dip) you get the sharpest bear traps.
Bear Traps and Short Squeezes
Bear traps and short squeezes are close cousins, and on heavily shorted stocks they often happen together. A bear trap is the chart event: a failed breakdown below support. A short squeeze is the order-flow event: shorts forced to buy back at higher prices, which adds fuel to the move up. When a stock with high short interest fakes a breakdown and then reclaims the level, the shorts who piled in on the break are immediately offside, and their forced covering can turn an ordinary reclaim into a fast, multi-day rally. That is why the most dramatic bear traps tend to appear on names where a large slice of the float is sold short: the reclaim does not just disappoint bears, it actively squeezes them. If you are short into one of these setups, the risk is not a slow grind against you, it is a gap.
How to Identify a Bear Trap
No single signal confirms a bear trap, but a cluster of them stacks the odds. Use these together rather than in isolation.
Volume on the breakdown
A genuine breakdown is backed by rising volume. A bear trap usually breaks support on weak or average volume, which tells you the move lacks conviction. If price slices through support but volume does not expand, treat the breakdown as suspect.
RSI and MACD divergence
Watch for bullish divergence: price prints a lower low while RSI or MACD prints a higher low. That divergence says momentum is not following price down, a classic precursor to a reversal and one of the most reliable bear trap tells. If you want to set these up on your charts, see our roundup of the best TradingView indicators for spotting divergence.
A fast reclaim of the broken level
The faster price climbs back above the level it just broke, the more likely the breakdown was a trap. A close back above support, especially within a candle or two, is far more meaningful than a wick.
Candlestick confirmation
Reversal candles at the lows (a hammer, a bullish engulfing, or a long lower wick) add weight, particularly when they form right at or just below the support level. Bear traps also overlap with other reversal structures: a failed breakdown can be the left side of a cup and handle pattern as price carves out a base and recovers.
Higher timeframe context
Always check the level on a bigger chart before you trust a break. A breakdown on the 5-minute that still sits well inside an intact daily uptrend is far more likely to be a trap than a real trend change. The higher timeframe tells you whether the support being tested is a meaningful structural floor or just an intraday line that big players are happy to poke through to grab liquidity.
Bear Trap vs Bull Trap
A bear trap and a bull trap are mirror images. A bear trap is a fake breakdown that traps sellers; a bull trap is a fake breakout that traps buyers. Knowing both keeps you from getting caught on either side of a false move, the same way recognizing a head and shoulders pattern helps you tell a real top from a fake one.
| Bear Trap | Bull Trap | |
|---|---|---|
| Direction of fake move | Breakdown below support | Breakout above resistance |
| Who gets trapped | Short sellers and panic sellers | Breakout buyers |
| What follows | Reversal back up | Reversal back down |
| Confirmation tell | Weak breakdown volume, fast reclaim | Weak breakout volume, fast rejection |
| Emotion exploited | Fear | Greed / FOMO |
A Real Bear Trap Example
The GameStop (GME) saga in early 2021 produced textbook bear traps. As the stock ran, it repeatedly dipped below short-term support on intraday charts, triggering stops and tempting new shorts, only to reverse violently as the heavily shorted float forced covering. Traders who shorted the breakdowns were squeezed within hours. The lesson is not about one meme stock: any name with heavy short interest and a watched support level can spring the same trap, and the reclaim is where the damage to bears actually happens. The same dynamic shows up on far less dramatic names every week, just at a smaller scale, which is exactly why having a process beats reacting to the headline of the moment.
How to Avoid Falling Into a Bear Trap
Wait for confirmation instead of reacting to the first break: a candle close below support beats a single wick through it. Size positions so one fake-out does not wreck your account, and place stops above logical structure rather than at the obvious round number where everyone else parks them. Check volume before you trust a breakdown, and zoom out to the higher timeframe, because a breakdown on the 5-minute chart is often noise inside an intact daily uptrend. Finally, avoid shorting into a falling knife on a heavily shorted name where a squeeze can detonate.
How to Trade a Bear Trap
Once you can spot one, the bear trap becomes an entry, not just a thing to dodge. The common approach is to wait for price to reclaim the broken support level and close back above it, then enter long on the reclaim with a stop just below the trap low (the wick that faked everyone out). Target the prior range high or the next resistance level, and manage the trade as the short-covering bounce plays out. This is a higher-probability long because you are entering after the trap has already shaken out weak hands, with a clearly defined invalidation point.
Risk Management: Where to Place Your Stop
Whichever side of the trap you are on, stop placement is what keeps a bad read from becoming a bad month. If you are trading the reclaim long, your stop belongs just below the trap low, the wick that faked everyone out, because a clean break back under that low says the reclaim failed and the breakdown may have been real after all. If you are still short and price is reclaiming the level against you, do not widen your stop and hope; a confirmed reclaim on rising volume is your signal to cover, not to double down. Size every position so that hitting your stop costs a small, pre-decided fraction of your account (many traders cap risk at one to two percent per trade), and set the stop before you enter, not after price starts moving. The whole edge of trading a bear trap comes from the tight, well-defined invalidation point it gives you, so honoring that stop is the entire game.
Free download
Log your first reversal trade today
Grab the free trading journal template, a simple Google Sheets tracker for recording your entries, stops, and outcomes so you can spot the setups that trap you.
Get the free templateThe Psychology Behind Bear Traps
Bear traps work because they weaponize fear. A break below support triggers loss aversion and the urge to get out before it falls further, which is exactly the panic that fuels the flush. Confirmation bias makes it worse: if you were already bearish, the breakdown feels like proof you were right, so you add to shorts at the worst moment. Recognizing these reactions in yourself is half the defense, and the other half is having a written plan you follow instead of trading the emotion.
Track Your Trades So You Stop Repeating the Trap
The fastest way to stop falling for bear traps is to see how often you actually do. Logging every short and reversal, with the setup, the level, and the outcome, turns a vague feeling that you keep getting faked out into data you can act on. The Financial Tech Wiz Trading Journal shows win rate and P&L across your positions, broken down by symbol and hold duration, so the patterns in your own trading become obvious. Beginners who are not ready for the full app can start with the free trading journal template and build the habit first.
Get Your Free Trading Resources
Grab the free trading journal template plus the same tools we use to stay organized, consistent, and objective.
- Free trading journal template
- Custom indicators, watchlists, and scanners
- Access our free trading community
Enter your email below to get instant access.
No spam. Unsubscribe anytime.
FAQ
Is a bear trap a bullish signal?
Yes, in effect. A bear trap is a failed breakdown, and once price reclaims the broken support level it often signals a move higher, which is why traders treat a confirmed bear trap as a bullish reversal setup rather than a continuation lower.
Are bear traps profitable?
They can be, on either side of the mistake. Falling for one is costly, but trading the reclaim (going long after price recovers the broken level, with a stop under the trap low) is a recognized higher-probability setup because the weak hands have already been shaken out.
What is the difference between a bear trap and a bull trap?
A bear trap is a fake breakdown below support that traps short sellers, then reverses up. A bull trap is a fake breakout above resistance that traps buyers, then reverses down. One exploits fear, the other exploits greed.
How do you confirm a bear trap?
Look for a cluster of signals rather than one: weak volume on the breakdown, a fast reclaim of the broken level (ideally a candle close back above it), and bullish RSI or MACD divergence. A reversal candle at the lows adds further confirmation.
Get Your Free Trading Resources
Grab the free trading journal template plus the same tools we use to stay organized, consistent, and objective.
- Free trading journal template
- Custom indicators, watchlists, and scanners
- Access our free trading community
Enter your email below to get instant access.
No spam. Unsubscribe anytime.







