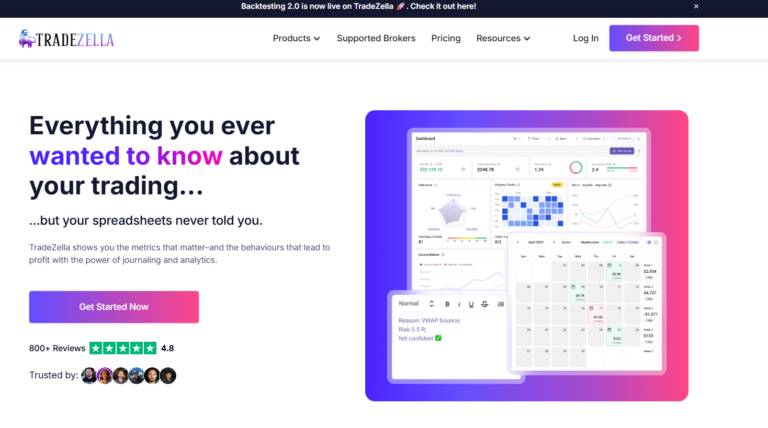
Apex Trader Funding Review (2024)

apex trader funding review

What is Apex Trader Funding?

Apex Trader Funding offers futures traders access to substantial capital through a single-step evaluation process. The platform supports a wide range of futures contracts and popular trading software like NinjaTrader and Tradovate. 

With no daily loss limits, high profit splits (100% of the first $25,000, 90% thereafter), and the ability to manage up to 20 funded accounts, Apex provides a flexible environment for traders to scale their activities. 

The firm’s trader-friendly features, including allowance for news trading and frequent payouts, make it an attractive option for both novice and experienced futures traders looking to grow their trading careers without risking personal capital. Continue reading my Apex Trader Funding review to help you determine if its the best funded trader platform for you!

Get a Funded Account With Apex Trader Funding!

Join Apex Trader Funding with my discounted link to start trading today!

Get 80% Off Apex Trader Funding

Pros and Cons of Apex Trader Funding

Pros

  • 100% profit split up to $25k
  • One-time lifetime fee option for long-term cost savings
  • Up to 20 funded accounts

Cons

  • Complex trailing drawdown
  • 10-day trading requirement between payouts
  • Strict payout request windows (1st-5th and 15th-20th)

Apex Trader Funding Pricing Structure

Apex Trader Funding offers a range of account options to suit different trading styles and capital requirements, with pricing varying based on account type, size, and platform choice. 

Whether you’re considering a Rithmic or Tradovate account, Apex provides both evaluation and performance account options with flexible monthly or lifetime fee structures. It’s important to note that Apex Trader Funding also implements an $80 reset fee, allowing traders to restart their accounts if needed. 

Let’s break down the pricing details for both Rithmic and Tradovate accounts, including evaluation accounts, static accounts, and performance accounts, to help you make an informed decision on which option best fits your trading goals and budget.

Apex Trader Funding Rithmic Account Pricing

A Rithmic evaluation account at Apex Trader Funding costs $27.40-$131.40 per month, depending on the account size you choose. Here is a table comparing all of the Rithmic pricing options:

Account TypeAccount SizeMonthly Fee
Rithmic Evaluation$25K$29.40
Rithmic Evaluation$50K$33.40
Rithmic Evaluation$75K$37.40
Rithmic Evaluation$100K$41.40
Rithmic Evaluation$150K$59.40
Rithmic Evaluation$250K$103.40
Rithmic Evaluation$300K$131.40
Rithmic Static$100K$27.40

Apex Trader Funding Tradovate Account Pricing

A Tradovate evaluation account at Apex Trader Funding costs $31.40-$135.40 per month, depending on the account size you choose. Here is a table comparing all of the Tradovate pricing options:

Account TypeAccount SizeMonthly Fee
Tradovate Evaluation$25K$33.40
Tradovate Evaluation$50K$37.40
Tradovate Evaluation$75K$41.40
Tradovate Evaluation$100K$45.40
Tradovate Evaluation$150K$63.40
Tradovate Evaluation$250K$107.40
Tradovate Evaluation$300K$135.40
Tradovate Static$100K$31.40

Apex Trader Performance Account Fees Explained

Apex Trader Funding offers two payment options for Performance Accounts (PA): monthly or lifetime fees. For Rithmic PA, the monthly fee is $85, while Tradovate PA is $105. Lifetime fees vary based on account size, ranging from $130 to $340 for Rithmic and $150 to $360 for Tradovate. 

Once you pass an Evaluation Account, you’ll receive instructions to sign PA contract documents and make a payment. Importantly, the payment option you choose (monthly or lifetime) for a specific PA account cannot be changed later, and there are no exceptions to this rule. After signing the agreements, you can access the payment link through your ATF.com Dashboard in the Signatures tab.

Apex Trader Funding Rithmic Performance Account Fees

For traders who prefer not to commit to a lifetime fee, Apex Trader Funding offers a monthly option of $85 for Rithmic accounts. However, if you’re looking to save in the long run, here’s a breakdown of the one-time lifetime fees for various Rithmic PA account sizes:

Account SizePA Activation Account Lifetime Fee
25k$130
50k$140
75k$180
100k*$220
150k$260
250k$300
300k$340

Apex Trader Funding Tradovate Performance Account Fees

For traders using Tradovate on Apex Trader Funding, there’s a monthly option of $105, or you can opt for a one-time lifetime fee that varies based on account size. Here’s a breakdown of the lifetime fees for different Tradovate PA account sizes:

Account SizePA Tradovate Activation Account Lifetime Fee
25k$150
50k$160
75k$200
100k$240
150k$280
250k$320
300k$360

Get a Funded Account With Apex Trader Funding!

Join Apex Trader Funding with my discounted link to start trading today!

Get 80% Off Apex Trader Funding

Who is Apex Trader Funding Best For

Apex Trader Funding is ideal for futures traders seeking to amplify their trading potential without personal financial risk. It caters to both newcomers and seasoned professionals who can consistently execute profitable strategies while managing risk effectively. 

The platform particularly suits active traders who thrive on market volatility, appreciate the freedom to trade news events, and aim to grow multiple accounts simultaneously. Those who value a straightforward evaluation process and are focused on rapid account growth will find Apex’s model especially appealing.

Apex Trader Funding Risk Management Rules

Apex Trader Funding (ATF) allows traders to trade up to the maximum contracts for their plan, with no daily max drawdown limit. Each plan has a specific trailing drawdown that varies; for example, a $50K plan starts with a drawdown of $2,500 below the initial balance. 

In funded accounts, the trailing drawdown stops when the liquidation threshold reaches $100 above the initial balance (e.g., $50,100 for a $50K plan). Static accounts have a fixed drawdown that does not change. The trailing drawdown always follows the highest profit point by the specified amount, and it is crucial to monitor this in real time to avoid failing the evaluation.

  • No daily max drawdown limit
  • Trailing drawdown varies by plan (e.g., $2,500 for a $50K plan)
  • Trailing drawdown stops at $100 above the initial balance in funded accounts
  • Static accounts have fixed drawdown limits

Apex Trader Funding Profit Sharing Rules

Apex Trader Funding offers 100% of the first $25,000 in profits and 90% thereafter, with payouts available twice monthly and no caps on earnings. 

  • 100% of the first $25,000 in profits
  • 90% of profits thereafter
  • Payouts available twice monthly with no caps on earnings

Tradeable Assets on Apex Trader Funding

  • Equity Futures
  • Foreign Exchange Futures
  • Agricultural Futures
  • Energy Futures
  • Interest Rate Futures
  • Metals Futures
  • Crypto Futures

Apex Trader Funding Supported Trading Platforms

  • Tradovate
  • Rithmic
  • NinjaTrader 8
  • ATAS
  • Bookmap
  • Quantower
  • Jigsaw Trading
  • Finamark
  • Edge Clear EdgePro X
  • MotiveWave
  • VolFix
  • Wealthcharts
  • TradingView Charting

Trade Ideas Review: Reviews, Pricing, Alternatives (2024)

trade ideas dashboard

If you are an active trader, it can be difficult to keep track of all your favorite stocks and assets in real time, hindering your ability to make quick and informed trading decisions. That’s why AI-powered stock and asset analysis tools are crucial to help you stay on top of the most significant news and price action.

Trade Ideas is one of the most advanced charting and AI stock scanning platforms available to traders. This article will explore its features, pricing, and user experiences to help you decide if it’s the right tool for your trading needs.

What is Trade Ideas?

Trade Ideas is a sophisticated charting platform and stock screening software that offers real-time data and analysis. It’s designed to help traders identify potential opportunities in the market quickly and efficiently.

Key Features of Trade Ideas:

  • Advanced web-based charting platform
  • Downloadable desktop platform
  • Real-time data included with paid subscriptions
  • AI-powered stock scanning capabilities
  • Highly customizable dashboard

trade ideas dashboard

Charting and Data Capabilities

Trade Ideas continues to impress with its comprehensive charting and data offerings:

  • Charting: Advanced web-based charting platform plus a downloaded desktop version
  • Data: Real-time data included with paid subscription plans
  • Asset Coverage: Stocks, ETFs, futures, crypto, and forex

However, some users have noted that the charts are not particularly user-friendly, which might be a consideration for those who rely heavily on charting tools. If you are primarily seeking a charting platform, I highly recommend TradingView since you can use most of its features for free, and the charting runs incredibly smoothly. 

Platform Overview

Trade Ideas’ strength lies in its customizability and real-time scanning capabilities. Users can tailor their view to focus on:

  • Charting
  • Screeners
  • Heatmaps

The platform’s constant market scanning is particularly useful for day traders, as it highlights stocks that are trending upward in real-time. Many users praise the platform’s ability to find stocks meeting multiple criteria that would be impossible to scan manually.

Pricing Structure

Trade Ideas offers premium pricing options, which can be a significant investment:

  • Monthly plans range from $89 to $179
  • 15% discount available through affiliate links

While the pricing may seem steep, many users find the advanced features and real-time data provide significant value. However, some reviewers suggest that a lower-priced option for just real-time data would be beneficial for low-income traders. TradingView offers real-time data wherever possible for free, down to the 1-minute charts on most platforms, making it a more economical option.

Luckily my readers can get 15% off of Trade Ideas using my discounted affiliate link below!

trade ideas coupon code

Who Benefits Most from Trade Ideas?

Trade Ideas is best suited for:

  1. Day traders
  2. Swing traders
  3. Scalpers

These traders can leverage the platform’s premium features to track stocks making significant daily moves. The platform is particularly praised for its ability to scan pre-market gaps and high relative volume stocks intraday.

Pros and Cons of Trade Ideas

Pros:

  • Exceptional real-time data
  • Highly customizable interface
  • Powerful scanning capabilities
  • Excellent customer support

Cons:

  • High price point
  • Resource-intensive software
  • Limited backtesting capabilities
  • Charts could be more user-friendly

Trade Ideas Customer Reviews

Users have shared varied experiences with Trade Ideas. Here are some highlights:

“A very rich platform for any type of trader… This program is irreplaceable in my method of trading.”

Steve Gomez

“They are seriously the leaders in this industry… It’s helped me narrow out so many opportunities that I would have otherwise missed AND I’ve become a better trader with it.”

EB J

“I use it everyday to access real time data in the market and have had next to zero issues or outages.”

Luca S

However, not all reviews are glowing. One user noted:

“I tested this for some time and didn’t find much benefits… What I hoped was to backtest some of my strategies but you only have 63 days of backtesting available. That’s not enough for anything really.”

David

Compare Trade Ideas to Other Platforms

Choosing the best trading platform for you depends on your specific trading style and needs. Similar charting and analysis platforms I recommend include TradingView, TrendSpider, and TC2000. Consider reading my comparison articles of Trade Ideas vs. other popular platforms:

Trade Ideas Review: Final Thoughts

Trade Ideas offers a powerful suite of tools for serious traders looking to gain an edge in the market. Its AI-powered scanning, real-time data, and customizable interface make it a valuable asset for day and swing traders. While the price and complexity might be prohibitive for casual investors, those who rely on quick, data-driven decisions often find Trade Ideas to be an indispensable part of their trading arsenal.

The platform’s strengths lie in its real-time scanning capabilities, customization options, and the ability to find trading opportunities that might otherwise be missed. However, potential users should consider the high price point and the learning curve associated with mastering the platform’s features.

Remember, as with any trading tool, it’s essential to combine the insights provided by Trade Ideas with your own research and risk management strategies. Consider taking advantage of their trial offers to see if the platform aligns with your trading style and needs before committing to a subscription.

How to Use my Trade Ideas Coupon Code

If you want to get 15% off of Trade Ideas, you can read my full article about how to use my Trade Ideas coupon code, or check out my video below!

TradingView Review: Features, Pricing, and Reviews (2024)

tradingview review

TradingView is a popular online platform for traders and investors to analyze financial markets with charts and fundamental data. 

The free version of TradingView is great and offers nearly real-time data for major stocks and ETFs like SPY and AAPL. Plus, you can use it to chart all markets, including stocks, ETFs, futures, crypto, forex, and more, making it a one-stop shop for all types of traders. 

TradingView also offers premium plans with more features like the ability to get real-time data, advanced indicators like the volume profile, and access to multiple charts on a single layout. 

TradingView Review – Key Takeaways

After my several years of trading and using nearly every trading platform, I rate TradingView as the best overall charting software available thanks to its freemium model, the ability to track all markets on a single platform, a large selection of indicators, and the seamless performance it provides. You can create an account and use it entirely for free, and you can always upgrade to a paid plan later on if you feel it is necessary.

TradingView Pros and Cons

Pros

Track all markets, including stocks, ETFs, futures, crypto, and forex on a single platform

Real-time data is provided at no cost whenever possible, while most competitors are delayed on free accounts

The platform performance is extremely smooth and rarely experiences lag compared to competitors

You can connect with compatible brokers and utilize real-time data if you already pay for it

Cons

If you want consistent real-time data, you must purchase it directly from the exchanges for an additional fee

TradingView Pricing and Plans

TradingView is completely free to use but offers several paid subscription options, including:

  • Essential: 2 charts per tab, 5 indicators per chart, 20 price alerts, and 20 technical alerts.
  • Plus: 4 charts per tab, 10 indicators per chart, 100 price alerts, 100 technical alerts.
  • Premium: 8 charts per tab, 25 indicators per chart, 400 price alerts, 400 technical alerts.

Here is a table comparing the pricing of the different plans:

FreeEssentialPlusPremium
Cost (monthly)$0$14.95$29.95$59.95
Cost (annually)$0$155.40 (save 13.38%)$299.40 (save 16.69%)$599.40 (save 16.69%)
Charts per tab1248
Indicators per chart251025
Saved chart layouts1510Unlimited
Watchlists1UnlimitedUnlimitedUnlimited
Price alerts520100400
Technical alerts120100400
LinksFree trialFree trialFree trial

New users can usually test the paid plans by getting a TradingView free trial. You can view our TradingView plans comparison article for more information.

Who is TradingView Best For?

TradingView is best for anybody who trades stocks, futures, crypto, or forex and wants a single platform to chart all of these assets. Many other charting platforms charge for real-time data, but TradingView offers it for free wherever it can. This means even if you don’t pay for a TradingView plan, you can still use it for charting with nearly real-time data.

Utilizing TradingView’s Features

The main features of TradingView include charting, screeners, backtesting, economic calendars, alerts, watchlists, and more! All of these features are easy to access from the home screen, so let’s cover them in depth. 

TradingView Technical Analysis Charting Review

One of the best features of TradingView is the ability to chart all markets within a single platform, including assets like stocks, ETFs, futures, forex, cryptocurrencies, and more. 

Many brokerages offer charting, but generally, they are made for just one asset class. Additionally, brokerage charting platforms are usually an afterthought, while TradingView is designed for active traders seeking advanced charting tools. Therefore, many traders will place trades on a brokerage platform while using TradingView for charting. 

TradingView also allows you to code custom indicators and strategies with its proprietary Pine Script language. There are tons of TradingView indicators you can use for free by default, plus there are paid indicators like the volume profile you can use with a premium subscription. 

Using the TradingView Screeners

Another excellent feature TradingView offers is screeners for stocks, crypto, and forex. The TradingView Screener 2.0 is the most advanced one and is free to use; you just need to sign up for a free TradingView account. 

You can customize these screeners based on your preferences, allowing you to discover trading opportunities with ease.

For example, if you are an investor, you can scan for stocks based on fundamental data like P/E ratios and EPS. Active traders can also search for high-volatility stocks based on % change and volume. The ideas are endless with TradingView’s screeners, suiting both active and long-term traders. 

Backtesting on TradingView

TradingView allows you to backtest strategies with the bar replay feature and the strategy tester. The bar replay feature is available to free users and allows you to backtest trades directly on a live chart. 

The strategy tester is a way to backtest Pine Script coded strategies. There are some community-made strategies you can use, plus you can create your own. You can read our TradingView backtesting guide for more information. 

Settings Alerts on TradingView

TradingView allows you to set alerts on both price and technical indicators. For example, you can set an alert if an asset moves above or below a specific price, allowing you to stay on top of your positions even when you aren’t actively watching the charts. You can also set alerts based on indicators, which is especially useful for indicators that provide buy and sell signals like moving average crossovers.

TradingView’s Economic Calendar

TradingView has an economic calendar you can view right next to your chart while you trade, which is great for staying on top of market-moving news like Fed announcements and economic data releases. 

You can filter by country, allowing you to pick which news is most important to you. Another feature is you can select the high-importance filter, ensuring you only see significant news events on the calendar. 

tradingview economic calendar

Creating Watchlists on TradingView

You can create and view your watchlists on TradingView by clicking the icon at the top right corner. Once you click the watchlist icon, you can create new watchlists by using the plus icon. You can change to your other watchlists by clicking on the name of the watchlist you are currently viewing to toggle between them. 

tradingview watchlists

Accessing Real-Time Data

When it comes to active trading, having access to real-time data is essential. For most instruments, you can buy real-time data from the exchanges directly through TradingView. 

Note that a paid subscription does not include real-time data as it is a subscription cost ranging from $2-$10 per month. To learn more about real-time data on TradingView, check out our detailed article on the subject.

TradingView User Reviews

Overall, TradingView has many positive reviews but also some negative ones. It has an A+ BBB rating and tons of reviews on Trustpilot you can view. Here are some recent customer reviews from credible sources:

Positive Reviews

Positive TradingView reviews praise its intuitive layout, helpful customer support, and call it an essential one-stop shop for all trading information needs.

“Simply the best place to get all trading info you may ever need for any kind of trading, from the most conservative stocks to crypto. The ultimate one-stop solution for any tech analysis.” Vlad on Trustpilot on 19 Dec 2023

“This is a fantastic platform in my opinion. I’ve been using it for a few years now (both the web version & app) and have had no issues. Everything is extremely well laid out and easy to access. What I find especially great about it, is that is has features I didn’t even know I wanted until I was in need of them. Customer service has always been on point in my experience too, I usually get a response within 24 hours. Great job TradingView … keep it up!”Edward on Trustpilot on 17 July 2023

“Great software, great tools and community. But automatic payments were ON, after 2 years they billed me 190$. I opened a support ticket, and they refunded me within a few hours. Excellent support team and software!.” – Jochem on Trustpilot on 3 July 2023

Negative Reviews

Negative TradingView reviews complain about customer service being hard to reach. Many people have trouble finding how to contact support. According to Trustpilot, the support email for TradingView is: [email protected], and the phone number is: +1 833 247 1523.  

“No phone number or email provided on website and no way to talk with anyone for billing issue. Sign up for free trial and keeps withdrawing money from our account without our authorization. Ask to open a ticket for support, however, you have to go through the list which does not have your problem at all and they design the way you never reach to the last step to open a ticket. If they don’t want to talk with the customer, why they have a business?”JH on Trustpilot on 28 Nov 2023. 

TradingView Review – My Final Take

TradingView offers a wide range of tools and charts, an active community of traders, and flexible pricing options. It is definitely worth considering if you’re looking for a trading analysis platform.

The free version of the platform is great for casual investors and allows you to view most assets with nearly real-time data for free. 

If you are actively trading and require advanced indicators, more charts per layout, and real-time data, you should consider upgrading to a paid plan. 

When you sign up for TradingView using my link, new users can usually get a free trial and a discount on a premium subscription!

TrendSpider Review – Is It Worth Paying For? (2024)

trendspider review image

TrendSpider is an advanced charting and automated AI technical analysis platform built for traders. Over my several years of trading, I have used nearly every platform available, and I believe TrendSpider is one of the best for charting. Continue reading to learn more about TrendSpider and what to consider before spending money on it.

Pros and Cons of TrendSpider

Pros

Automated technical analysis features make charting easy

Seasonality trends help you spot which months a stock performs well

Track all markets, including stocks, ETFs, futures, crypto, and forex

Use up to 16 charts per layout, which is much higher than any competitor I have used

Cons

The web-based platform can feel clunky at times, while TradingView runs a bit smoother

A bit pricy when compared to competitors

TrendSpider Special Offer!

Exclusive Deal: 25% Discount with Code FTW25

Elevate Your Trading – Join TrendSpider Today!

  • AI-Powered Analysis
  • Automated Technical Analysis
  • 16 charts per layout
CLAIM YOUR 25% DISCOUNT

Review of TrendSpider Charting & Indicators

When it comes to charting on TrendSpider, it provides everything a trader would want, including over 200 indicators to choose from and the ability to have up to 16 charts on one layout. TrendSpider offers a plethora of drawing tools, plus the automated features will draw trendlines for you. 

The platform even has its own proprietary chart type called raindrop charts, which is essentially like a volume profile built into a candle. Another feature I like about TrendSpider is the ability to set anchor points. For example, you can set the anchor point at the lowest point on the chart so your volume by price and anchored VWAP only show you the most relevant volume data. 

The only downside I have noticed about TrendSpider is the platform can feel a bit laggy at times, but it is not bad enough to be a huge burden. However, it is something to note if your computer isn’t the fastest. 

trendspider chart

TrendSpider’s Automated Technical Analysis Features

One of the best features of TrendSpider is the automated technical analysis tools. Here are all of the automated tools that TrendSpider offers:

  • Fibonacci levels – automatically draws Fibonacci retracements on your chart. My experience using this tool was hit or miss. Sometimes it worked perfectly, but sometimes I would prefer it to have drawn the retracements in different spots.
trendspider auto fibonacci tool
  • Trend lines – automatically draws several trend lines on your chart so you never miss key trends. The auto trend lines features is awesome, and it definitely catches lines that the human eye could easily miss.
trendspider auto trendline tool
  • Candlestick patterns – automatically detects candlestick patterns such as Doji and hammer candles. The auto candlestick pattern recognition is hit or miss in my experience, but it doesn’t hurt to turn it on.
trendspider auto candle pattern tool
  • Chart patterns – automatically detect triangles, head and shoulders, channels, and more. The auto chart patterns tool works well most of the time in my experience using it.
trendspider auto chart pattern tool
  • Heatmap – detects areas of support and resistance based on historical levels. The heatmap tool is a great extension to volume by price and helps highlight key levels.
trendspider auto heatmap tool

Using TrendSpider’s Scanner

Another great feature of TrendSpider is the scanner it offers, which can be prompted with a GPT condition or from a list of parameters. If you prompt the GPT parameters correctly, scanning for your exact parameters takes much less time. 

For example, instead of manually adding a parameter to scan for stocks above the 200 SMA, you can simply type “above 200 SMA,” and it will add the parameter for you. In my experience, it actually works better than I expected, and I highly recommend you try it if you are looking for an easy scanner. 

trendspiderscanner1
trendspiderscanner2

Is TrendSpider Worth It?

While TrendSpider is a bit expensive compared to its competitors, I believe it is worth it for serious traders who want automated analysis and advanced indicators. You can also take advantage of my affiliate link to save 25% on your subscription. During the checkout process, enter the coupon code FTW25 to claim your 25% off discount! TrendSpider is incredibly innovative and offers proprietary features like raindrop charts and promptable scanners. 

TrendSpider Special Offer!

Exclusive Deal: 25% Discount with Code FTW25

Elevate Your Trading – Join TrendSpider Today!

  • AI-Powered Analysis
  • Automated Technical Analysis
  • 16 charts per layout
CLAIM YOUR 25% DISCOUNT

Learn how to get a TrendSpider discount by watching this video!

While TrendSpider is great, I still believe that TradingView is the best overall charting software for most people due to its freemium model and much lower plan prices for premium features. However, TrendSpider does have more to offer than TradingView if you are willing to pay the price for it. I recommend you try several charting software out and decide which suits your needs the best before committing to an annual plan.

TradingView Limited Time Offer!

Exclusive Deal: 30-Day FREE Premium Access + Bonus Credit

Don’t Miss Out – Sign up for TradingView Now!

  • Advanced Charts
  • Real-Time Data
  • Track all Markets
CLAIM YOUR FREE TRIAL

Keep in mind you can get a 30-day free trial of TradingView’s premium features when you use my affiliate link. Consider reading my article about TrendSpider vs. TradingView to continue your research. 

Related Articles

TrendSpider Pricing

The 3 Best Options Backtesting Software

best options backtesting software

Backtesting options strategies can be difficult, but there are plenty of free and paid software to streamline the process. 

My favorite options backtesting software is Option Omega because it has one-minute data back to 2013, and works for nearly every strategy. Continue reading to learn about Option Omega and my other favorite options backtesting software.

Summary of the 3 Best Options Backtesting Software

Option Omega: Best overall with one-minute data back to 2013

tastylive Lookback: Best free options backtesting

OptionNET Explorer: Best for manual backtesting


Best Options Backtesting Software Compared

You can use the table below to compare my top picks for options backtesting software:

FeatureOption Omegatastylive LookbackOptionNET Explorer
LinkGet 50% Off Option OmegaVisit tastylive LookbackGet 10% Off OptionNET Explorer
Best ForComprehensive and fast automated backtestingBeginners and cost-sensitive usersTraders who prefer manual backtesting and integration with brokers
Historical Data1-minute data from 1/1/2013 to yesterdaySeveral tickers back to 1/1/20105-minute, connect with brokers for real-time
Tickers CoveredSPY, SPX, IWM, QQQ, TSLAMost stocks, indices, and ETFs with optionsMost stocks, indices, and ETFs with options
Key FeaturesAutomated backtesting, Portfolio feature, Export to CSVFree, Advanced trade parameters, Forward testing, Export to CSVConnect with brokers, Real-time data access, Send orders to broker
Pricing7-day trial (limited to 2017 QQQ), $99/month, $599/year, 50% off first year with my affiliate linkFree10-day trial for £10, 3 months for £160, 12 months for £525

The 3 Best Options Backtesting Software Reviewed

1- Option Omega

Option Omega is my top pick for options backtesting because it is automated, has historical 1-minute data, and allows you to build portfolios to combine multiple strategies. You can read my full review of Option Omega to learn more. 

Key features:

  • Automated backtesting for SPY, SPX, IWM, QQQ, TSLA
  • 1-minute historical data so you can accurately test 0DTE and 1-DTE strategies
  • Test from 1/1/2013 – yesterday
  • Combine several backtests with the portfolio feature
  • Export backtests to CSV file to analyze further

option omega test parameters

Pros and Cons of Option Omega

Here are the pros and cons of Option Omega:

ProsCons
1-minute historical data, as close to real-time as possibleLimited to only 5 tickers
Can run 10+ year backtests dating back to 2013 in minutesCannot manually backtest
Highly customizable parameters
Available for $50 per month with my affiliate link, making it cheaper than OptionNET Explorer

Option Omega Pricing

Option Omega PricingDetails
7-day Free TrialLimited to 2017 QQQ
Monthly Subscription$99 per month
Annual Subscription$599 billed annually
Discount Offer50% off your first year with my affiliate link


2- tastylive’s Lookback

tastylive’s Lookback is great if you want to get started with backtesting options for free. It includes every major ticker, and allows you to get a feel for automated backtesting software. However, if you want to set advanced parameters and have the most accurate data, Option Omega is better. 

Key features:

  • Lookback is free, allowing anybody to get started with no barrier to entry
  • Ability to backtest individual trades
  • Set basic trade parameters for automated backtesting 
  • Forward testing capabilities
  • Test several tickers dating back to 1/1/2010
  • Export results to CSV file

tastylive lookback

Pros and Cons

Here are the pros and cons of tastylive Lookback:

ProsCons
Free to useLess customizable parameters than Option Omega
Automatic backtesting with many tickersData is likely not 1-minute historical data
Ability to export data to CSV

3- OptionNET Explorer (ONE)

OptionNET Explorer (ONE) is an excellent software to use if you run advanced multi-leg strategies that rely on several adjustments. Trades like the space trip trade (STT) and other advanced strategies require advanced software like ONE to track. Platforms like thinkorswim do a decent job at tracking these, but it becomes harder after a few adjustments. 

Key features:

  • 5-minute historical data
  • Connect with thinkorswim, IBKR, and Tradier, to monitor your live positions
  • Get free access to real-time data by connecting your brokers live data feed
  • Ability to send orders directly to your broker

optionnet explorer

Pros and Cons

Here are the pros and cons of OptionNET Explorer:

ProsCons
Connects with various brokersNo automated backtesting features
5-minute historical data for manual backtestingNo monthly pricing option

OptionNet Explorer Pricing

ONE costs 10GBP (~ $12) for a 10-day trial, 160GBP (~ $200) for 3 months, and 525GBP (~ $660) for one year.

OptionNet Explorer PricingDetails
10-day Trial10 GBP (about $12)
3 Months Subscription160 GBP (about $200)
Annual Subscription525 GBP (about $660)

Manual Backtesting vs. Automated Backtesting Software

Automated backtesting is when you set trade parameters and let the backtesting software do all of the work for you. A manual backtest is when you open, close, and stop out of all of your trades one by one while logging your results. 

Automated backtesting is generally preferred since it takes much less time, but it gives you less control over the results. Manual backtesting is best for testing complex multi-leg strategies since automated software may skew the results if some trades incur wide bid-ask spreads. 

For example, if your strategy only involves selling naked puts, automated backtesting will be fine. However, if you want to test an iron condor strategy, which involves four legs, manual backtesting will give you more control. 

Related Resources

thinkorswim vs. tastytrade (Formerly tastyworks) Comparison

tastytrade vs thinkorswim

I have used thinkorswim and tastytrade personally, and they are both great platforms for both active traders and long-term investors. tastytrade offers lower commissions for futures trading, but lacks in charting features compared to thinkorswim. Another difference is thinkorswim is owned by Schwab, giving you access to banking and other additional features tastytrade does not offer. tastytrade also offers crypto trading, while thinkorswim and Schwab do not.

Full disclousure, the links to tastytrade in this article are my referral link, and will give you a sign-up bonus. I may also receive a referral bonus at no extra cost to you.

Overview of thinkorswim

thinkorswim is a trading platform that is currently available for Charles Schwab and TD Ameritrade account holders. thinkorswim offers one of the best platforms for active traders thanks to its advanced charting features, active trader, and customizability make it an excellent platform for active day traders and long-term investors alike. 

tastytrade and thinkorswim were both founded by Tom Sosnoff. TD Ameritrade bought the thinkorswim platform in 2009 for $750m, and IG bought tastytrade in 2021 for $1b.

Overview of tastytrade

tastytrade (formerly tastyworks) is a brokerage platform owned by IG. It was designed to specialize in options trading and has the tastylive education network streaming live on the platform every day. tastytrade is an excellent platform for active traders, providing competitive futures and options pricing, an active trader tab, and live education. 


tastytrade vs thinkorswim

Pros and Cons

thinkorswim Pros

– Advanced charting and analytical tools catering to traders of all levels.

– Wide range of investable assets, including stocks, options, futures, and more.

– Highly customizable interface and trading environment.

thinkorswim Cons

– The platform’s extensive features might overwhelm new traders.

– Requires a TD Ameritrade account, which might be a barrier for some international traders.

tastytrade Pros

– Specializes in options trading with comprehensive tools and resources

– Offers the tastylive network for daily live trading education and insights.

– Competitive pricing structure for active traders.

tastytrade Cons

– May have a steeper learning curve for beginners not focused on options.

– Limited in terms of asset variety compared to more comprehensive platforms.


Options Trading on thinkorswim and tastytrade

thinkorswim and tastytrade are both excellent platforms for options traders. Both provide options chains with tons of customizability, allowing you to view the option data that matters to you whether it is delta, volume, or open interest. Both platforms also offer competitive pricing options and futures options.

thinkorswim vs. tastytrade Pricing

Featurethinkorswim Pricingtastytrade Pricing
Option Commissions$0.65 per contract$1 to open, free to close ($.07 fee per contract)
Futures Commissions$2.25 (+$1.40 fee) per contract$1.25 (+$0.30 fee) per contract
Futures Options Commission$2.25 (+$0.57 fee) per contract$2.50 to open (+$0.30 fee per contract), free to close
Micro Futures$2.25 (+$0.37 fee) per contract$0.85 (+$0.30 fee) per contract
Micro Futures Options$2.25 (+$0.22 fee) per contract$1.50 to open (+$0.30 fee per contract), free to close

The main difference is that thinkorswim is more cost-effective if you plan to let your option contracts expire since tastytrade frontloads the pricing when you open. 

Technical Analysis and Charting

thinkorswim takes the lead in technical analysis and charting, offering a more extensive array of tools and indicators than tastytrade. Its platform is designed to accommodate the needs of technical traders with customizable charts, a wide range of technical indicators, and drawing tools.

tastytrade does provide some solid charting tools, but it lacks advanced indicators like the volume profile and level II data.

Mobile Apps

tastytrade and thinkorswim offer solid mobile apps, but overall the tastytrade app provides a better user experience. The thinkorswim app seems a bit dated and overly complex, while the tastytrade app is more modern and provides a less clunky interface.

Fundamental Analysis Data & News

tastytrade and thinkorswim provide financial data and news directly in the platform, but thinkorswim is overall better when it comes to finding news articles per ticker and accurate fundamental data. 

thinkorswim provides real-time fundamental data like market cap and shares outstanding. tastytrade also offers similar features, but it is newer and seems not to be as consistent. 

thinkorswim has an excellent news widget where you can type a ticker and view relevant news stories for any company. tastytrade has some news available on its dashboard, but it doesn’t offer company-specific news. 

Data & Trading Execution

thinkorswim offers level II data, while tastytrade does not, giving thinkorswim the edge when it comes to advanced data availability. However, both platforms offer real-time data for free with a funded account. 

Both platforms also offer an active trader tab, allowing you to get in and out of trades quickly. 

Related Articles

TradingView vs. thinkorswim

TrendSpider vs. TradingView

Webull vs. thinkorswim

How to Invest in Minecraft Stock

TrendSpider vs. TradingView | Which is Best For You? (2024)

tradingview vs trendspider comparison

If you are looking for a powerful and reliable platform to analyze and trade the financial markets, you might have come across TradingView and TrendSpider.

In this article, we will compare TradingView and TrendSpider based on their main features, benefits, drawbacks, and pricing. By the end of this article, you will have a clear idea of which platform suits your needs and preferences better.

TradingView is best if you want advanced charting tools for the best price, while TrendSpider is best for those looking for additional features like automated technical analysis and more charts per layout.

Feature TradingView TrendSpider
Starting Price $14.95/month plus extra for real-time data $107/month (real-time data included/except futures)
Charts Per Layout Up to 8 charts Up to 16 charts
Built-in Indicators Over 1000 built-in indicators plus thousands of custom indicators created by the community Over 190 built-in indicators
Discount Links Get a TradingView Free Trial TrendSpider Code: FTW25 For 25% Off

Overview of TradingView

TradingView is one of the most widely used platforms for charting, screening, and trading the financial markets. It supports a wide range of markets and data sources, including international stocks, bonds, forex, crypto, and futures.

You can access TradingView from any web browser or mobile device, as well as integrate it with popular brokers such as Oanda, Interactive Brokers, TradeStation, and more.

Some of the main features and benefits of TradingView are:

  • A powerful and user-friendly screener that allows you to filter by technical and fundamental criteria, such as price, volume, indicators, earnings, dividends, ratings, and more.
  • A large library of indicators and drawing tools, as well as the ability to create custom indicators using Pine Script, a proprietary coding language that is easy to learn and use.
  • A direct broker integration that enables you to trade from the platform without switching to another application or website. You can also use paper trading to practice your strategies without risking real money.
  • A social network that enables you to share your ideas, learn from experts, and access live streams and trade signals. You can also join chat rooms, follow other traders, comment on charts, and participate in contests.

If you want to try TradingView risk-free, you can sign up for a TradingView free trial to test out all of the premium features at no cost! When you use my affiliate link to register, you will also get a discount on your subscription. You can also read my full review of TradingView to learn more.

TradingView Limited Time Offer!

Exclusive Deal: 30-Day FREE Premium Access + Bonus Credit

Don’t Miss Out – Sign up for TradingView Now!

  • Advanced Charts
  • Real-Time Data
  • Track all Markets
CLAIM YOUR FREE TRIAL

Overview of TrendSpider

TrendSpider is a great alternative to TradingView for those who want a more advanced platform with automated technical analysis tools and more charts per layout.

TrendSpider is a relatively new platform that aims to automate technical analysis and make it easier and faster for traders. It uses artificial intelligence and machine learning to draw trendlines, chart patterns, Fibonacci retracements, candlestick patterns, and more. It also allows you to create custom strategies and backtest them with historical data.

Some of the main features and benefits of TrendSpider are:

  • An advanced automated chart pattern recognition that draws trendlines, chart patterns, Fibonacci retracements, candlestick patterns, and more. You can also adjust the sensitivity and accuracy of the automation according to your preferences.
  • A no-code custom strategy builder and backtester that allows you to test different scenarios and optimize your trading performance. You can use predefined templates or create your own based on custom parameters.
  • A comprehensive technical screener that incorporates pattern recognition and multiple timeframes. You can scan for stocks that match your criteria across different timeframes simultaneously.
  • An alternative data integration that provides insights from social media sentiment, analyst estimates, dark pool volume, short volume, and more. You can use these data sources to complement your technical analysis and find hidden opportunities.
  • Proprietary raindrop charts

If you want to try TrendSpider out, you can get 25% off your subscription using my affiliate link and the code: FTW25! You can also read my full review of TrendSpider for more information.

TrendSpider Special Offer!

Exclusive Deal: 25% Discount with Code FTW25

Elevate Your Trading – Join TrendSpider Today!

  • AI-Powered Analysis
  • Automated Technical Analysis
  • 16 charts per layout
CLAIM YOUR 25% DISCOUNT

Factors to Consider Between TradingView & TrendSpider

Both TradingView and TrendSpider offer excellent features and benefits for traders of all levels and styles. However, there are some differences between them that you should consider before choosing one over the other. Here is a table comparing some key features of TradingView and TrendSpider:

Indicator Selection

Both TradingView and TrendSpider offer plenty of indicators for technical analysis. However, there are some differences in their indicator selection that might affect your trading style.

TradingView Indicator Selection

TradingView offers session volume profiles, which show the distribution of volume within a specific day. This is great for day traders who enjoy using volume or market profile.

svp

TradingView also has a large community of people creating custom indicators using Pine Script, which is a proprietary coding language that is easy to learn and use. You can find thousands of custom indicators on TradingView’s public library or create your own based on your needs and preferences.

TrendSpider Indicator Selection

TrendSpider only offers volume by price, which shows the distribution of volume across different price levels over several days. The volume by price can be anchored from anywhere on the chart, so technically, you can anchor it at the start of the day to simulate a session volume profile.

TrendSpider does not have a similar community custom indicator feature, but its team is a lot more responsive and knowledgeable about trading, reducing the need for the community aspect.

Backtesting

Backtesting is the process of testing your trading strategies with historical data to evaluate their performance and profitability. Both TradingView and TrendSpider allow you to create and backtest your own trading strategies with custom parameters.

TradingView Backtesting

TradingView allows you to manually backtest your strategies by applying them to the chart and seeing how they would have performed in the past.

You can also write your own trading strategies using Pine Script, which gives you more flexibility and control over your logic and rules.

You can then use TradingView’s strategy tester to analyze the results of your backtesting, such as net profit, drawdown, win rate, and more.

TrendSpider Backtesting

TrendSpider allows you to create your own trading strategies without coding using its no-code custom strategy builder. You can use predefined templates or create your own based on custom parameters, such as indicators, patterns, timeframes, and more.

You can then use TrendSpider’s automated backtester to test your strategies with historical data and see how they would have performed in the past. The backtester allows you to compare different strategies and optimize them based on various metrics, such as net profit, drawdown, win rate, and more.

Multiple Chart Abilities

TrendSpider allows you to view up to 16 charts per layout, which is more than TradingView’s non-professional plans, which only offer up to 8 charts per layout.

This can give you more flexibility and convenience when analyzing multiple markets or timeframes at once. However, if you need more than 8 charts per layout on TradingView, you can upgrade to a professional plan that offers up to 16 charts per layout.

Another difference is that TrendSpider allows you to sync your charts across different timeframes, which means that when you change the timeframe on one chart, it will automatically change on all the other charts in the same layout.

trendspidermultiplecharts
Trendspider 16 Charts in a Layout

This can help you keep your analysis consistent and save time when switching between timeframes. TradingView does not have this feature, but you can use its split-screen mode to view different timeframes side by side.

You can read this article to learn more about using TradingView multiple charts.

Stock Screeners

Both TradingView and TrendSpider offer excellent stock screeners that allow you to filter stocks based on various criteria. However, there are some differences in their stock screeners that might affect your trading results.

TradingView Screeners

TradingView offers a technical and fundamental screener that allows you to filter stocks by technical and fundamental criteria, such as price, volume, indicators, earnings, dividends, ratings, and more.

You can also use TradingView’s social network integration to find stocks that are popular or trending among other traders. You can access live streams, trade signals, chat rooms, and more from TradingView’s social network.

TrendSpider Screeners

TrendSpider offers a technical screener that incorporates pattern recognition and alternative data integration. You can filter stocks by technical criteria, such as indicators, patterns, timeframes, and more.

You can also use TrendSpider’s pattern recognition feature to find stocks that match specific chart patterns or candlestick patterns across multiple timeframes. Additionally, you can use TrendSpider’s alternative data integration to find stocks that have unusual options volume, high social media sentiment, positive analyst estimates, high dark pool volume, high short volume, and more.

Mobile App

Both TradingView and TrendSpider have solid mobile apps that make charting on the go relatively easy. However, the web platforms are, of course, much better in terms of functionality and features.

TradingView Mobile App

TradingView’s mobile app is available for iOS and Android devices. It allows you to access most of the features of the web platform, such as charts, indicators, drawing tools, and more. However, some features are not available on the mobile app, such as Pine Script editor, strategy tester, split screen mode, and more.

TrendSpider Mobile App

TrendSpider’s mobile app is only available for iOS devices. It allows you to access most of the features of the web platform, such as charts, indicators, drawing tools, screeners, pattern recognition, and more. However, some features are not available on the mobile app, such as strategy builder, backtesting, alternative data integration, and more.

Pricing

TrendSpider is slightly more expensive than TradingView, but it also comes with more features and real-time data at no additional cost. TradingView charges for real-time data on top of the subscription charge, although many popular ETFs like SPY are just barely 1 second delayed without paying on TradingView.

TradingView’s pricing starts from $14.95/month for the basic plan and goes to $59.95/month for the highest tier subscription.

However, these prices do not include real-time data for most markets. You have to pay extra charges for real-time data depending on the market you want to access.

TrendSpider’s pricing starts from $39/month for the standard plan and goes up to $179 per month for the highest tier

trendspider pricing
Sign up for TrendSpider

These prices include real-time data for most markets except futures. You have to pay extra charges for futures data depending on the exchange you want to access.

TradingView vs. TrendSpider | Bottom Line

TradingView and TrendSpider are both excellent platforms for charting, screening, and trading the financial markets. However, they have some differences that might make one more suitable for you than the other.

Ultimately, the choice between TradingView and TrendSpider depends on your personal preferences and trading goals. You can try both platforms for free for a limited time and see which one works better for you. Alternatively, you can use both platforms together to get the best of both worlds.

Check out my article about getting a TrendSpider free trial and a TradingView free trial for more information about signing up.

If you have made it this far, learn how to use our TrendSpider coupon code to get a discount on your subscription!

tradingview vs trendspider comparison

Related Articles

TrendSpider Review

TradingView Review

TrendSpider Pricing

thinkorswim vs. tastytrade

TradingView vs. thinkorswim

Investing in Minecraft Stock

Trendspider Coupon Code 25% Off! – FTW25 (2024)

trendspider coupon code

Are you looking for a way to save money on your TrendSpider subscription? If so, you’re in luck.

I have a special TrendSpider coupon code that will give you a 25% discount on any plan.

All you have to do is use click my TrendSpider affiliate link and enter the code FTW25 at checkout when you sign up or upgrade your account.

This is an exclusive offer for my readers, so don’t miss this opportunity to get the best deal on TrendSpider.

How to Get a TrendSpider Discount

TrendSpider is a powerful and innovative platform that helps traders with technical analysis, charting, and automation.

It offers a range of features and tools that can enhance your trading performance and efficiency. However, TrendSpider is not cheap.

Depending on the plan you choose, you can pay up to $199 per month.

That’s why I’m happy to share with you my TrendSpider discount code that will save you 25% on any plan.

To get this discount, all you have to do is follow these simple steps:

  1. Click on this link to go to the TrendSpider website.
  2. Click get started, and choose the plan for prefer.
  3. Fill in your personal details, and when prompted, enter the coupon code FTW25 in the box.
  4. Complete your registration and enjoy your discounted membership!

That’s it. You’ve just secured your TrendSpider discount for life. As long as you keep your subscription active, you’ll pay less than the regular price.

trendspider coupon code

Why Use TrendSpider for Technical Analysis?

TrendSpider is not just another charting platform. It’s a smart and automated system that can help you with technical analysis, market scanning, backtesting, and more. Here are some of the reasons why you should use TrendSpider for your trading:

  • Volume by price: TrendSpider allows you to see the volume distribution at different price levels, which can help you identify support and resistance zones, breakouts, and reversals.
  • Automated analysis: TrendSpider uses algorithms to detect trendlines, patterns, Fibonacci retracements, candlestick formations, and other technical indicators automatically. You can also customize the settings to match your own style and preferences.
  • Real-time data: TrendSpider includes real-time data for stocks, ETFs, forex, crypto, and futures in all plans. You don’t have to pay extra for data feeds or worry about delays or inaccuracies.
  • Dynamic price alerts: TrendSpider lets you set alerts based on various criteria, such as price movements, technical indicators, patterns, or even custom scripts. You can receive notifications via email, SMS, or browser when your conditions are met.
  • Automated trading bots: TrendSpider enables you to create and run trading bots that can execute your trades based on your rules. You can backtest your strategies, optimize your parameters, and monitor your performance.

These are just some of the benefits of using TrendSpider for technical analysis. There are many more features and tools that you can explore and use to improve your trading results.

TrendSpider Discount Code – Bottom Line

TrendSpider is a great platform for any serious trader who wants to take their technical analysis to the next level. It offers a unique combination of automation, intelligence, and customization that can help you find trading opportunities faster and easier.

If you want to get started with TrendSpider today, don’t forget to use my coupon code FTW25 to get a 25% discount on any plan.

Check out my other articles about TrendSpider, such as my full TrendSpider review and my comparison of TrendSpider vs. TradingView.

Related Resources

TradingView vs. thinkorswim: A Detailed Comparison

a table comparing tradingview and thinkorswim

If you are looking for a trading platform that can help you perform technical analysis and execute trades, you may have come across TradingView and thinkorswim. These are two of the top trading platforms for technical analysis, but they have different features, costs, and suitability for different types of traders.

In this article, we will compare TradingView and thinkorswim in detail and help you decide which one is better for you.

✔ TradingView is a charting and trading platform that connects with brokers

✔ thinkorswim is a trading platform for Schwab or TD Ameritrade accounts

✔ While you can trade on TradingVIew, it is more commonly used for just charting and analysis

I personally prefer to use a combination of TradingView for charting and either thinkorswim, Robinhood, or tastytrade to place my trades.

Platform Compatible Brokers Assets Offered Options Trading Pricing
TradingView Try TradingView Various brokers, including Interactive Brokers, Tradovate, AMP Global, OANDA, Forex.com, and Gemini Stocks, bonds, commodity futures, currencies, and cryptocurrencies Analyze nearly live options chains and risk diagrams Freemium service with different plans ranging from $12.95 to $59.95 per month. You can also get a free trial.
thinkorswim Try thinkorswim Only TD Ameritrade & Schwab Stocks, bonds, commodity futures, currencies, and Bitcoin futures Supported with options chain data and P&L charts Free platform for TD Ameritrade & Schwab customers

How TradingView and thinkorswim Differ in Terms of Brokers and Assets

One of the first things to consider when choosing a trading platform is which brokers and assets it supports.

TradingView is a freemium service that provides you with charting, news, stock screeners, advanced indicators, and many more features. It also integrates with various brokers and offers trading for most asset classes, including cryptocurrencies. Many people use TradingView for charting, and place their trades on a separate brokerage account. TradingView is not a brokerage, but a software traders use for charting and other tools.

thinkorswim is also a charting platform, but it is owned by the brokerage Schwab, meaning you must have an funded Schwab or TD Ameritrade account to use the platform. thinkorswim is a free platform that only works with Schwab and TD Ameritrade and offers trading for stocks, options, bonds, futures, currencies, and Bitcoin futures.

Here are some of the advantages and disadvantages of each platform in terms of brokers and assets:

TradingView

Pros

  • View free charts with nearly real-time data for stocks, futures, crypto, and forex
  • Supports trading for stocks, bonds, commodity futures, currencies, and cryptocurrencies
  • Integrates with a variety of brokers, such as Interactive Brokers, Tradovate, AMP Global, OANDA, Forex.com, and Gemini
  • Allows you to trade directly from the charts or use paper trading to practice without risking real money

Cons

  • The level of integration may vary depending on the broker and the asset class
  • Does not support options trading, but does provide options analysis tools
  • Requires a paid subscription to access advanced features and services

thinkorswim

Pros

  • Supports trading for stocks, options, bonds, commodity futures, currencies, and Bitcoin futures
  • Fully integrated with TD Ameritrade’s brokerage services and account management
  • Supports options trading and includes options chain data and risk diagrams for multi-leg options strategies

Cons

  • Only works with Schwab (formerly TD Ameritrade) and requires a TD Ameritrade or Schwab account to use the platform
  • Does not support cryptocurrency trading or provide cryptocurrency price data
  • May have higher commissions and fees than some other brokers

Based on this comparison, TradingView may be the better choice for traders who want to trade a wider range of asset classes, especially cryptocurrencies, and have more flexibility in choosing their broker. Thinkorswim may be the better choice for traders who are already TD Ameritrade or Schwab customers or who want to trade options.

thinkorswim vs tradingview
thinkorswim

How TradingView and thinkorswim Compare in Terms of Technical Analysis

Technical analysis is the process of using charts, indicators, and patterns to analyze the price movements of an asset and predict its future direction. Both TradingView and thinkorswim offer comprehensive and customizable charting tools and indicators, but they have some differences in their technical analysis features.

TradingView excels in technical analysis and offers a wide range of charting tools and indicators. It is also more beginner-friendly and has a built-in trader community. Thinkorswim also provides robust charting capabilities and is known for its high-quality charts. It also supports options trading and includes options analysis tools.

Here are some of the similarities and differences between the two platforms in terms of technical analysis:

TradingView

Pros

  • Offers over 100 chart types, including candlestick, line, bar, renko, heikin ashi, kagi, point & figure, and more
  • New users can usually get a 30-day free trial when you use my link
  • Provides over 50 drawing tools, such as trend lines, channels, Fibonacci retracements, pitchforks, Gann tools, and more
  • Includes over 100 pre-built indicators, such as moving averages, oscillators, volume indicators, volatility indicators, and more
  • Allows you to create your own custom indicators using Pine Script or import indicators from other users
  • Has a built-in trader community where you can share your ideas, follow other traders, and get feedback

Cons

  • Requires a paid subscription to access more advanced features, such as the volume profile indicator, multiple charts per layout, intraday data, extended trading hours, and more
  • Does not support options trading or provide options analysis tools
tradingview vs thinkorswim
TradingView

thinkorswim

Pros

  • Offers over 20 chart types, including candlestick, line, bar, monkey bars, and more
  • Provides over 30 drawing tools, such as trend lines, channels, Fibonacci retracements, pitchforks, Gann tools, and more
  • Includes over 300 pre-built indicators, such as moving averages, oscillators, volume indicators, volatility indicators, and more
  • Allows you to create your own custom indicators using thinkScript or import indicators from other users

Cons

  • Has a steeper learning curve and may be overwhelming for beginners
  • Does not have a built-in trader community or a social media integration
  • May have some compatibility issues when using the desktop or mobile platform

Based on this comparison, TradingView may be the better option for traders who want to use a wider range of charting tools and indicators, or who want to interact with other traders and learn from their ideas. Thinkorswim may be the better option for traders who want to use options analysis tools.

How TradingView and thinkorswim Differ in Terms of User Interface and Design

User interface and design are important factors for trading platforms as they affect the user experience and satisfaction. A good user interface should be easy to navigate, intuitive to use, and visually appealing. A good design should be modern, responsive, and customizable.

TradingView has a more user-friendly and modern interface, while thinkorswim has a more vintage and customizable interface. Both platforms offer a web-based version as well as a desktop and mobile version.

Here are some of the pros and cons of each platform in terms of user interface and design:

TradingView

Pros

  • Has a simple and intuitive interface that is easy to use for beginners and experts alike
  • Has a modern and sleek design that is aesthetically pleasing and professional-looking
  • Has a web-based platform that can be accessed from any browser without downloading or installing anything
  • New users can usually get a free trial and a discount using this link

Cons

  • Has a limited customization options for the interface layout, colors, fonts, etc.
  • Has a desktop and mobile version that may not have all the features and functions of the web-based platform

thinkorswim

Pros

  • Has a high level of customization options for the interface layout
  • Has a desktop platform that is fast and reliable and offers more features and functions than the web-based platform

Cons

  • Has a complex and cluttered interface that may be confusing and overwhelming for beginners
  • Has a dated and bulky design that may not be appealing to some users
  • The desktop platform can get laggy at times, depending on your PC

Based on this comparison, TradingView may be the better choice for traders who want to use a simple and modern interface that is easy to use and access from any browser. Thinkorswim may be the better choice for traders who want to use a more customizable interface that offers more features and functions on the desktop platform.

How TradingView and thinkorswim Compare in Terms of Pricing and Plans

Pricing and plans are another important aspect to consider when choosing a trading platform, as they affect the access to features and services. TradingView is a free platform with optional pay-to-use service that offers different plans depending on the features and services needed, while thinkorswim is a free platform that comes with a TD Ameritrade or Schwab account.

Here are some of the details and differences between the two platforms in terms of pricing and plans:

TradingView

  • Offers four plans: Free, Essential, Plus, and Premium
  • The Basic plan is free and offers limited features, such as one chart per layout, one alert, three indicators per chart, etc.
  • The Pro plan costs $14.95 per month or $155.40 per year and offers more features, such as two charts per layout, 10 alerts, five indicators per chart, etc.
  • The Pro+ plan costs $29.95 per month or $299.40 per year and offers even more features, such as four charts per layout, 30 alerts, 10 indicators per chart, etc.
  • The Premium plan costs $59.95 per month or $599.40 per year and offers the most features, such as eight charts per layout, 200 alerts, 25 indicators per chart, etc.
  • All paid plans offer additional benefits, such as intraday data, extended trading hours, priority customer support, etc.
  • Usually offers a 30-day free trial for any paid plan

TradingView Limited Time Offer!

Exclusive Deal: 30-Day FREE Premium Access + Bonus Credit

Don’t Miss Out – Sign up for TradingView Now!

  • Advanced Charts
  • Real-Time Data
  • Track all Markets
CLAIM YOUR FREE TRIAL

thinkorswim

  • Is free to use and only requires a funded account
  • Comes with a TD Ameritrade or Schwab account, which may have commissions and fees for trading certain assets
  • Offers all the features and services without any limitation or restriction

Based on this comparison, TradingView may be the better option for traders who want to access more advanced and expansive features and services, and who don’t mind paying a monthly or yearly fee. Thinkorswim may be the better option for traders who want to use a free platform with comprehensive features and services, and who are already TD Ameritrade customers or don’t mind opening an account with them.

TradingView vs. thinkorswim: Which Trading Platform Is Better for You?

In conclusion, TradingView and thinkorswim are both excellent trading platforms for technical analysis, but they have different features, costs, and suitability for different types of traders. Here is a summary of the main differences and similarities between the two platforms:

  • TradingView is a freemium service that integrates with various brokers and offers trading for most asset classes, including cryptocurrencies. Thinkorswim is a free platform that only works with TD Ameritrade or Schwab and offers trading for stocks, bonds, futures, currencies, and Bitcoin futures.
  • TradingView excels in technical analysis and offers a wide range of charting tools and indicators. It is also more beginner-friendly and has a built-in trader community. Thinkorswim also provides robust charting capabilities and is known for its high-quality charts. It also supports options trading and includes options analysis tools.
  • TradingView has a more user-friendly and modern interface, while thinkorswim has a more advanced and customizable interface. Both platforms offer a web-based version as well as a desktop and mobile version.
  • TradingView offers different plans depending on the features and services needed, while thinkorswim comes with a TD Ameritrade or Schwab account and offers all the features and services without any limitations or restrictions.

Based on this comparison, TradingView may be the better choice for traders who want to trade a wider range of asset classes, especially cryptocurrencies, and have more flexibility in choosing their broker.

TradingView may also be the better choice for traders who want to use a wider range of charting tools and indicators, or who want to interact with other traders and learn from their ideas. TradingView may also be the better choice for traders who want to use a simple and modern interface that is easy to use and access from any browser.

Thinkorswim may be the better choice for traders who are already TD Ameritrade or Schwab customers or those who want to trade options. Thinkorswim may also be the better choice for traders who want to use options analysis tools.

However, the final decision should be based on your individual preferences and trading requirements. You can try out both platforms and see which one suits you better. You can also read more articles on TradingView compared to other platforms like TradingView vs. NinjaTrader, TradingView vs. Webull, Barchart vs. TradingView, or TradingView vs. Finviz to learn more about their features and benefits.

FAQ: TradingView vs Thinkorswim

Is TradingView compatible with TD Ameritrade?

No, TradingView is not compatible with TD Ameritrade. TradingView works with a variety of different brokers, but TD Ameritrade is not one of them. On the contrary, Thinkorswim is exclusive to TD Ameritrade and Schwab clients and only allows trading through a TD Ameritrade or Schwab account.

Is TradingView the best charting tool?

TradingView is widely regarded as one of the best charting tools available online. Technical analysts favor it for its wide range of technical indicators, drawing tools, and charting features that can be customized. It also supports the automation of trading strategies through its Pine Script programming language.

Can I trade directly from TradingView?

Yes, you can trade directly from TradingView if you have an account with one of the supported brokers. TradingView integrates with brokers such as Interactive Brokers, Tradovate, AMP Global, OANDA, Forex.com, and Gemini. You can also use paper trading to practice your skills without risking real money.

How much is TradingView a month?

TradingView offers both free and paid subscription plans. The free version provides access to basic features, while the paid plans unlock additional features and data. The paid plans range from $14.95 to $59.95 per month, depending on the level of service and billing frequency. If you use my link, you can get a discount on your premium subscription!

Do I need a broker for TradingView?

No, you can use TradingView’s charting features without a broker. However, if you want to place trades, you will need a brokereage account, which TradingView does not provide. TradingView does not provide brokerage services itself but rather connects you with various brokers that offer different asset classes and trading conditions

Before you go

If you want to keep educating yourself about personal finance, you must check out these posts as well:

thinkorswim vs. tastytrade

What is the Most Successful Options Strategy

Options Trading for Income: The Complete Guide

Mark Minervini’s Trading Strategy: 8 Key Takeaways

The Best Options Trading Books

TradingView Pricing Guide

The Best Laptops and Computers for Trading

The Best Monitors for Trading

How to Get a TradingView Free Trial

The Best TradingView Indicators

TrendSpider vs. TradingView

TrendSpider Free Trial

TrendSpider Discount Code

TradingView vs. MT4 Charting Tools Compared

tradingview vs mt4 table comparison

TradingView and MT4 are both trading platforms that allow you to access the forex market, but they are not brokers. You still need to open an account with a broker that supports these platforms and execute your trades through them.

However, these platforms are not exactly the same. They have different features, advantages, and disadvantages that you should consider before choosing one over the other. In this article, we will mainly focus on the charting features of TradingView and MT4.

tradingview vs mt4 table comparison
Get a TradingView Free Trial

TradingView Overview

TradingView is a web-based charting platform that was launched in 2011. It has quickly become one of the most popular and widely used charting tools among traders of all levels and markets. TradingView offers more than just forex trading; you can also access stocks, futures, cryptocurrencies, and other instruments on its platform.

TradingView has a modern and user-friendly interface that allows you to customize your charts with various tools, indicators, drawing tools, and timeframes. You can also access a large community of traders who share their ideas, strategies, and analysis on the platform.

MT4 Overview

MT4 is a downloadable software platform that was launched in 2005 by MetaQuotes. It is one of the oldest and most widely used trading platforms in the forex industry. MT4 is designed specifically for forex trading, and it offers both trading and analytical features.

MT4 has a simple and customizable interface that allows you to create your own charts with various technical analysis tools, indicators, scripts, and expert advisors (EAs). You can also backtest your strategies and optimize your parameters on the platform.

tradingview vt mt4 image
MT4

FeatureTradingViewMetaTrader 4
IndicatorsOver 100 built-in indicators plus custom indicators with Pine Script.30 built-in indicators plus and ability to use thousands of custom indicators.
BacktestingAbility to backtest, paper trade, and optimize trading strategies.Ability to backtest using the strategy tester and trading bots.
Stock screenersAdvanced screeners to filter several assets based on many criteriaNo stock screeners are available.
Trading executionSupport trading from charts with supported brokers.Execute trades from the chart with supported brokers.
Broker availabilitySupport various brokers, including IBKR, Forex.com, Oanada, and more.Supports brokers, including Oanda, Forex.com, FXCM, and more.
Other featuresHeatmap, economic calendars, alerts, paper trading, backtesting, mobile app.Free trading robots, expert advisors (EA), mobile trading.
Get a TradingView Free Trial

TradingView Pros & Cons

Pros

  • TradingView is free to use and sign up. However, if you want to unlock more advanced features, such as more indicators, alerts, multiple charts per layout, etc., you can upgrade to one of its paid plans: Essential, Plus, or Premium.
  • TradingView offers a free trial to test all of its premium features for 30 days. You can cancel anytime if you are not satisfied with the service.
  • TradingView has a wide range of instruments that you can trade on its platform. You can access more than just forex; you can also trade stocks, futures, cryptocurrencies, commodities, indices, bonds, CFDs, and more.
  • TradingView has a modern and intuitive interface that makes it easy to use and navigate. You can customize your charts with various tools, indicators, drawing tools, timeframes, layouts, themes, etc.
  • TradingView has more advanced charting tools and indicators than MT4. You can access over 100 built-in indicators, including some unique ones created by TradingView users. You can also create your own indicators using Pine Script, a programming language designed for TradingView.
  • TradingView has more features that enhance your trading experience, such as heatmaps, screeners, economic calendars, watchlists, trading alerts, paper trading, backtesting, etc.

Cons

  • TradingView isn’t great for trading options, but you can view options chains and risk diagrams.
  • You will need to execute your trades through a broker that supports TradingView or trade on a separate broker while using TradingView for charts only.

tradingview vs mt4 tv chart
TradingView Chart

MT4 Pros & Cons

Pros

  • MT4 is free to download and use. However, you will need to open an account with a broker that supports MT4 and execute your trades through them.
  • MT4 is reliable and stable. It has been around for a long time and has proven its performance and functionality in the forex market. It rarely crashes or freezes, and it can handle high volumes of data and orders.
  • MT4 supports automated trading. You can use EAs to automate your trading strategies and execute them on the platform. You can also backtest your EAs and optimize your parameters on the platform.

Cons

  • MT4 is outdated and limited. It has not been updated or improved much since its launch in 2005. It lacks some of the features and tools that modern traders need, plus it looks old.
  • MT4 has a lack of instruments. It only supports forex trading, and it does not offer access to other markets or instruments, such as stocks, futures, cryptocurrencies, etc.
  • MT4 has a lack of chart timeframes compared to TradingView. On MT4, you can only access nine standard timeframes: M1, M5, M15, M30, H1, H4, D1, W1, and MN. On TradingView, you can access more than 20 timeframes, including custom ones, such as M2, M3, M10, H2, H8, etc. You can also access tick charts on TradingView, which show every price movement in the market.
  • MT4 has a lack of indicators compared to TradingView. On MT4, you can only access about 30 built-in indicators, and some of them are outdated or redundant. On TradingView, you can access over 100 built-in indicators, including some unique ones created by TradingView users. You can also create your own indicators using Pine Script, a programming language designed for TradingView.
  • MT4 has an outdated and complex interface that makes it hard to use and navigate. You may need to spend some time and effort to learn how to use the platform and customize it to your preferences.

TradingView vs MT4 – Bottom Line

TradingView and MT4 are both popular and widely used trading platforms for forex traders. However, they have different features, advantages, and disadvantages that you should consider before choosing one over the other.

TradingView is a web-based charting platform that offers more advanced charting tools and indicators than MT4. It also offers access to more instruments and markets than MT4. It has a modern and user-friendly interface that makes it easy to use and navigate. It also has a large and active community of traders who share their ideas and analysis on the platform.

MT4 is a downloadable software platform that offers both trading and analytical features for forex trading. It is reliable and stable, and it supports automated trading with EAs. It is customizable and flexible, and it supports multiple languages and platforms. However, it is outdated and limited in terms of charting tools, indicators, timeframes, and instruments.

Ultimately, the best platform for you depends on your personal preferences, trading style, and goals. However, it is clear that TradingView is a better all around trading and charting platform.

If you want to try TradingView for yourself and see how it compares to MT4, you can sign up for a free account here and get a free trial of TradingView. When you use my affiliate link, you will also get a discount on your membership!

I hope this article has helped you understand the differences between TradingView and MT4 charting tools and make an informed decision on which one is best for you.