How to View Implied Volatility and IV Rank/Percentile on TradingView
Implied volatility plays a crucial role in options trading, providing insights into the market’s expectations for future price movements. This article will explore how to view and interpret implied volatility on TradingView.
Understanding Implied Volatility (IV)
Implied volatility represents the market’s perception of the magnitude of potential price changes in an underlying asset. A stock’s implied volatility is generally high before major news events like earnings. When implied volatility is high, options will be more expensive since traders expect the stock to move significantly, making options more attractive.
- Implied volatility is not a forecast of future volatility but rather a reflection of market expectations.
- Factors such as market sentiment, supply and demand dynamics, and upcoming events influence it.
- Higher implied volatility indicates a greater expected range of price movements, while lower implied volatility suggests relatively stable price behavior.
- If you want a brokerage built for options traders, consider signing up for a tastytrade account.
- tastytrade allows you to plot implied volatility and IV rank on your chart for free if you trade with them.
Using TradingView to View Implied Volatility
Here’s how you can access and analyze implied volatility on TradingView:
- Navigating to the Symbol’s Chart: After logging into TradingView, search for the symbol you want to analyze and open its chart.
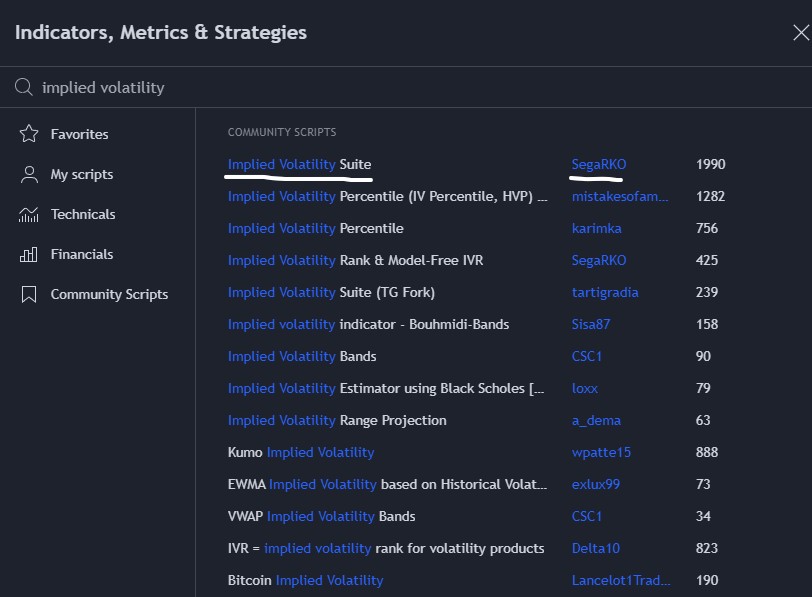
- Adding the IV Indicator: Click indicators at the top left of the chart, then type in ‘implied volatility..’ Next, click the implied volatility suite by SegaRKO.
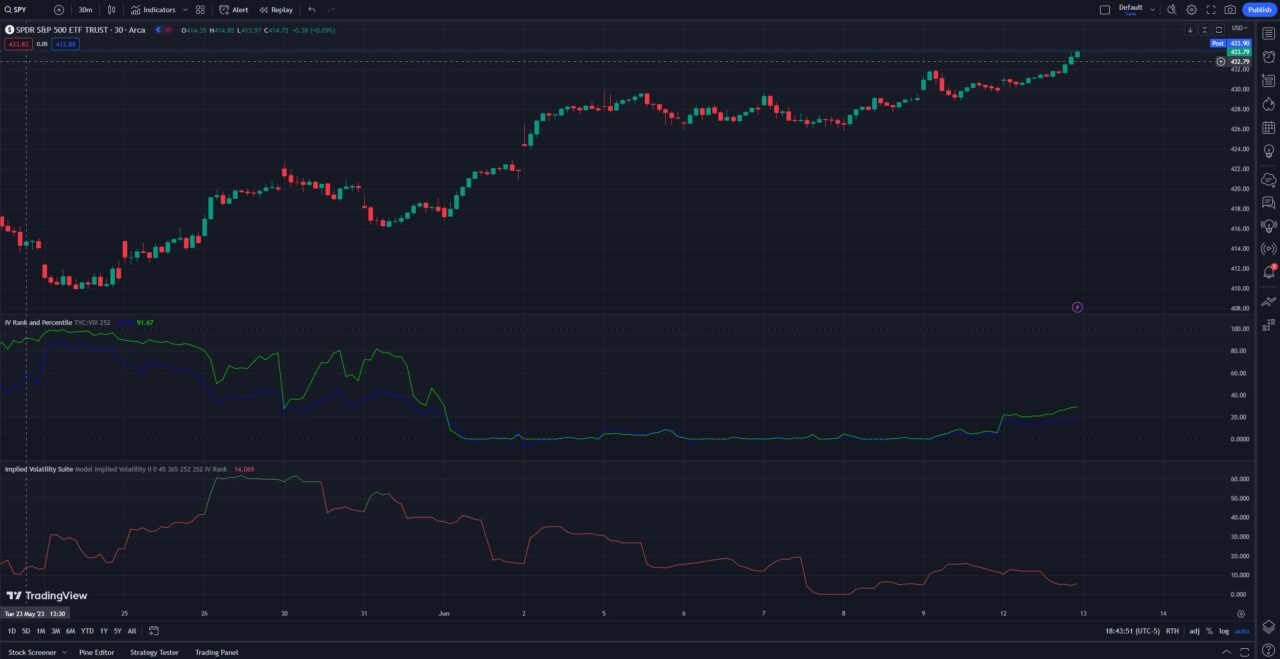
- View IV on Your Chart: Once you have added this indicator, you will be able to see implied volatility on your TradingView chart.
Analyzing IV Rank & IV Percentile on TradingView
In addition to viewing implied volatility, TradingView allows you to analyze IV rank and IV percentile. These metrics help you assess the relative value of implied volatility compared to what it was historically. Implied volatility will vary significantly between stocks, so using IV rank or IV percentile helps you compare apples to apples.
How to Add IV Rank and Percentile on TradingView
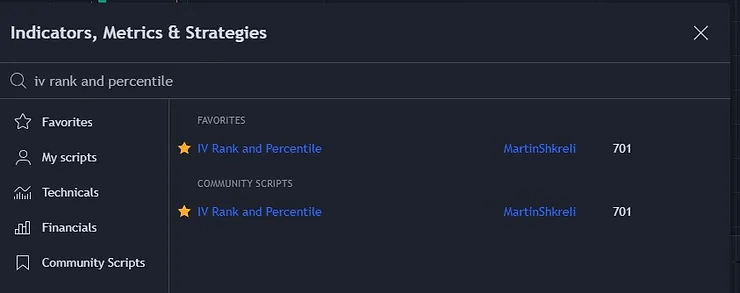
You can utilize the custom IV Rank and Percentile indicator by MartinShkreli, which allows you to view implied volatility rank, and implied volatility percentile on TradingView. Here is how you can add it to your TradingView chart:
- Simply follow the link to the indicator and scroll down to add it to your favorites
- Next, open any chart, and search for IV Rank and Percentile
- Click the indicator to add it, and now you can view IV rank and percentile on your TradingView chart
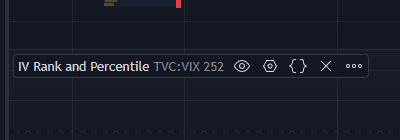
- Configuring IV Rank and IV Percentile Indicators: Once you’ve added the IV rank and IV percentile indicators to your chart, customize the settings to suit your preferences. Generally, traders prefer to use the default length of 252 days (one year) when viewing IV rank and percentile.
- Hover Over the IV Rank and Percentile Text to Change the Settings: At the bottom left of your chart, if you hover over the name of the indicator, you will see the settings icon appear, which allows you to customize the indicator settings.
- IV Rank vs. IV Percentile Readings: IV rank represents the percentile ranking of the current implied volatility compared to its historical range, while IV percentile indicates the percentage of time that the implied volatility has been lower than the current level. Generally, they are pretty similar, so either one can be used to effectively determine whether IV is high or low.
When analyzing IV rank and IV percentile on TradingView, consider the following:
- High IV rank suggests the current implied volatility is relatively high compared to its historical range (usually one year), indicating potentially favorable conditions for options sellers.
- Low IV rank implies that the current implied volatility is relatively low, which may present opportunities for options buyers.
- IV percentile provides a quantitative measure of the current implied volatility level, giving you insights into how frequently the volatility has been lower in the past.
Advanced Tips for Using Implied Volatility Charts on TradingView
To further enhance your analysis of implied volatility on TradingView, consider these advanced tips:
- Generally, IV rank and percentile are viewed on the daily chart. Implied volatility can be used on all timeframes.
- You can combine implied volatility analysis with price or volume indicators to validate signals and identify potential opportunities. If you combine volatility indicators with tools like the volume profile, you can enhance your strategy.

Implied Volatility Charts on TradingView | Bottom Line
By utilizing TradingView’s charting tools and custom indicators, traders can view implied volatility, implied volatility rank, and implied volatility percentile on their TradingView charts.
For more in-depth information and resources on options charts, implied volatility rank on thinkorswim, and the best TradingView indicators, you may find these articles on our blog helpful: Options Charts, Implied Volatility Rank on thinkorswim, and Best TradingView Indicators.
FAQ: TradingView Implied Volatility
What is implied volatility?
Implied volatility is a measure of the expected future volatility or price variance of an asset. It reflects the market’s sentiment and is often used in options trading to forecast potential price changes.
How is implied volatility calculated?
Implied volatility is typically calculated from options using mathematical models like the Black-Scholes formula. TradingView, however, calculates implied volatility indirectly from the spot price using a model or a model-free approach like the VIXfix.
How can I access and analyze implied volatility on TradingView?
To access and analyze implied volatility on TradingView, you can navigate to the symbol’s chart and add a custom implied volatility (IV) indicator. This will provide you with the necessary data and analysis tools to interpret implied volatility levels.
What does implied volatility indicate in options trading?
Implied volatility in options trading indicates the market’s expectations regarding future price movements. Higher implied volatility suggests greater uncertainty and potential for larger price swings, while lower implied volatility indicates more stability and smaller price fluctuations.
Is implied volatility available for all symbols on TradingView?
Implied volatility on TradingView may be available for a wide range of symbols, but the availability may vary. It is recommended to check the platform and specific symbol you are interested in to determine if implied volatility data and analysis are provided.
Can I customize and create my own implied volatility indicators on TradingView?
TradingView offers a variety of customization options, including the ability to create and modify indicators. While the platform provides pre-built implied volatility indicators, you can also explore creating your own custom indicators tailored to your specific needs and trading strategies.
What are IV rank and IV percentile?
IV rank and IV percentile are metrics that help you assess the relative value of implied volatility. They compare the current implied volatility with its historical range over a certain period of time.
How can I view IV rank and IV percentile on TradingView?
To view IV rank and IV percentile on TradingView, you can add custom scripts or indicators that calculate and visualize these metrics. For example, you can use the Implied Volatility Suite TG Fork or the IV Rank and Percentile indicators.
How can I use IV rank and IV percentile in options trading?
By comparing the current implied volatility with its historical range, IV rank and IV percentile can help you determine when options are overpriced or underpriced and how to adjust your trading strategies accordingly. Generally, high IV rank or IV percentile indicates overpriced options, while a low IV rank or IV percentile indicates underpriced options.
Get Your Free Trading Resources
Grab the free trading journal template plus the same tools we use to stay organized, consistent, and objective.
- Free trading journal template
- Custom indicators, watchlists, and scanners
- Access our free trading community
Enter your email below to get instant access.
No spam. Unsubscribe anytime.


