How to Draw a Rectangle on TradingView: A Step-by-Step Guide
TradingView is one of the most popular platforms for traders and investors who want to analyze and trade the financial markets. It offers a variety of tools and features that make it easy to create and customize charts, indicators, strategies, and more.
One of the tools that you can use on TradingView charts is the rectangle tool. Rectangles are useful for highlighting areas of interest, support and resistance levels, price ranges, breakouts, and patterns on the chart. They can also help you visualize your trading plan and manage your risk and reward.
In this article, I will show you how to draw a rectangle on TradingView in five simple steps.
Step 1: Open any chart on TradingView
The first step to draw a rectangle on TradingView is to open any chart that you want to analyze. You can use the search box at the top left corner of the screen to find the symbol that you are interested in.
Step 2: Locate the drawing tool panel on the left
The next step is to locate the drawing tool panel on the left side of the screen. This is where you can find all the different drawing tools that you can use on your chart.
To access the drawing tool panel, you can click on the brush icon on the left side of the screen. You will see a list of different drawing tools that you can choose from.
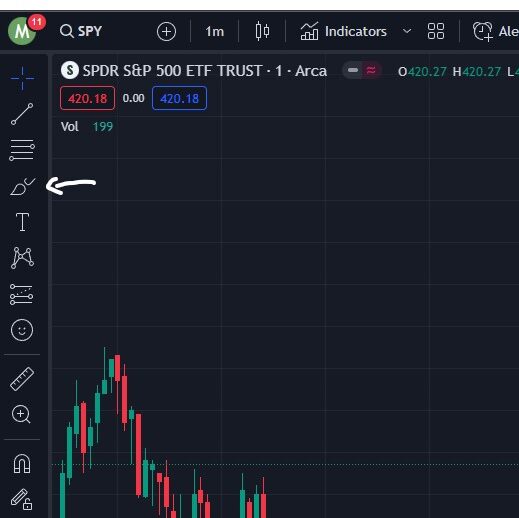
To find the rectangle tool, you can scroll down the list and look for it. To select the rectangle tool, you can simply click on it.
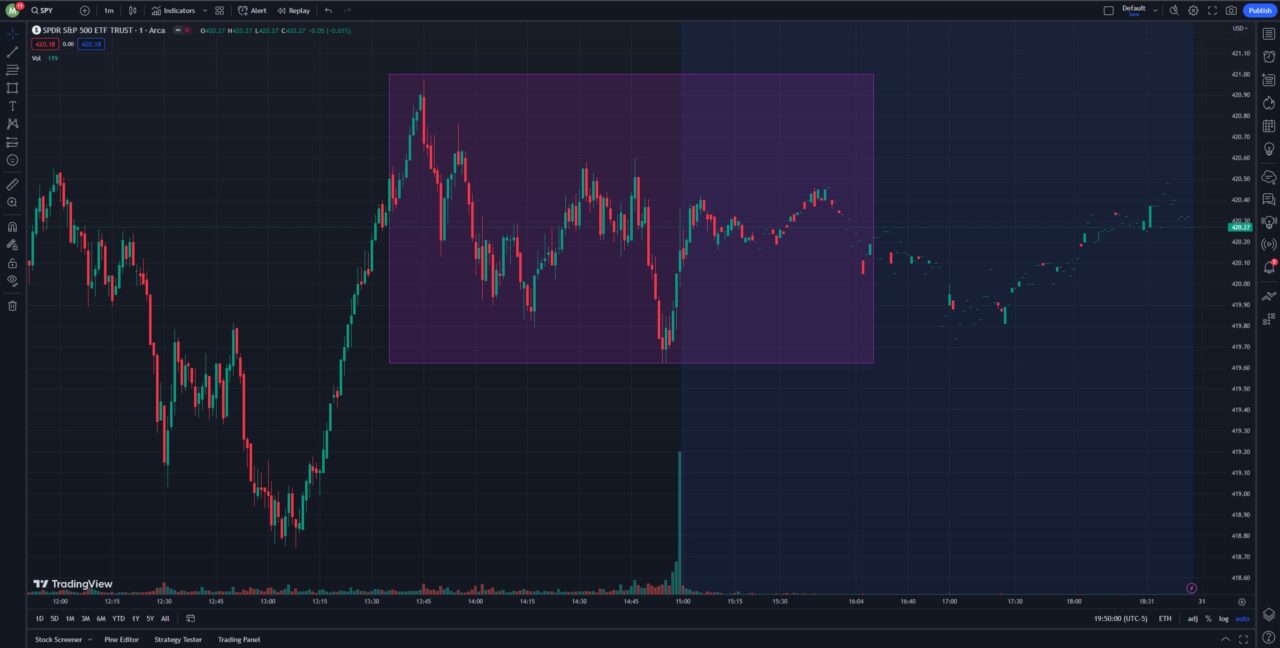
Step 3: Draw a rectangle on the chart
The third step is to draw a rectangle on the chart using the rectangle tool.
- The way to do this is to simply click on the chart twice. This means that you click on the chart where you want to start the rectangle, then move your cursor to where you want to end the rectangle and click again. The rectangle will be drawn between the two points.
You can adjust the size and position of the rectangle by moving the dots at the corner of the rectangle. You can also move the entire rectangle by clicking and dragging the middle dot.

Step 4: Customize the appearance of the rectangle
The fourth step is to customize the appearance of the rectangle according to your preference. You can change various aspects of the rectangle, such as its color, opacity, border style, text, and more.
To customize the appearance of the rectangle, you need to right-click on the rectangle and select “Settings” from the menu. You will see a dialog box where you can adjust the properties of the rectangle.
Here are some of the things that you can change in the settings dialog:
- Border: You can change the color of the border as well as its thickness and style. You can also choose to hide the border completely.
- Background: You can toggle the visibility, color, and opacity level of the rectangle background. You can also choose to fill the background with a gradient or a pattern.
- Text: You can add text to the rectangle and choose its position, font, size, color, and alignment. You can also add a background color and a border to the text.
- Coordinates: You can change the coordinates of the rectangle by entering the values for the top left and bottom right corners. You can also lock the coordinates to prevent accidental changes.
- Visibility: You can choose which timeframes and symbols to show or hide the rectangle on. You can also choose to show or hide it on all charts.
Step 5: Delete or modify the rectangle
The fifth and final step is to delete or modify the rectangle if you want to. There are several ways to do this:
- To delete the rectangle, you can right-click on the border of the rectangle and select “Remove drawing” from the menu. You can also press the delete key on your keyboard while selecting the rectangle. Another way is to click on the edge of the rectangle and click on the trash can icon that appears.
- To modify the rectangle, you can right-click on the border of the rectangle and select “Edit” from the menu. You can also double-click on the border of the rectangle to open the settings dialog. From there, you can change any of the properties of the rectangle as explained in step 4.
Conclusion: How to Draw a Rectangle on TradingView
In this article, you have learned how to draw a rectangle on TradingView in five simple steps. You have also learned how to customize, delete, or modify the rectangle according to your preference.
https://youtube.com/watch?v=H-8zFQkO42I%3Fautoplay%3D0%26mute%3D0%26controls%3D1%26origin%3Dhttps%253A%252F%252Fwww.financialtechwiz.com%26playsinline%3D1%26showinfo%3D0%26rel%3D0%26iv_load_policy%3D3%26modestbranding%3D1%26enablejsapi%3D1%26widgetid%3D1
Rectangles are useful tools for highlighting areas of interest, support and resistance levels, price ranges, breakouts, and patterns on the chart. They can also help you visualize your trading plan and manage your risk and reward.
I hope you have found this article helpful and informative. If you aren’t using TradingView yet, new users can usually sign up for a free trial plus get a discount when you use my link!
Get Your Free Trading Resources
Grab the free trading journal template plus the same tools we use to stay organized, consistent, and objective.
- Free trading journal template
- Custom indicators, watchlists, and scanners
- Access our free trading community
Enter your email below to get instant access.
No spam. Unsubscribe anytime.


